. 2017 Oct 17:4:170150.
doi: 10.1038/sdata.2017.150.

RNA sequencing analysis of activated macrophages treated with the anti-HIV ABX464 in intestinal inflammation

Affiliations

RNA sequencing analysis of activated macrophages treated with the anti-HIV ABX464 in intestinal inflammation

Laurent Manchon et al. Sci Data. .

Abstract

RNA-Seq enables the generation of extensive transcriptome information providing the capability to characterize transcripts (including alternative isoforms and polymorphism), to quantify expression and to identify differential regulation in a single experiment. To reveal the capacity of new anti-HIV ABX464 candidate in modulating the expression of genes, datasets were generated and validated using RNA-seq approach. This comprehensive dataset will be useful to deepen the comprehensive understanding of the progression of human immunodeficiency virus (HIV) associated with mucosal damage in the gastrointestinal (GI) tract and subsequent inflammation, providing an opportunity to generate new therapies, diagnoses, and preventive strategies.


Conflict of interest statement

The authors declare no competing financial interests.

Figures

Figure 1
Figure 1. Reads distribution on reference gene.
Because of variable lengths of reference genes, the average length of genes is divided into N equal parts. Each equal part is called a window. X-axis shows the relative position of genes, and Y-axis shows the number of reads in each window.
Figure 2
Figure 2. Histogram distribution of genes on expression level of each sample.
X-axis is FPKM value (the coordinate has been changed by logarithm for better view). Y-axis is gene number of corresponding FPKM.
Figure 3
Figure 3. Scatter plots of all expressed genes in each pairwise.
X-axis and Y-axis present log2 value of gene expression. Blue means down-regulation gene, orange means upregulation gene and brown means non-regulation gene. If a gene expressed just in one sample, its expression value in another sample will be replaced by the minimum value of all expressed genes in control and case samples. Screening threshold is on top legend.
Figure 4
Figure 4. Statistic of differentially expressed genes.
X axis represents pairwise and Y axis means number of screened DEGs. Blue bar denotes down-regulated genes and orange bar for the up-regulated.
Figure 5
Figure 5. Intersection heatmap of DEGs for each cluster plan.
Only genes that differentially expressed in all pairwises of cluster plan are used to build this heatmap. Gradient color barcode at the right top indicates log2 (FC) value (FC, Fold-Change of expression in treatment case to expression in control case). Each row represents a DEG and each column represents a condition pairwise (for some reason in R method, if there is only one pairwise, the pairwise name doesn’t appear in bottom). DEGs with similar fold-change value are clustered both at row and column level.
Figure 6
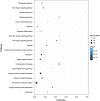
Figure 6. Statistics of pathway enrichment of DEGs in each pairwise.
RichFactor is the ratio of differentially expressed gene numbers annoted in this pathway term to all gene numbers annoted in this pathway term. Greater richFator means greater intensiveness. Qvalue is corrected pvalue ranging from 0~1, and less Qvalue means greater intensiveness. We just display the top 20 of enriched pathway terms.
Figure 7
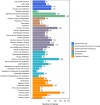
Figure 7. KEGG classification on DEGs for each pairwise.
X axis means number of DEGs. Y axis represents second KEGG pathway terms. All second pathway terms are grouped in top pathway terms indicated in different color.

Dataset use reported in

  • doi: 10.1038/s41598-017-04071-3

References

Data Citations

    1. Chebli K., Papon L., Hahne M., Manchon L., Tazi J. 2017. Figshare. https://dx.doi.org/10.6084/m9.figshare.4811035 - DOI - PubMed
    1. 2017. NCBI Gene Expression Omnibus. GSE97062
    1. Chebli K., Papon L., Hahne M., Manchon L., Tazi J. 2017. Figshare. https://dx.doi.org/10.6084/m9.figshare.4757974 - DOI - PubMed
    1. Chebli K., Papon L., Hahne M., Manchon L., Tazi J. 2017. Figshare. https://dx.doi.org/10.6084/m9.figshare.4810825 - DOI - PubMed
    1. Chebli K., Papon L., Hahne M., Manchon L., Tazi J. 2017. Figshare. https://dx.doi.org/10.6084/m9.figshare.4811077 - DOI - PubMed

References

    1. Chebli K. et al. The anti-HIV candidate ABX464 dampens intestinal inflammation by triggering IL22 production in activated macrophages. Scientific Reports 7, 4860 https://dx.doi.org/doi:10.1038/s41598-017-04071-3 (2017). - PMC - PubMed
    1. Wang Z. et al. RNA-Seq: a revolutionary tool for Transcriptomics. Nature Reviews Genetics. 10, 57–63 (2009). - PMC - PubMed
    1. Mortazavi A. et al. Mapping and quantifying mammalian transcriptomes by RNA-Seq. Nature Methods. 5, 621–628 (2008). - PubMed
    1. Estes J. D. et al. Damaged intestinal epithelial integrity linked to microbial translocation in pathogenic simian immunodeficiency virus infections. PLoS Pathog. 6, e1001052 (2010). - PMC - PubMed
    1. Hao X. P. et al. Experimental colitis in SIV-uninfected rhesus macaques recapitulates important features of pathogenic SIV infection. Nat Commun 6, 8020 (2015). - PMC - PubMed

MeSH terms