

Constructing regional climate networks in the Amazonia during recent drought events
- PMID: 29040296
- PMCID: PMC5645106
- DOI: 10.1371/journal.pone.0186145
Constructing regional climate networks in the Amazonia during recent drought events
Abstract
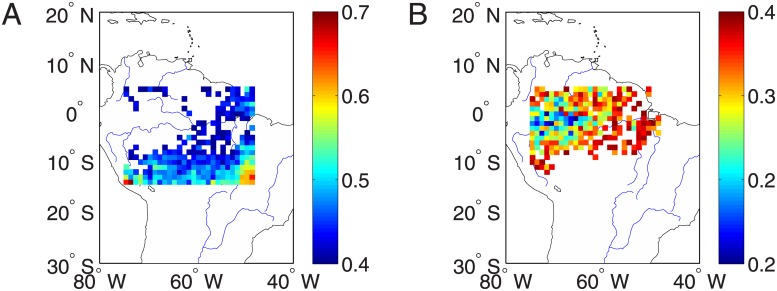
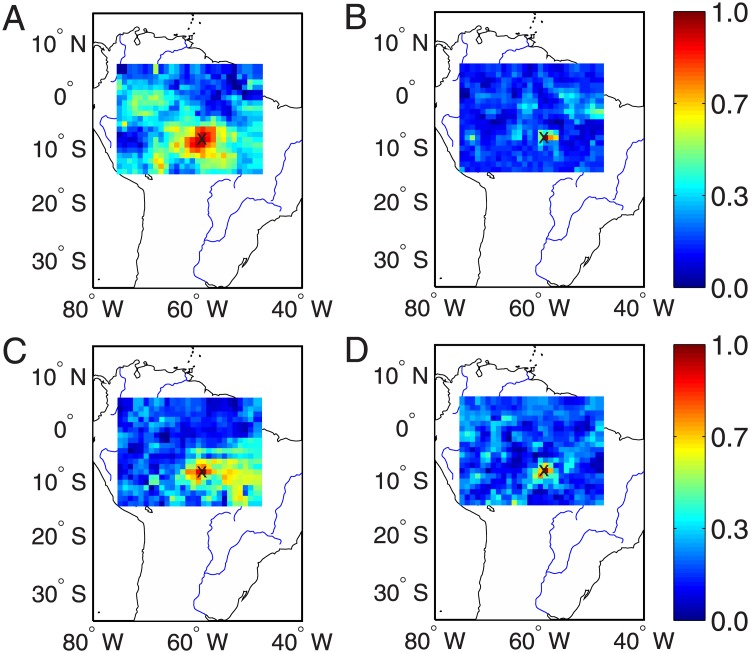
Climate networks are powerful approaches to disclose tele-connections in climate systems and to predict severe climate events. Here we construct regional climate networks from precipitation data in the Amazonian region and focus on network properties under the recent drought events in 2005 and 2010. Both the networks of the entire Amazon region and the extreme networks resulted from locations severely affected by drought events suggest that network characteristics show slight difference between the two drought events. Based on network degrees of extreme drought events and that without drought conditions, we identify regions of interest that are correlated to longer expected drought period length. Moreover, we show that the spatial correlation length to the regions of interest decayed much faster in 2010 than in 2005, which is because of the dual roles played by both the Pacific and Atlantic oceans. The results suggest that hub nodes in the regional climate network of Amazonia have fewer long-range connections when more severe drought conditions appeared in 2010 than that in 2005.
Conflict of interest statement
Figures


Similar articles
-
Projections of future meteorological drought and wet periods in the Amazon.Proc Natl Acad Sci U S A. 2015 Oct 27;112(43):13172-7. doi: 10.1073/pnas.1421010112. Epub 2015 Oct 12. Proc Natl Acad Sci U S A. 2015. PMID: 26460046 Free PMC article.
-
Increasing risk of Amazonian drought due to decreasing aerosol pollution.Nature. 2008 May 8;453(7192):212-5. doi: 10.1038/nature06960. Nature. 2008. PMID: 18464740
-
Pacific and Atlantic Ocean influences on multidecadal drought frequency in the United States.Proc Natl Acad Sci U S A. 2004 Mar 23;101(12):4136-41. doi: 10.1073/pnas.0306738101. Epub 2004 Mar 11. Proc Natl Acad Sci U S A. 2004. PMID: 15016919 Free PMC article.
-
Not all droughts are created equal: translating meteorological drought into woody plant mortality.Tree Physiol. 2013 Jul;33(7):701-12. doi: 10.1093/treephys/tpt044. Epub 2013 Jul 22. Tree Physiol. 2013. PMID: 23880634 Review.
-
Spatial patterns and recent trends in the climate of tropical rainforest regions.Philos Trans R Soc Lond B Biol Sci. 2004 Mar 29;359(1443):311-29. doi: 10.1098/rstb.2003.1433. Philos Trans R Soc Lond B Biol Sci. 2004. PMID: 15212087 Free PMC article. Review.
References
-
- Tsonis AA, Roebber PJ. The architecture of the climate network. Physica A. 2004;333:497–504. 10.1016/j.physa.2003.10.045 - DOI
-
- Tsonis AA, Swanson KL, Roebber PJ. What Do Networks Have to Do with Climate? B Am Meteorol Soc. 2006;87:585–595.
MeSH terms
LinkOut - more resources
Full Text Sources
Other Literature Sources
