

Eicosapentaenoic acid attenuates obesity-related hepatocellular carcinogenesis
- PMID: 29040439
- PMCID: PMC5862334
- DOI: 10.1093/carcin/bgx112
Eicosapentaenoic acid attenuates obesity-related hepatocellular carcinogenesis
Abstract
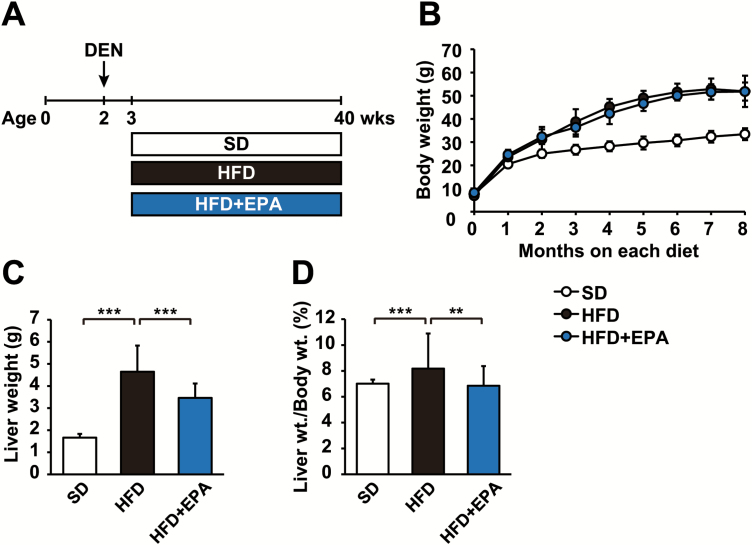
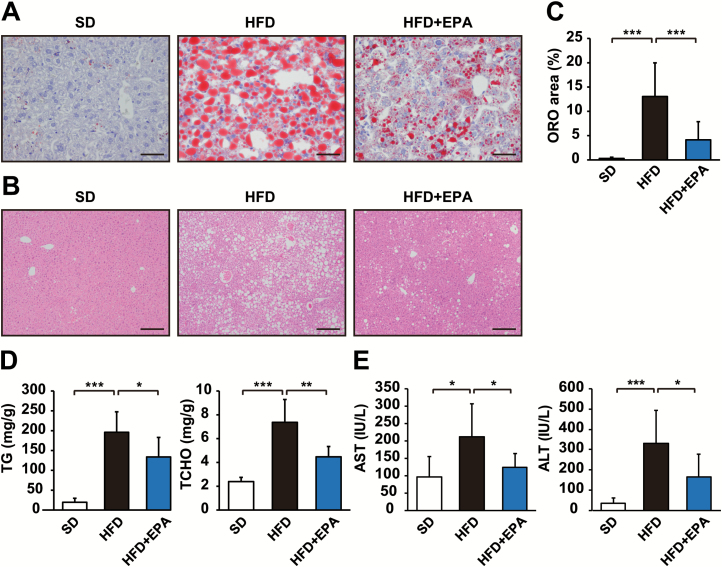
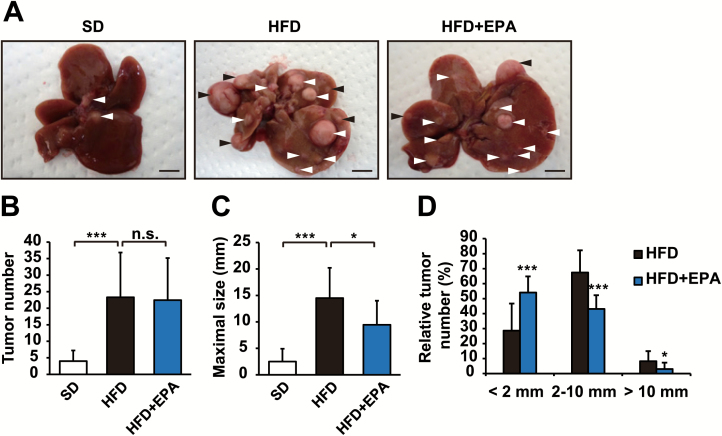
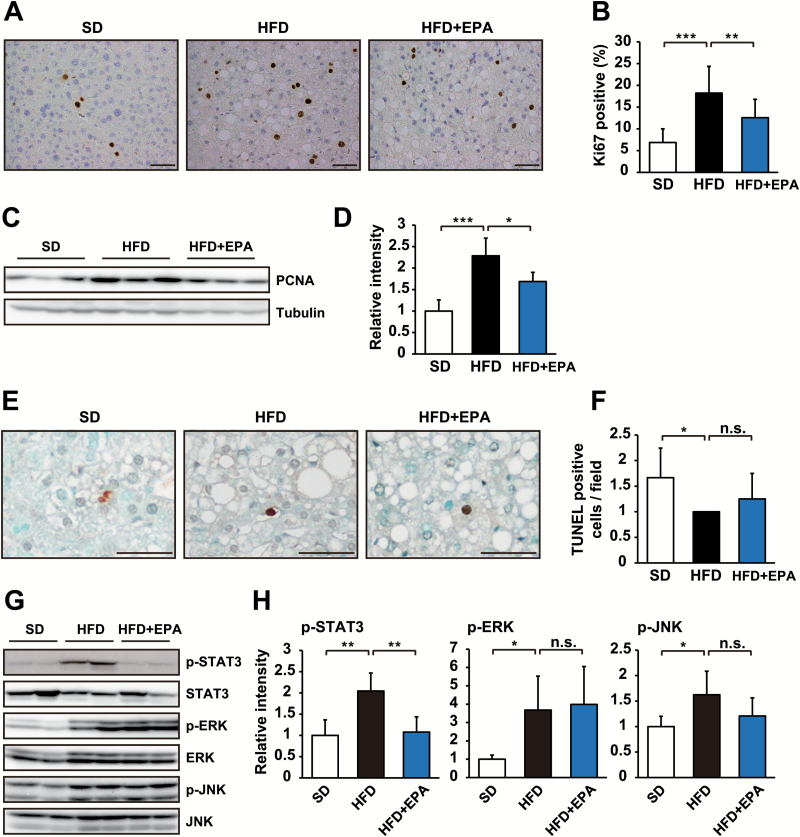
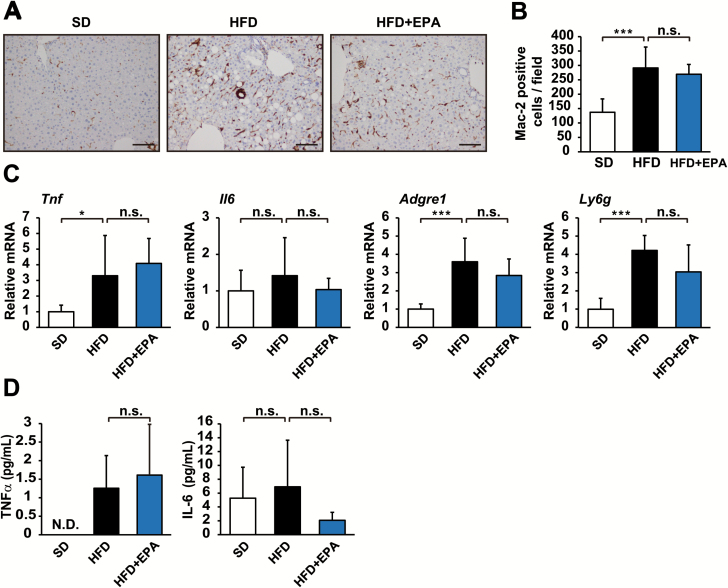
Non-alcoholic fatty liver disease (NAFLD), the hepatic manifestation of obesity, is an emerging risk factor for hepatocellular carcinoma (HCC). Accumulating evidence has shown that chronic inflammation represents a plausible link between obesity and HCC and that the pro-inflammatory cytokine interleukin (IL)-6 contributes to the development of obesity-related HCC. In the present study, we aimed to examine the therapeutic potential of the omega-3 polyunsaturated fatty acid, eicosapentaenoic acid (EPA), which exerts anti-inflammatory effects. The results showed that the development of carcinogen-induced HCC was significantly less in mice fed a high-fat diet (HFD) supplemented with EPA than in those fed HFD only, suggesting that EPA attenuates the development of obesity-related HCC. Although EPA did not appear to affect obesity-linked inflammation, it suppressed the activation of the pro-tumorigenic IL-6 effector STAT3, contributing to the inhibition of tumor growth. These findings suggest a clinical implication of EPA as a treatment for obesity-related HCC.
© The Author(s) 2017. Published by Oxford University Press.
Figures
Similar articles
-
Rosuvastatin as a potential preventive drug for the development of hepatocellular carcinoma associated with non-alcoholic fatty liver disease in mice.Int J Mol Med. 2016 Nov;38(5):1499-1506. doi: 10.3892/ijmm.2016.2766. Epub 2016 Oct 3. Int J Mol Med. 2016. PMID: 28025996
-
A Mouse Model of Hepatocellular Carcinoma Induced by Streptozotocin and High-Fat Diet.Methods Mol Biol. 2024;2769:67-75. doi: 10.1007/978-1-0716-3694-7_5. Methods Mol Biol. 2024. PMID: 38315389
-
Hepatocyte specific TIMP3 expression prevents diet dependent fatty liver disease and hepatocellular carcinoma.Sci Rep. 2017 Jul 27;7(1):6747. doi: 10.1038/s41598-017-06439-x. Sci Rep. 2017. PMID: 28751722 Free PMC article.
-
Hepatocellular carcinoma and non-alcoholic steatohepatitis: The state of play.World J Gastroenterol. 2016 Feb 28;22(8):2494-502. doi: 10.3748/wjg.v22.i8.2494. World J Gastroenterol. 2016. PMID: 26937137 Free PMC article. Review.
-
[Cellular senescence and chronic inflammation].Nihon Rinsho Meneki Gakkai Kaishi. 2014;37(5):390-7. doi: 10.2177/jsci.37.390. Nihon Rinsho Meneki Gakkai Kaishi. 2014. PMID: 25744638 Review. Japanese.
Cited by
-
High-fat diet-induced dysregulation of ovarian gene expression is restored with chronic omega-3 fatty acid supplementation.Mol Cell Endocrinol. 2020 Jan 1;499:110615. doi: 10.1016/j.mce.2019.110615. Epub 2019 Oct 16. Mol Cell Endocrinol. 2020. PMID: 31628964 Free PMC article.
-
Relationship Between Fish Oil Use and Incidence of Primary Liver Cancer: Findings From a Population-Based Prospective Cohort Study.Front Nutr. 2021 Dec 31;8:771984. doi: 10.3389/fnut.2021.771984. eCollection 2021. Front Nutr. 2021. PMID: 35036409 Free PMC article.
-
Assessment of the Effect of Sorafenib on Omega-6 and Omega-3 Epoxyeicosanoid Formation in Patients with Hepatocellular Carcinoma.Int J Mol Sci. 2020 Mar 9;21(5):1875. doi: 10.3390/ijms21051875. Int J Mol Sci. 2020. PMID: 32182938 Free PMC article.
-
A Novel Biomarker Panel for the Early Detection and Risk Assessment of Hepatocellular Carcinoma in Patients with Cirrhosis.Cancer Prev Res (Phila). 2021 Jun;14(6):667-674. doi: 10.1158/1940-6207.CAPR-20-0600. Epub 2021 Mar 8. Cancer Prev Res (Phila). 2021. PMID: 33685927 Free PMC article.
-
Carcinogenesis: Failure of resolution of inflammation?Pharmacol Ther. 2021 Feb;218:107670. doi: 10.1016/j.pharmthera.2020.107670. Epub 2020 Sep 3. Pharmacol Ther. 2021. PMID: 32891711 Free PMC article. Review.
References
-
- Calle E.E., et al. (2003)Overweight, obesity, and mortality from cancer in a prospectively studied cohort of U.S. adults. N. Engl. J. Med., 348, 1625–1638. - PubMed
-
- Calle E.E., et al. (2004)Overweight, obesity and cancer: epidemiological evidence and proposed mechanisms. Nat. Rev. Cancer, 4, 579–591. - PubMed
-
- El-Serag H.B., et al. (2007)Hepatocellular carcinoma: epidemiology and molecular carcinogenesis. Gastroenterology, 132, 2557–2576. - PubMed
-
- Caldwell S.H., et al. (2004)Obesity and hepatocellular carcinoma. Gastroenterology, 127 (5 suppl. 1), S97–S103. - PubMed
MeSH terms
Substances
LinkOut - more resources
Full Text Sources
Other Literature Sources
Medical
Molecular Biology Databases
Research Materials
Miscellaneous
