. 2017 Dec 1;9(12):3516-3524.
doi: 10.1093/gbe/evx216.

Variation and Functional Impact of Neanderthal Ancestry in Western Asia

Affiliations

Variation and Functional Impact of Neanderthal Ancestry in Western Asia

Recep Ozgur Taskent et al. Genome Biol Evol. .

Abstract

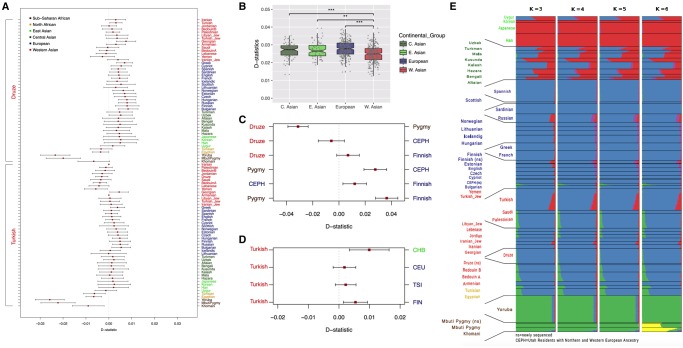
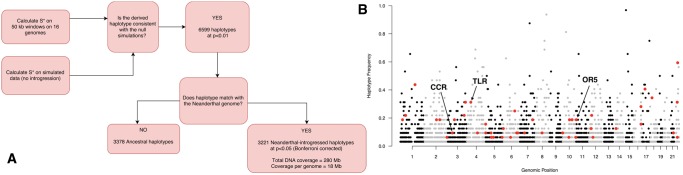
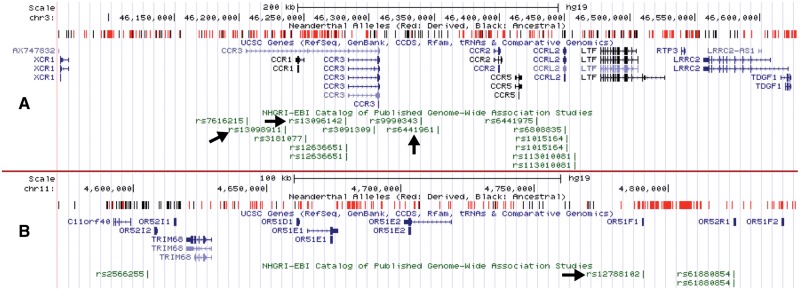
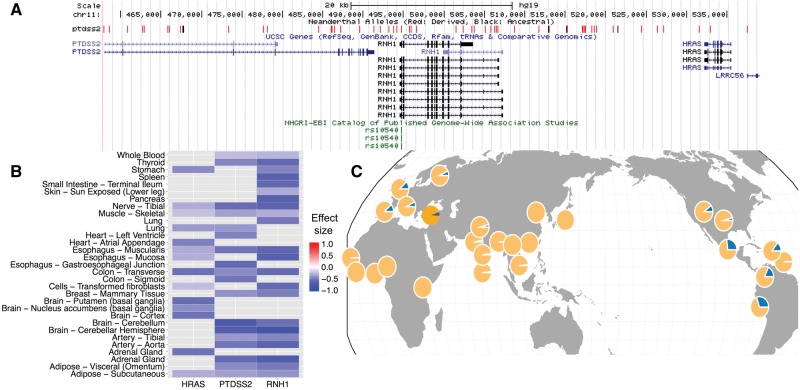
Neanderthals contributed genetic material to modern humans via multiple admixture events. Initial admixture events presumably occurred in Western Asia shortly after humans migrated out of Africa. Despite being a focal point of admixture, earlier studies indicate lower Neanderthal introgression rates in some Western Asian populations as compared with other Eurasian populations. To better understand the genome-wide and phenotypic impact of Neanderthal introgression in the region, we sequenced whole genomes of nine present-day Europeans, Africans, and the Western Asian Druze at high depth, and analyzed available whole genome data from various other populations, including 16 genomes from present-day Turkey. Our results confirmed previous observations that contemporary Western Asian populations, on an average, have lower levels of Neanderthal-introgressed DNA relative to other Eurasian populations. Modern Western Asians also show comparatively high variability in Neanderthal ancestry, which may be attributed to the complex demographic history of the region. We further replicated the previously described depletion of putatively functional sequences among Neanderthal-introgressed haplotypes. Still, we find dozens of common Neanderthal-introgressed haplotypes in the Turkish sample associated with human phenotypes, including anthropometric and metabolic traits, as well as the immune response. One of these haplotypes is unusually long and harbors variants that affect the expression of members of the CCR gene family and are associated with celiac disease. Overall, our results paint a complex first picture of the genomic impact of Neanderthal introgression in the Western Asian populations.

Keywords: Anatolia; celiac disease; genetic anthropology; immunity; malaria; metabolism.


Figures

Fig. 1.
Fig. 1.
—Neanderthal ancestry proportions and population structure in Eurasian human populations. The results were color coded according to the geographic regions of origin for all the panels: Africa: Dark Brown; North Africa: Light Brown; East Asia: Light Green; Central Asia: Dark Green; Europe: Dark Blue; Western Asia: Red. (A) Distribution of D-statistics for the Human Origins (HO) data set calculated in the form D(Test, Druze; Neanderthal, Chimpanzee), and D(Test, Turkish; Neanderthal, Chimpanzee). Results show the Neanderthal ancestry proportions in the Druze and Turkish populations relative to various Test populations included in the Human Origins (HO) data set (Lazaridis et al. 2014). Approximately 30,000 single nucleotide polymorphisms that are derived in the Neanderthal genome were used in each comparison (supplementary table S1, Supplementary Material online). Results for other comparisons can be found in supplementary table S1, Supplementary Material online. (B) Comparison of the differences in D-statistics between continental groups. The data in each boxplot are D-statistics calculated for each sample in that continental group available from the HO data set. The D-statistics were calculated in the form D(Test, Yoruba; Neanderthal, Chimpanzee). (C) D-statistics calculated for the Turkish samples sequenced in Turkish Genome Project as compared with Eurasian populations sequenced in 1,000 Genomes Project. Distribution of D-statistics calculated in the form D(Test, TGP; Neanderthal, Chimpanzee). Approximately 100,000 polymorphic transversions that are derived in the Neanderthal genome were used in each of these comparisons (supplementary table S1, Supplementary Material online). Error bars show two standard deviations around the mean (Z = 2). (D) The D-statistic comparisons between the samples sequenced in this study. The sequenced samples are from individuals of Druze (n = 3), Pigmy (n = 3), Fin (n = 2), and Central European (n = 2) ancestry (n = 10). D-statistics were calculated in the form D(Test1, Test2; Neanderthal, Chimpanzee). Approximately 140,000 polymorphic transversions that are derived in Neanderthal genome were used in each of these comparisons (supplementary table S1, Supplementary Material online). Error bars show two standard deviations around the mean (Z = 2). (E) ADMIXTURE analysis results calculated using the Human Origins data set (Lazaridis et al. 2014). Each row shows ancestry components estimated using different (k = 3, 4, 5, 6) number of clusters. Ancestry proportions were calculated for 746 individuals included in the 43 populations in the Human Origins data set.
Fig. 2.
Fig. 2.
—S* statistics workflow and haplotypes. (A) S* analysis workflow. The boxes show each major computational step to determine Neanderthal-introgressed haplotypes. The number of haplotypes that we found in our pipeline at each step was indicated within the respective boxes. (B) Distribution of Neanderthal-introgressed haplotypes detected by S* over the Turkish genomes (n = 16) sequenced for the Turkish Genome Project (TGP) (Alkan et al. 2014). The x-axis shows the chromosomal locations of the haplotypes. Y-axis indicates the allele frequency observed in the Turkish sample (n = 16 individuals). Haplotypes labeled by red show haplotypes carrying GWAS variants where the Neanderthal carries the derived allele. Arrows show the haplotypes carrying C-C motif chemokine receptor (CCR) family, toll-like receptor (TLR-1, TLR-6, TLR-10), and olfactory receptor-5 (OR5) family genes.
Fig. 3.
Fig. 3.
—Neanderthal-introgressed haplotypes with putative functional effects. The graphs show genome-browser snapshots of genomic regions where we detected Neanderthal-introgressed haplotypes harboring GWAS variants. The upper ruler indicates a scale for the region. The “Neanderthal Alleles” track denotes the variants used in our S* pipeline and the colors indicate whether the variants are derived (red) in the Neanderthal genome or not (black). The “UCSC Genes” track shows the location of exons (thick blue sticks) and introns (thin blue sticks). (A) Neanderthal-introgressed haplotype carrying GWAS variants associated with celiac disease. The haplotype carries multiple C-C motif chemokine receptor (CCR) genes. The track on the bottom shows the GWAS variants in the region. The arrows show the GWAS variants, which are linked with celiac disease and linked with the Neanderthal haplotype. (B) Neanderthal-introgressed haplotype carrying multiple olfactory receptor 5 (OR5) genes. The haplotype also carries a GWAS variant (rs12788102) associated with the severity of malaria infections (Band et al. 2013). The arrow shows the GWAS variant associated with the severity of malaria infections.
Fig. 4.
Fig. 4.
—A Neanderthal-introgressed haplotype with putative metabolism-related effects. (A) A Neanderthal-introgressed haplotype carrying an obesity-associated GWAS variant. The graphs show genome-browser snapshots of genomic regions where we detected Neanderthal-introgressed haplotypes harboring a GWAS variant. The upper ruler indicates a scale for the region. The “Neanderthal Alleles” track denotes the variants used in our S* pipeline and the colors indicate whether the variants are derived (red) in Neanderthal genome or not (black). The “UCSC Genes” track shows the location of exons (thick blue sticks) and introns (thin blue sticks). The GWAS variant is shown in green. (B) Genotype tissue expression profile of the GWAS variant rs10540. The range for this heatmap is from red (positive impact on expression) to blue (negative effect on expression). Note that the impact of this haplotype is negative on all three genes. (C) The frequency distribution of the Neanderthal-introgressed haplotype among world populations. The blue section of the pie shows the allele frequency of the introgressed haplotype and the yellow shows all other haplotypes.

References

    1. 1000 Genomes Project Consortium. 2012. An integrated map of genetic variation from 1,092 human genomes. Nature 491:56–65. - PMC - PubMed
    1. Alexander DH, Novembre J, Lange K.. 2009. Fast model-based estimation of ancestry in unrelated individuals. Genome Res. 199:1655–1664. - PMC - PubMed
    1. Alkan C, et al. 2014. Whole genome sequencing of Turkish genomes reveals functional private alleles and impact of genetic interactions with Europe, Asia and Africa. BMC Genomics 15:963.. - PMC - PubMed
    1. Aoki Y, et al. 2005. Germline mutations in HRAS proto-oncogene cause Costello syndrome. Nat Genet. 3710:1038–1040. - PubMed
    1. Band G, et al. 2013. Imputation-based meta-analysis of severe malaria in three African populations. PLoS Genet. 95:e1003509. - PMC - PubMed

Publication types

LinkOut - more resources