

Collider scope: when selection bias can substantially influence observed associations
- PMID: 29040562
- PMCID: PMC5837306
- DOI: 10.1093/ije/dyx206
Collider scope: when selection bias can substantially influence observed associations
Abstract
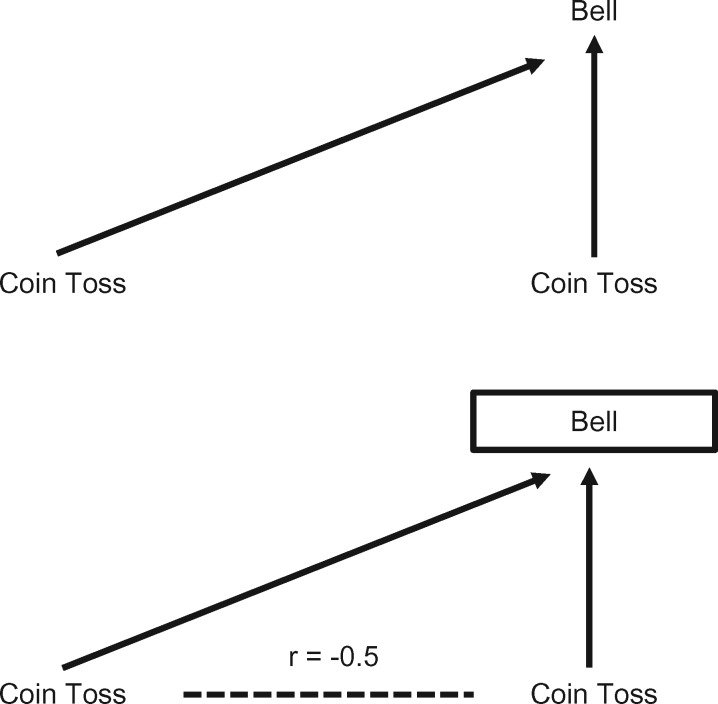
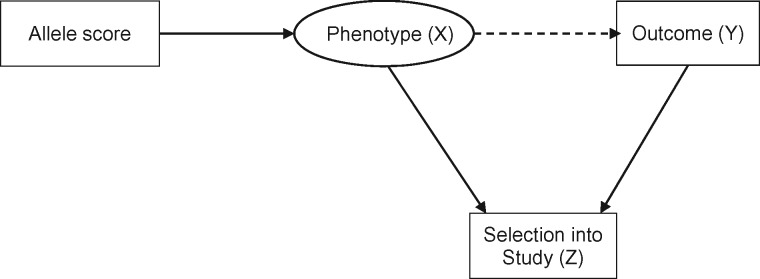
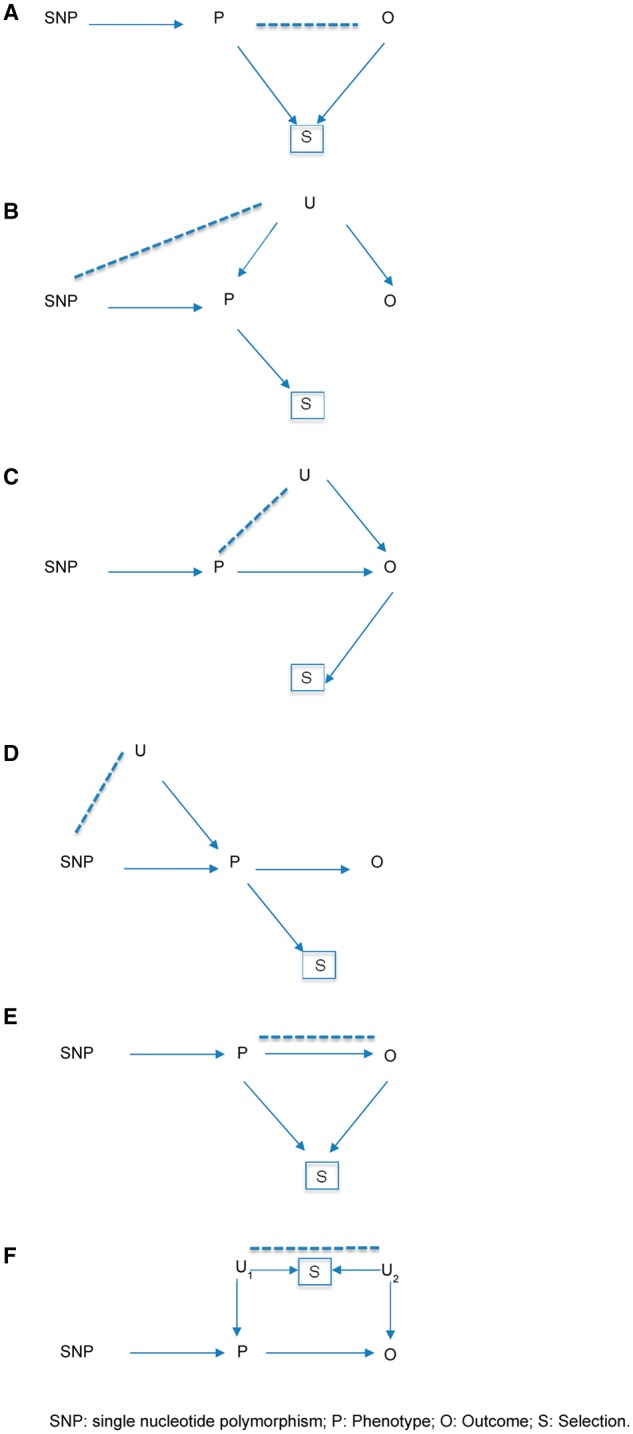
Large-scale cross-sectional and cohort studies have transformed our understanding of the genetic and environmental determinants of health outcomes. However, the representativeness of these samples may be limited-either through selection into studies, or by attrition from studies over time. Here we explore the potential impact of this selection bias on results obtained from these studies, from the perspective that this amounts to conditioning on a collider (i.e. a form of collider bias). Whereas it is acknowledged that selection bias will have a strong effect on representativeness and prevalence estimates, it is often assumed that it should not have a strong impact on estimates of associations. We argue that because selection can induce collider bias (which occurs when two variables independently influence a third variable, and that third variable is conditioned upon), selection can lead to substantially biased estimates of associations. In particular, selection related to phenotypes can bias associations with genetic variants associated with those phenotypes. In simulations, we show that even modest influences on selection into, or attrition from, a study can generate biased and potentially misleading estimates of both phenotypic and genotypic associations. Our results highlight the value of knowing which population your study sample is representative of. If the factors influencing selection and attrition are known, they can be adjusted for. For example, having DNA available on most participants in a birth cohort study offers the possibility of investigating the extent to which polygenic scores predict subsequent participation, which in turn would enable sensitivity analyses of the extent to which bias might distort estimates.
Figures
Similar articles
-
Folic acid supplementation and malaria susceptibility and severity among people taking antifolate antimalarial drugs in endemic areas.Cochrane Database Syst Rev. 2022 Feb 1;2(2022):CD014217. doi: 10.1002/14651858.CD014217. Cochrane Database Syst Rev. 2022. PMID: 36321557 Free PMC article.
-
Baseline selection on a collider: a ubiquitous mechanism occurring in both representative and selected cohort studies.J Epidemiol Community Health. 2019 May;73(5):475-480. doi: 10.1136/jech-2018-211829. Epub 2019 Feb 25. J Epidemiol Community Health. 2019. PMID: 30804046
-
Biased Exposure-Health Effect Estimates from Selection in Cohort Studies: Are Environmental Studies at Particular Risk?Environ Health Perspect. 2015 Nov;123(11):1113-22. doi: 10.1289/ehp.1408888. Epub 2015 May 8. Environ Health Perspect. 2015. PMID: 25956004 Free PMC article.
-
Implications of M bias in epidemiologic studies: a simulation study.Am J Epidemiol. 2012 Nov 15;176(10):938-48. doi: 10.1093/aje/kws165. Epub 2012 Oct 25. Am J Epidemiol. 2012. PMID: 23100247
-
Avoiding selection bias in metabolomics studies: a tutorial.Metabolomics. 2019 Jan 3;15(1):7. doi: 10.1007/s11306-018-1463-4. Metabolomics. 2019. PMID: 30830435 Review.
Cited by
-
Activin type I receptor polymorphisms and body composition in older individuals with sarcopenia-Analyses from the LACE randomised controlled trial.PLoS One. 2023 Nov 14;18(11):e0294330. doi: 10.1371/journal.pone.0294330. eCollection 2023. PLoS One. 2023. PMID: 37963137 Free PMC article. Clinical Trial.
-
Recontacting biobank participants to collect lifestyle, behavioural and cognitive information via online questionnaires: lessons from a pilot study within FinnGen.BMJ Open. 2022 Oct 5;12(10):e064695. doi: 10.1136/bmjopen-2022-064695. BMJ Open. 2022. PMID: 36198465 Free PMC article.
-
Evaluating the causal relationship between educational attainment and mental health.medRxiv [Preprint]. 2024 Apr 11:2023.01.26.23285029. doi: 10.1101/2023.01.26.23285029. medRxiv. 2024. PMID: 36747639 Free PMC article. Preprint.
-
Comparisons of early and delayed abstainers and its effects on long-term smoking cessation in Taiwan.Subst Abuse Treat Prev Policy. 2019 Aug 14;14(1):31. doi: 10.1186/s13011-019-0218-1. Subst Abuse Treat Prev Policy. 2019. PMID: 31412892 Free PMC article.
-
Mendelian Randomization in Case Only Studies: A Promising Approach to be Applied With Caution.Am J Cardiol. 2018 Dec 15;122(12):2169-2171. doi: 10.1016/j.amjcard.2018.09.035. Epub 2018 Sep 28. Am J Cardiol. 2018. PMID: 30396509 Free PMC article. No abstract available.
References
-
- Lee JJ. Correlation and causation in the study of personality. Eur J Pers 2012;26:372–90.
-
- Elwood JM. Commentary: On representativeness. Int J Epidemiol 2013;42:1014–15. - PubMed
Publication types
MeSH terms
Grants and funding
- BHF_/British Heart Foundation/United Kingdom
- MC_UU_00011/7/MRC_/Medical Research Council/United Kingdom
- MC_UU_12013/8/MRC_/Medical Research Council/United Kingdom
- MC_UU_12013/1/MRC_/Medical Research Council/United Kingdom
- MC_UU_12013/4/MRC_/Medical Research Council/United Kingdom
- MC_UU_12013/9/MRC_/Medical Research Council/United Kingdom
- WT_/Wellcome Trust/United Kingdom
- BB/I025263/1/BB_/Biotechnology and Biological Sciences Research Council/United Kingdom
- 102215/2/13/2/WT_/Wellcome Trust/United Kingdom
- CRUK_/Cancer Research UK/United Kingdom
- MC_QA137853/MRC_/Medical Research Council/United Kingdom
- MC_UU_12013/6/MRC_/Medical Research Council/United Kingdom
- BBI025751/1/BB_/Biotechnology and Biological Sciences Research Council/United Kingdom
- MC_PC_15018/MRC_/Medical Research Council/United Kingdom
- G9815508/MRC_/Medical Research Council/United Kingdom
- MC_UU_12013/2/MRC_/Medical Research Council/United Kingdom
LinkOut - more resources
Full Text Sources
Other Literature Sources
Molecular Biology Databases
