Signal, Uncertainty, and Conflict in Phylogenomic Data for a Diverse Lineage of Microbial Eukaryotes (Diatoms, Bacillariophyta)
- PMID: 29040712
- PMCID: PMC5850769
- DOI: 10.1093/molbev/msx268
Signal, Uncertainty, and Conflict in Phylogenomic Data for a Diverse Lineage of Microbial Eukaryotes (Diatoms, Bacillariophyta)
Abstract
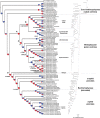
Diatoms (Bacillariophyta) are a species-rich group of eukaryotic microbes diverse in morphology, ecology, and metabolism. Previous reconstructions of the diatom phylogeny based on one or a few genes have resulted in inconsistent resolution or low support for critical nodes. We applied phylogenetic paralog pruning techniques to a data set of 94 diatom genomes and transcriptomes to infer perennially difficult species relationships, using concatenation and summary-coalescent methods to reconstruct species trees from data sets spanning a wide range of thresholds for taxon and column occupancy in gene alignments. Conflicts between gene and species trees decreased with both increasing taxon occupancy and bootstrap cutoffs applied to gene trees. Concordance between gene and species trees was lowest for short internodes and increased logarithmically with increasing edge length, suggesting that incomplete lineage sorting disproportionately affects species tree inference at short internodes, which are a common feature of the diatom phylogeny. Although species tree topologies were largely consistent across many data treatments, concatenation methods appeared to outperform summary-coalescent methods for sparse alignments. Our results underscore that approaches to species-tree inference based on few loci are likely to be misled by unrepresentative sampling of gene histories, particularly in lineages that may have diversified rapidly. In addition, phylogenomic studies of diatoms, and potentially other hyperdiverse groups, should maximize the number of gene trees with high taxon occupancy, though there is clearly a limit to how many of these genes will be available.
Keywords: Bacillariophyta; diatoms; incomplete lineage sorting; phylogenomics; phylotranscriptomics.
© The Author 2017. Published by Oxford University Press on behalf of the Society for Molecular Biology and Evolution.
Figures


Similar articles
-
Phylogenomics reveals an extensive history of genome duplication in diatoms (Bacillariophyta).Am J Bot. 2018 Mar;105(3):330-347. doi: 10.1002/ajb2.1056. Epub 2018 Apr 17. Am J Bot. 2018. PMID: 29665021
-
To Include or Not to Include: The Impact of Gene Filtering on Species Tree Estimation Methods.Syst Biol. 2018 Mar 1;67(2):285-303. doi: 10.1093/sysbio/syx077. Syst Biol. 2018. PMID: 29029338
-
Coalescent-Based Analyses of Genomic Sequence Data Provide a Robust Resolution of Phylogenetic Relationships among Major Groups of Gibbons.Mol Biol Evol. 2018 Jan 1;35(1):159-179. doi: 10.1093/molbev/msx277. Mol Biol Evol. 2018. PMID: 29087487 Free PMC article.
-
Estimating phylogenetic trees from genome-scale data.Ann N Y Acad Sci. 2015 Dec;1360:36-53. doi: 10.1111/nyas.12747. Epub 2015 Apr 14. Ann N Y Acad Sci. 2015. PMID: 25873435 Review.
-
Comments on recent progress toward reconstructing the diatom phylogeny.J Nanosci Nanotechnol. 2005 Jan;5(1):57-62. doi: 10.1166/jnn.2005.007. J Nanosci Nanotechnol. 2005. PMID: 15762161 Review.
Cited by
-
GET_PHYLOMARKERS, a Software Package to Select Optimal Orthologous Clusters for Phylogenomics and Inferring Pan-Genome Phylogenies, Used for a Critical Geno-Taxonomic Revision of the Genus Stenotrophomonas.Front Microbiol. 2018 May 1;9:771. doi: 10.3389/fmicb.2018.00771. eCollection 2018. Front Microbiol. 2018. PMID: 29765358 Free PMC article.
-
Big evolutionary fireworks in tiny glass houses.Proc Natl Acad Sci U S A. 2025 Jul;122(26):e2511509122. doi: 10.1073/pnas.2511509122. Epub 2025 Jun 23. Proc Natl Acad Sci U S A. 2025. PMID: 40549924 No abstract available.
-
Large Phylogenomic Data sets Reveal Deep Relationships and Trait Evolution in Chlorophyte Green Algae.Genome Biol Evol. 2021 Jul 6;13(7):evab101. doi: 10.1093/gbe/evab101. Genome Biol Evol. 2021. PMID: 33950183 Free PMC article.
-
Spatial fragmentation in the distribution of diatom endosymbionts from the taxonomically clarified dinophyte Kryptoperidinium triquetrum (= Kryptoperidinium foliaceum, Peridiniales).Sci Rep. 2023 May 26;13(1):8593. doi: 10.1038/s41598-023-32949-y. Sci Rep. 2023. PMID: 37237053 Free PMC article.
-
Teasing apart the sources of phylogenetic tree discordance across three genomes in the oak family (Fagaceae).BMC Plant Biol. 2025 Jul 17;25(1):919. doi: 10.1186/s12870-025-06963-3. BMC Plant Biol. 2025. PMID: 40676558 Free PMC article.
References
-
- Andrade SCS, Montenegro H, Strand M, Schwartz ML, Kajihara H, Norenburg JL, Turbeville JM, Sundberg P, Giribet G.. 2014. A transcriptomic approach to ribbon worm systematics (Nemertea): resolving the Pilidiophora problem. Mol Biol Evol. 31(12):3206–3215. - PubMed
-
- Armbrust EV, Berges JA, Bowler C, Green BR, Martinez D, Putnam NH, Zhou S, Allen AE, Apt KE, Bechner M, et al.2004. The genome of the diatom Thalassiosira pseudonana: ecology, evolution, and metabolism. Science 306(5693):79–86. - PubMed
-
- Ashworth MP, Ruck EC, Lobban CS, Romanovicz DK, Theriot EC.. 2012. A revision of the genus Cyclophora and description of Astrosyne gen. nov. (Bacillariophyta), two genera with the pyrenoids contained within pseudosepta. Phycologia 51(6):684–699.
-
- Blom MPK, Bragg JG, Potter S, Moritz C.. 2017. Accounting for uncertainty in gene tree estimation: summary-coalescent species tree inference in a challenging radiation of Australian lizards. Syst Biol. 66:352–366. - PubMed
Publication types
MeSH terms
LinkOut - more resources
Full Text Sources
Other Literature Sources

