

Intensity inhomogeneity correction of SD-OCT data using macular flatspace
- PMID: 29040910
- PMCID: PMC6311386
- DOI: 10.1016/j.media.2017.09.008
Intensity inhomogeneity correction of SD-OCT data using macular flatspace
Abstract
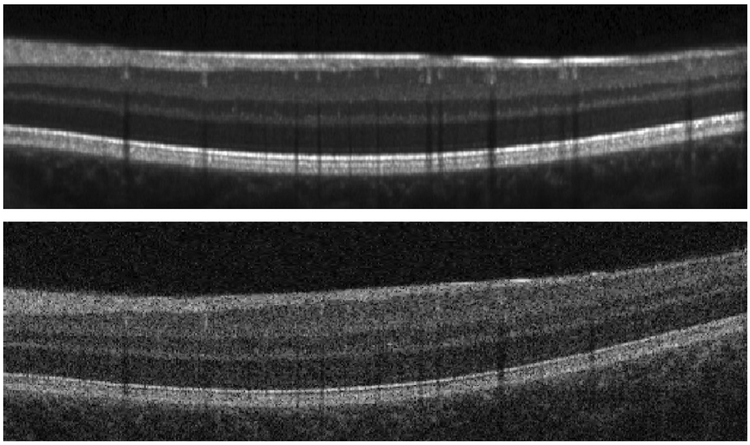
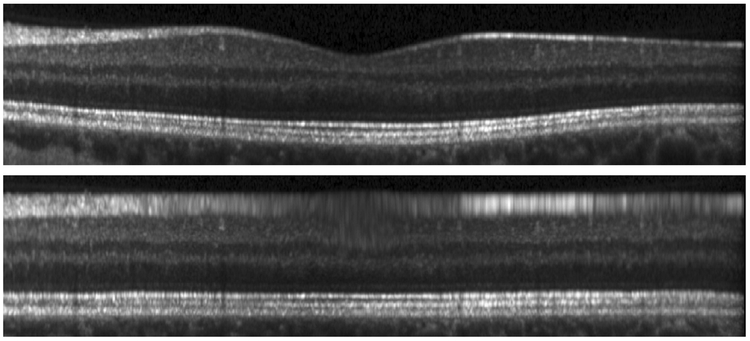
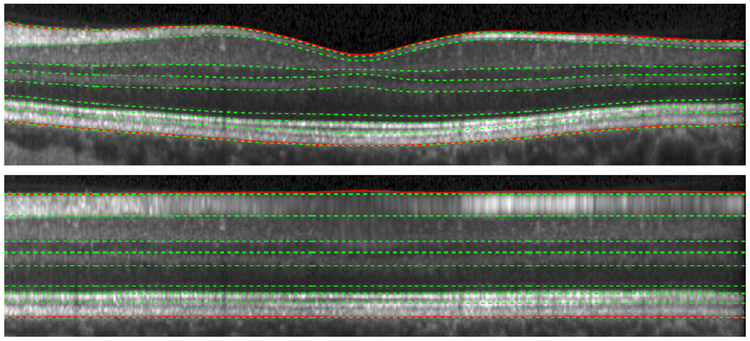
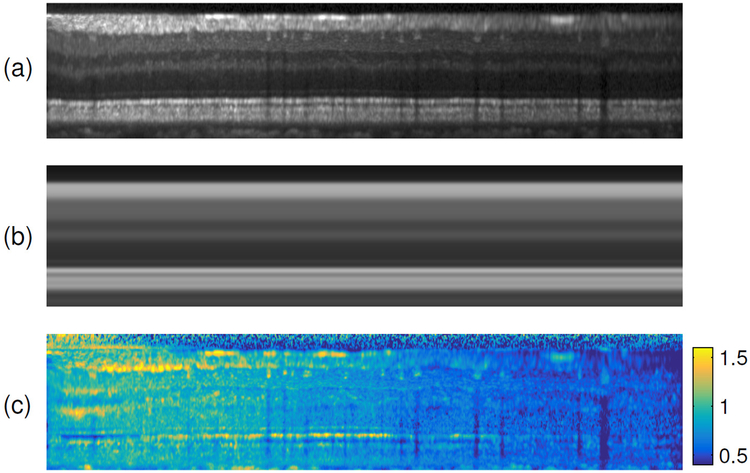
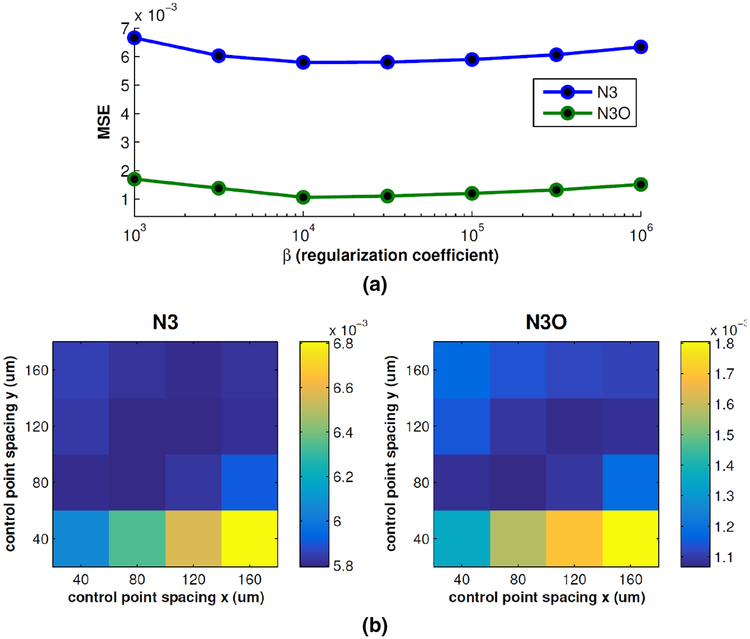
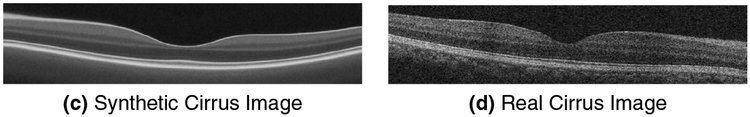
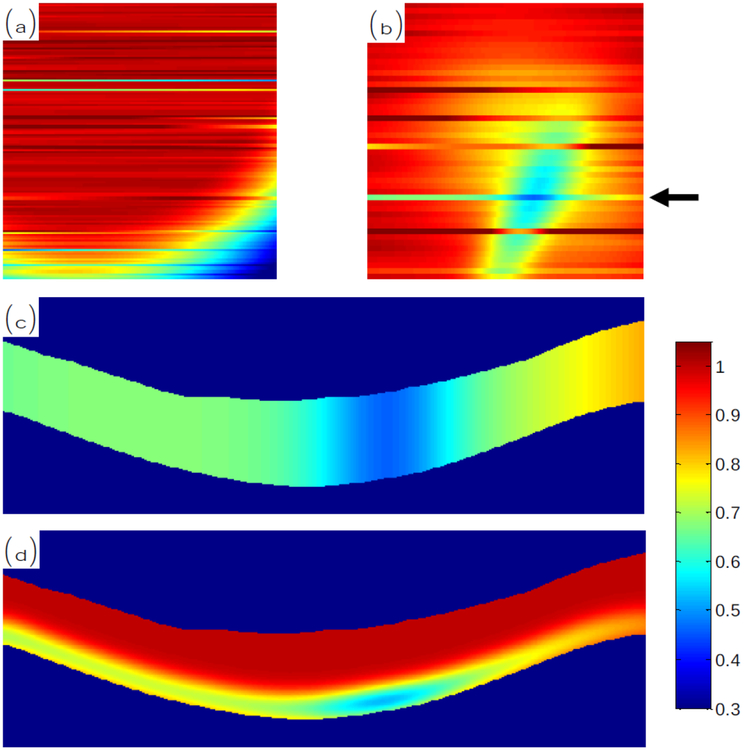
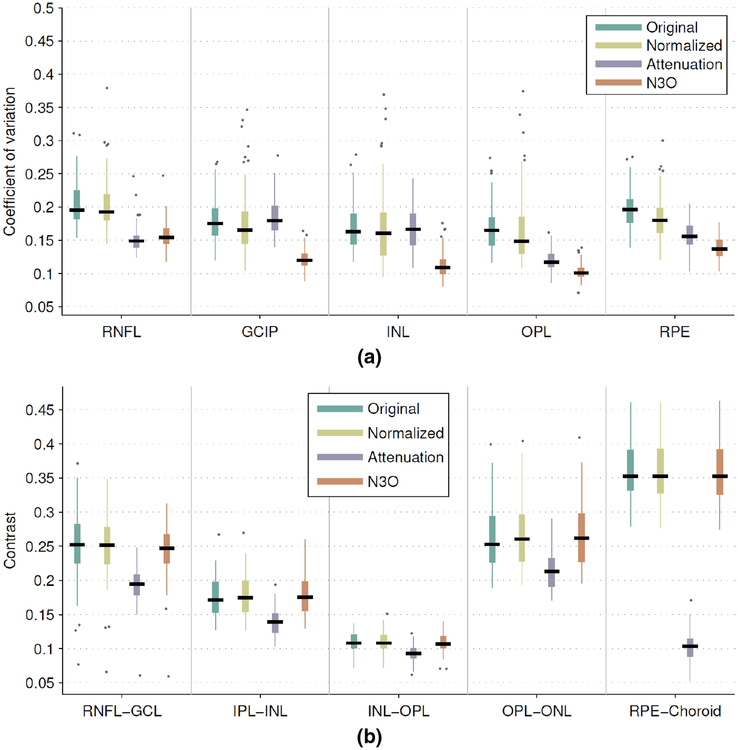
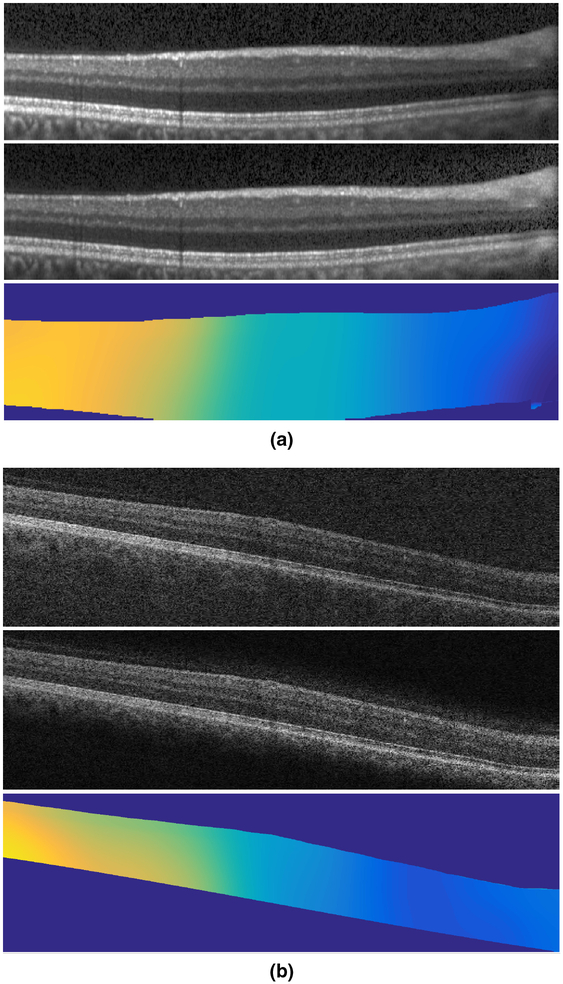
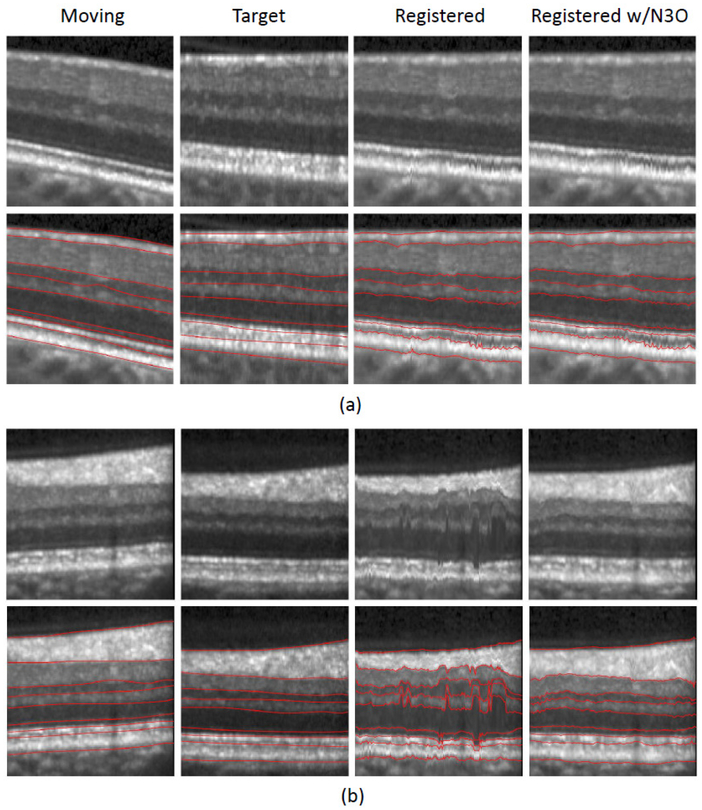
Images of the retina acquired using optical coherence tomography (OCT) often suffer from intensity inhomogeneity problems that degrade both the quality of the images and the performance of automated algorithms utilized to measure structural changes. This intensity variation has many causes, including off-axis acquisition, signal attenuation, multi-frame averaging, and vignetting, making it difficult to correct the data in a fundamental way. This paper presents a method for inhomogeneity correction by acting to reduce the variability of intensities within each layer. In particular, the N3 algorithm, which is popular in neuroimage analysis, is adapted to work for OCT data. N3 works by sharpening the intensity histogram, which reduces the variation of intensities within different classes. To apply it here, the data are first converted to a standardized space called macular flat space (MFS). MFS allows the intensities within each layer to be more easily normalized by removing the natural curvature of the retina. N3 is then run on the MFS data using a modified smoothing model, which improves the efficiency of the original algorithm. We show that our method more accurately corrects gain fields on synthetic OCT data when compared to running N3 on non-flattened data. It also reduces the overall variability of the intensities within each layer, without sacrificing contrast between layers, and improves the performance of registration between OCT images.
Keywords: Intensity inhomogeneity correction; Macular flatspace; Optical coherence tomography; Registration; Retina.
Copyright © 2017 Elsevier B.V. All rights reserved.
Figures
References
-
- Antony BJ, Lang A, Swingle EK, Al-Louzi O, Carass A, Solomon SD, Calabresi PA, Saidha S, Prince JL, 2016b. Simultaneous Segmentation of Retinal Surfaces and Microcystic Macular Edema in SDOCT Volumes. Proceedings of SPIE Medical Imaging (SPIE-MI 2016), San Diego, CA, February 27-March 3, 2016 9784, 97841C. - PMC - PubMed
-
- Arevalo JF (Ed.), 2009. Retinal Angiography and Optical Coherence Tomography. Springer-Verlag; New York.
-
- Arnold JB, Liow J-S, Schaper KA, Stern JJ, Sled JG, Shattuck DW, Worth AJ, Cohen MS, Leahy RM, Mazziotta JC, Rottenberg DA, 2001. Qualitative and quantitative evaluation of six algorithms for correcting intensity nonuniformity effects. NeuroImage 13 (5), 931–943. - PubMed
-
- Cabezas M, Oliver A, Lladó X, Freixenet J, Cuadra MB, 2011. A review of atlas-based segmentation for magnetic resonance brain images. Comput. Methods Programs Biomed 104 (3), e158–e177. - PubMed
MeSH terms
Grants and funding
LinkOut - more resources
Full Text Sources
Other Literature Sources
