

An analysis of 67 RNA-seq datasets from various tissues at different stages of a model insect, Manduca sexta
- PMID: 29041902
- PMCID: PMC5645894
- DOI: 10.1186/s12864-017-4147-y
An analysis of 67 RNA-seq datasets from various tissues at different stages of a model insect, Manduca sexta
Abstract
Background: Manduca sexta is a large lepidopteran insect widely used as a model to study biochemistry of insect physiological processes. As a part of its genome project, over 50 cDNA libraries have been analyzed to profile gene expression in different tissues and life stages. While the RNA-seq data were used to study genes related to cuticle structure, chitin metabolism and immunity, a vast amount of the information has not yet been mined for understanding the basic molecular biology of this model insect. In fact, the basic features of these data, such as composition of the RNA-seq reads and lists of library-correlated genes, are unclear. From an extended view of all insects, clear-cut tempospatial expression data are rarely seen in the largest group of animals including Drosophila and mosquitoes, mainly due to their small sizes.
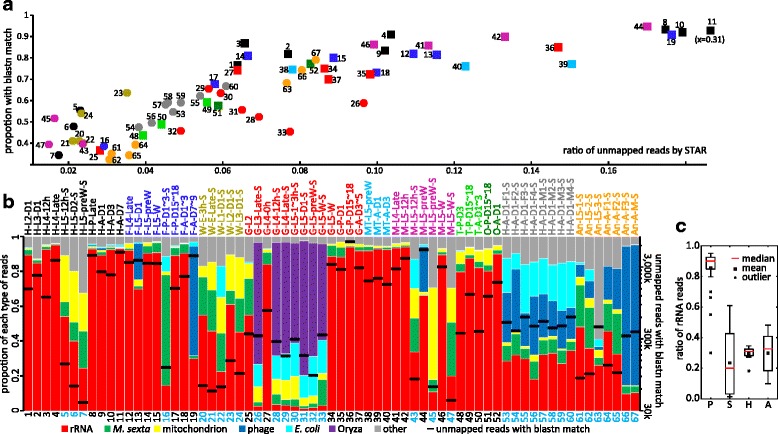
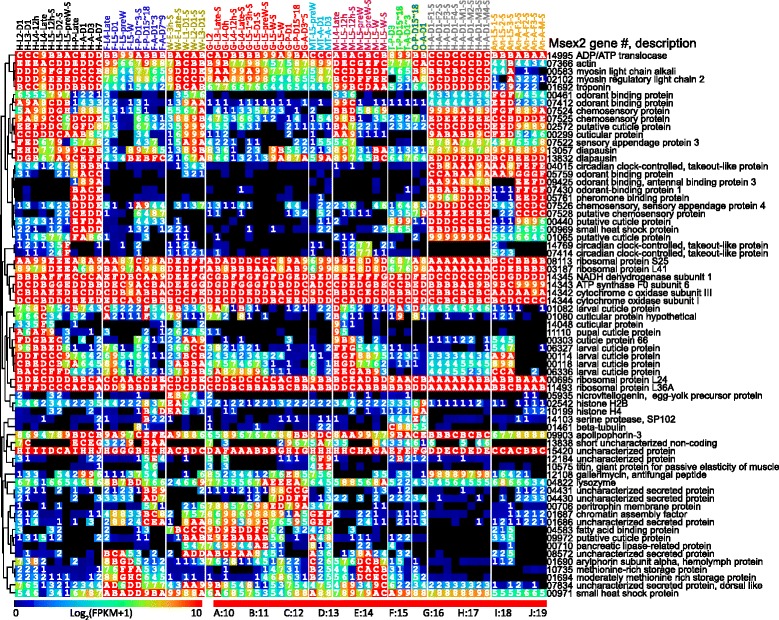
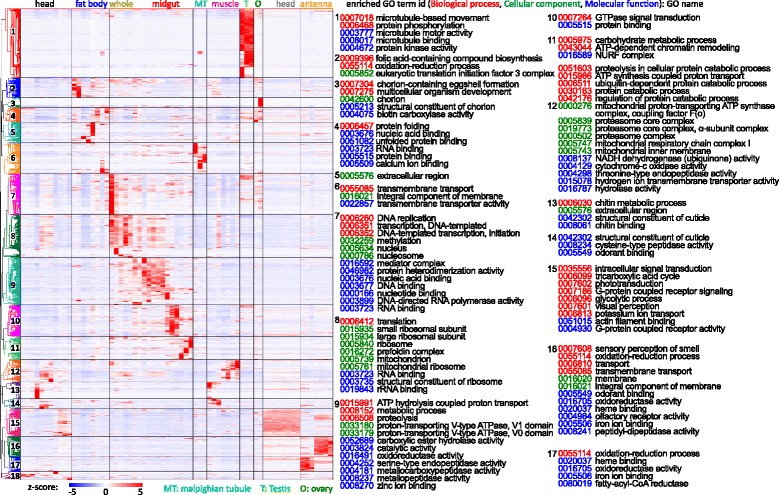
Results: We obtained the transcriptome data, analyzed the raw reads in relation to the assembled genome, and generated heatmaps for clustered genes. Library characteristics (tissues, stages), number of mapped bases, and sequencing methods affected the observed percentages of genome transcription. While up to 40% of the reads were not mapped to the genome in the initial Cufflinks gene modeling, we identified the causes for the mapping failure and reduced the number of non-mappable reads to <8%. Similarities between libraries, measured based on library-correlated genes, clearly identified differences among tissues or life stages. We calculated gene expression levels, analyzed the most abundantly expressed genes in the libraries. Furthermore, we analyzed tissue-specific gene expression and identified 18 groups of genes with distinct expression patterns.
Conclusion: We performed a thorough analysis of the 67 RNA-seq datasets to characterize new genomic features of M. sexta. Integrated knowledge of gene functions and expression features will facilitate future functional studies in this biochemical model insect.
Keywords: Insect genome; Tobacco hornworm; Transcriptome.
Conflict of interest statement
Ethics approval and consent to participate
Not applicable.
Consent for publication
Not applicable.
Competing interests
The authors declare that they have no competing interests.
Publisher’s Note
Springer Nature remains neutral with regard to jurisdictional claims in published maps and institutional affiliations.
Figures

 ), fat body (
 ), whole body (
 ), midgut (
 ), Malpighian tubule (
 ), muscle (
 ), testis (
 ), ovary (
 ), and antenna (
 ). The second part indicates major stages of the insect, i.e. embryo (E), 1st to 5th instar larvae (L1 − L5), pupae (P), and adults (A). In the third part, “D” stands for day, “h” for hour, “preW” for pre-wandering, “W” for wandering, “M” for male, and “F” for female. “S” in the last part of library names indicates single-end sequencing; no “S” in the end indicates paired-end sequencing. The cDNA libraries represent the following tissues and stages: head (H) [1. 2nd (instar) L (larvae), D1 (day 1); 2. 3rd L, D1; 3. 4th L, 12 h (hour); 4. 4th L, late; 5. 5th L, D0.5; 6. 5th L, D2; 7. 5th L, preW (pre-wandering); 8. P (pupae), late; 9. A (adults), D1; 10. A, D3; 11. A, D7], fat body (
 ) [12. 4th L, late; 13. 5th L, D1; 14. 5th L, preW; 15. 5th L, W (wandering); 16. P, D1–3; 17. P, D15–18; 18. A, D1–3; 19. A, D7–9], whole body (W) [20. E (embryo), 3 h; 21. E, late; 22. 1st L; 23. 2nd L; 24. 3rd L], midgut (
 ) (25. 2nd L; 26. 3rd L; 27. 4th L, 0 h; 28. 4th L, 12 h; 29. 4th L, late; 30. 5th L, 1–3 h; 31. 5th L, 24 h; 32. 5th L, preW; 33–34. 5th L, W; 35. P, D1; 36. P, D15–18; 37. A, D3–5), Malpighian tubule (
 ) (38. 5th L, preW; 39. A, D1; 40. A, D3), muscle (
 ) (41. 4th L, late; 42–43. 5th L, 12 h; 44–45. 5th L, preW; 46–47. 5th L, W), testis (
 ) (48. P, D3; 49. P, D15–18; 50. A, D1–3), ovary (
 ) (51. P, D15–18; 52. A, D1), head (
 ) [53–56. A, D1, F (female); 57–60, A, D1, M (male)], antenna (
 ) (61–63, 5th L; 64–66, A, F; 67, A, M)
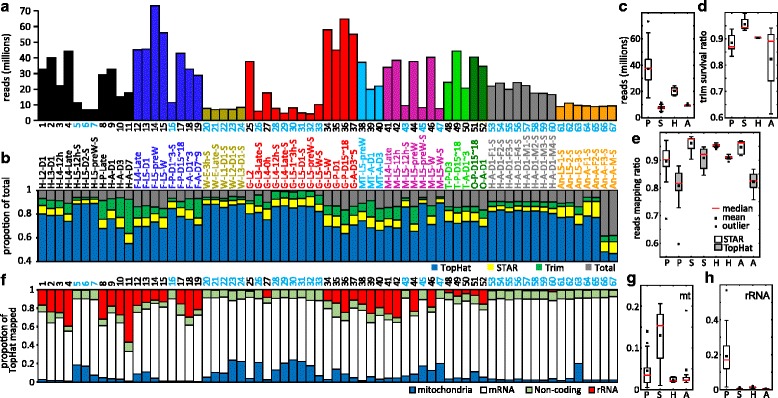


Similar articles
-
Integrated modeling of protein-coding genes in the Manduca sexta genome using RNA-Seq data from the biochemical model insect.Insect Biochem Mol Biol. 2015 Jul;62:2-10. doi: 10.1016/j.ibmb.2015.01.007. Epub 2015 Jan 20. Insect Biochem Mol Biol. 2015. PMID: 25612938 Free PMC article.
-
The immune signaling pathways of Manduca sexta.Insect Biochem Mol Biol. 2015 Jul;62:64-74. doi: 10.1016/j.ibmb.2015.03.006. Epub 2015 Apr 7. Insect Biochem Mol Biol. 2015. PMID: 25858029 Free PMC article.
-
Multifaceted biological insights from a draft genome sequence of the tobacco hornworm moth, Manduca sexta.Insect Biochem Mol Biol. 2016 Sep;76:118-147. doi: 10.1016/j.ibmb.2016.07.005. Epub 2016 Aug 12. Insect Biochem Mol Biol. 2016. PMID: 27522922 Free PMC article.
-
[RNA-Seq and its applications: a new technology for transcriptomics].Yi Chuan. 2011 Nov;33(11):1191-202. doi: 10.3724/sp.j.1005.2011.01191. Yi Chuan. 2011. PMID: 22120074 Review. Chinese.
-
Putting the genome in insect phylogenomics.Curr Opin Insect Sci. 2019 Dec;36:111-117. doi: 10.1016/j.cois.2019.08.002. Epub 2019 Aug 13. Curr Opin Insect Sci. 2019. PMID: 31546095 Review.
Cited by
-
Changes in composition and levels of hemolymph proteins during metamorphosis of Manduca sexta.Insect Biochem Mol Biol. 2020 Dec;127:103489. doi: 10.1016/j.ibmb.2020.103489. Epub 2020 Oct 20. Insect Biochem Mol Biol. 2020. PMID: 33096211 Free PMC article.
-
Rapid local adaptation linked with phenotypic plasticity.Evol Lett. 2020 May 27;4(4):345-359. doi: 10.1002/evl3.176. eCollection 2020 Aug. Evol Lett. 2020. PMID: 32774883 Free PMC article.
-
Manduca sexta hemolymph protease-2 (HP2) activated by HP14 generates prophenoloxidase-activating protease-2 (PAP2) in wandering larvae and pupae.Insect Biochem Mol Biol. 2018 Oct;101:57-65. doi: 10.1016/j.ibmb.2018.08.001. Epub 2018 Aug 8. Insect Biochem Mol Biol. 2018. PMID: 30098411 Free PMC article.
-
Innate Immune Responses of Galleria mellonella to Mycobacterium bovis BCG Challenge Identified Using Proteomic and Molecular Approaches.Front Cell Infect Microbiol. 2021 Feb 9;11:619981. doi: 10.3389/fcimb.2021.619981. eCollection 2021. Front Cell Infect Microbiol. 2021. PMID: 33634038 Free PMC article.
-
Proteomic Analysis of the Midgut Contents of Silkworm in the Pupal Stage.Insects. 2023 Dec 15;14(12):953. doi: 10.3390/insects14120953. Insects. 2023. PMID: 38132625 Free PMC article.
References
-
- Reinecke JP, Buckner J, Grugel S. Life cycle of laboratory-reared tobacco hornworms, Manduca sexta, a study of development and behavior, using time-lapse cinematography. Biol Bull. 1980;158(1):129–140. doi: 10.2307/1540764. - DOI
-
- Tetreau G, Cao X, Chen YR, Muthukrishnan S, Jiang H, Blissard GW, Kanost MR, Wang P. Overview of chitin metabolism enzymes in Manduca sexta: identification, domain organization, phylogenetic analysis and gene expression. Insect Biochem Mol Biol. 2015;62:114–126. doi: 10.1016/j.ibmb.2015.01.006. - DOI - PubMed
MeSH terms
Substances
Grants and funding
LinkOut - more resources
Full Text Sources
Other Literature Sources
Molecular Biology Databases
Research Materials
