. 2017 Oct 17;49(1):74.
doi: 10.1186/s12711-017-0348-8.

Locally epistatic models for genome-wide prediction and association by importance sampling

Affiliations

Locally epistatic models for genome-wide prediction and association by importance sampling

Deniz Akdemir et al. Genet Sel Evol. .

Abstract

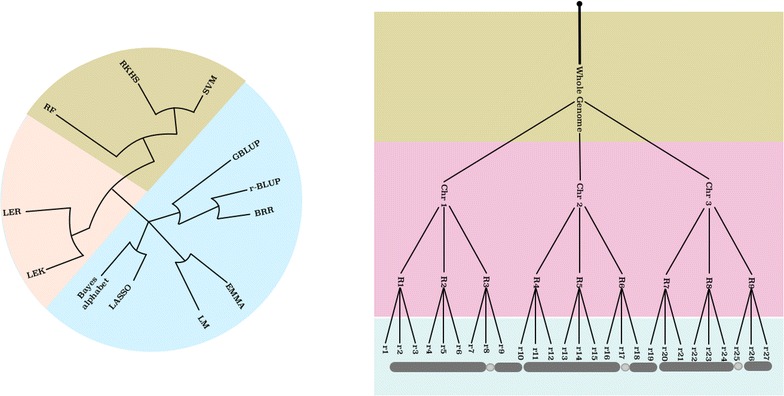
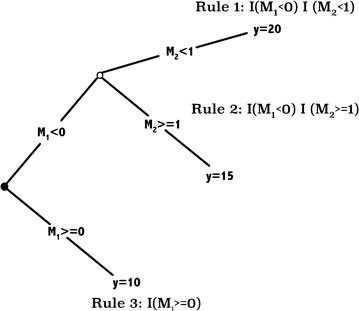
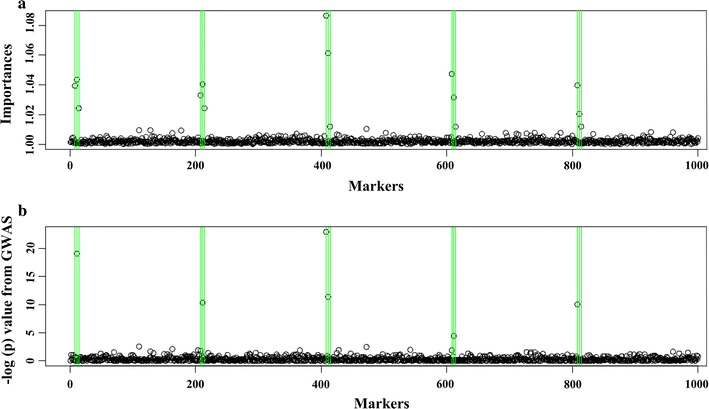
Background: In statistical genetics, an important task involves building predictive models of the genotype-phenotype relationship to attribute a proportion of the total phenotypic variance to the variation in genotypes. Many models have been proposed to incorporate additive genetic effects into prediction or association models. Currently, there is a scarcity of models that can adequately account for gene by gene or other forms of genetic interactions, and there is an increased interest in using marker annotations in genome-wide prediction and association analyses. In this paper, we discuss a hybrid modeling method which combines parametric mixed modeling and non-parametric rule ensembles.

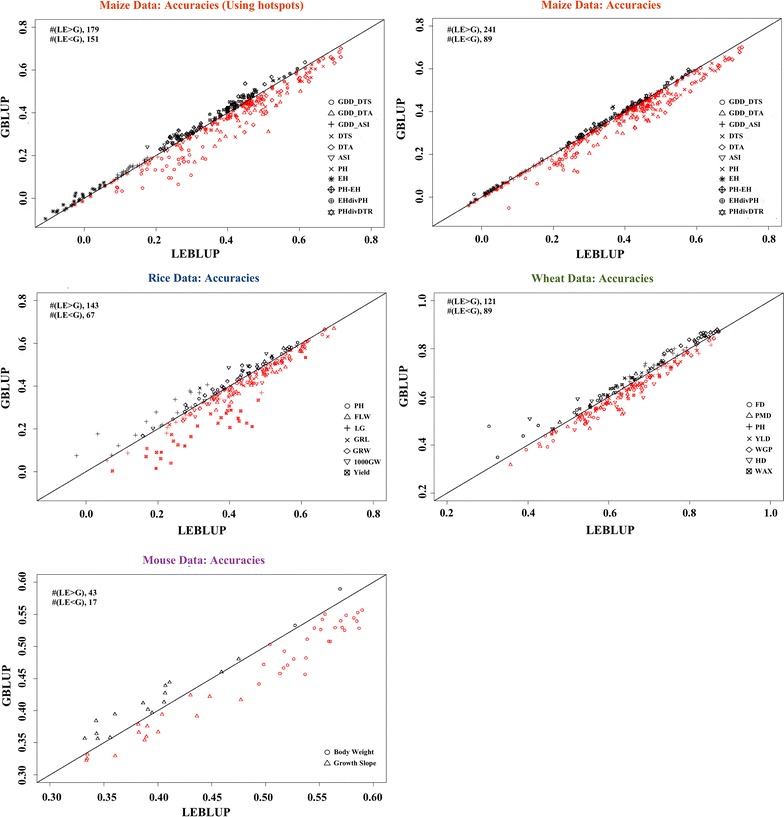
Results: This approach gives us a flexible class of models that can be used to capture additive, locally epistatic genetic effects, gene-by-background interactions and allows us to incorporate one or more annotations into the genomic selection or association models. We use benchmark datasets that cover a range of organisms and traits in addition to simulated datasets to illustrate the strengths of this approach.

Conclusions: In this paper, we describe a new strategy for incorporating genetic interactions into genomic prediction and association models. This strategy results in accurate models, with sometimes significantly higher accuracies than that of a standard additive model.


Figures

Fig. 1
Fig. 1
Many of the models used in genomic prediction and association analyses are additive: These include ridge regression-best linear unbiased prediction (rr-BLUP) [31, 32], Lasso [33], Bayesian–Lasso [34], Bayesian ridge regression, Bayesian alphabet [35, 36], GBLUP and EMMA [47]. Several scientists have also developed methods to use genome-wide epistatic effects: RKHS [37, 38]), RF [39], SVM. The dendrogram on the left was obtained based on a table of the properties of different models, this table included variables such as “additive-epistatic”, “global-local”, “marker-kernel based”; it should not be taken as a formal clustering of models. The colors attached to the groups in the dendrogram are matched with different parts of the genome to illustrate the focus of each of these groups. Locally epistatic kernels (LEK) and locally epistatic rules (LER) models that use local epistasis
Fig. 2
Fig. 2
An example of a tree to rules. At each intermediate node, an observation goes to the left branch if and only if the condition shown there is satisfied. A simple regression tree which can be represented as y=20I(M1<0)(M2<1)+15I(M1<0)I(M21)+10I(M10). Each leaf node defines a rule which can be expressed as a product of indicator functions of half spaces. Each rule specifies a ‘simple’ rectangular region in the input space
Fig. 3
Fig. 3
Accuracy obtained with the LER and GBLUP models (measured as the correlation between the estimated genetic values and the response variable) for each of the 30 replicates for each trait in all datasets. The red colored data points below the y = x show the instances where the LER models performed better than the GBLUP models. Black colored data points show the instances where the GBLUP models performed better than the LER models. The number of times that each model performed better than the other is shown on the top left side for each dataset. GDD_DTA: growing degree days to silk, GDD_DTA growing degree days to anthesis, GDD_ASI growing degree days to anthesis-silking interval, DTS days to silking, DTA days to anthesis, ASI anthesis silking interval days, PH plant height, EH ear height, PH-EH PH minus EH, EHdivPH EH divided by PH, PHdivDTR PH divided by days to anthesis FLW flag leaf width, LG lodging, GRL grain length, GRW grain weight, 1000GW thousand grain weight, YLD yield, FD flowering day, PMD physiological maturity day, WGP whole grain protein, HD heading date Julian, WAX waxiness
Fig. 4
Fig. 4
Importance scores from the LER model using the trait values and the genotypes generated as described in Table 3 based on a standard additive GWAS mixed model. The green lines highlight the SNPs that were used to calculate the genetic values. The importance scores and the results from the standard GWAS were similar. More SNPs were identified correctly as important by the LER approach
Fig. 5
Fig. 5
Additive and two-way interaction importance measures for the first three principal components and the 27 most important SNPs for one simulation as described in Table 3. The main effects of the SNPs are displayed on the diagonal and the off-diagonal shows two way interactions. The darker cells indicate more important SNPs, or interactions

References

    1. Provine WB. The origins of theoretical population genetics: with a new afterword. Chicago: University of Chicago Press; 2001.
    1. Fisher RA. The correlation between relatives on the supposition of mendelian inheritance. Tran R Soc Edinb. 1918;52:399–433. doi: 10.1017/S0080456800012163. - DOI
    1. Mackay TF. The genetic architecture of quantitative traits. Ann Rev Genet. 2001;35:303–39. doi: 10.1146/annurev.genet.35.102401.090633. - DOI - PubMed
    1. Holland JB. Genetic architecture of complex traits in plants. Curr Opin Plant Biol. 2007;10:156–61. doi: 10.1016/j.pbi.2007.01.003. - DOI - PubMed
    1. Flint J, Mackay TF. Genetic architecture of quantitative traits in mice, flies, and humans. Genome Res. 2009;19:723–33. doi: 10.1101/gr.086660.108. - DOI - PMC - PubMed

Publication types

LinkOut - more resources