

Simplified prognostic model for critically ill patients in resource limited settings in South Asia
- PMID: 29041985
- PMCID: PMC5645891
- DOI: 10.1186/s13054-017-1843-6
Simplified prognostic model for critically ill patients in resource limited settings in South Asia
Abstract
Background: Current critical care prognostic models are predominantly developed in high-income countries (HICs) and may not be feasible in intensive care units (ICUs) in lower- and middle-income countries (LMICs). Existing prognostic models cannot be applied without validation in LMICs as the different disease profiles, resource availability, and heterogeneity of the population may limit the transferability of such scores. A major shortcoming in using such models in LMICs is the unavailability of required measurements. This study proposes a simplified critical care prognostic model for use at the time of ICU admission.
Methods: This was a prospective study of 3855 patients admitted to 21 ICUs from Bangladesh, India, Nepal, and Sri Lanka who were aged 16 years and over and followed to ICU discharge. Variables captured included patient age, admission characteristics, clinical assessments, laboratory investigations, and treatment measures. Multivariate logistic regression was used to develop three models for ICU mortality prediction: model 1 with clinical, laboratory, and treatment variables; model 2 with clinical and laboratory variables; and model 3, a purely clinical model. Internal validation based on bootstrapping (1000 samples) was used to calculate discrimination (area under the receiver operating characteristic curve (AUC)) and calibration (Hosmer-Lemeshow C-Statistic; higher values indicate poorer calibration). Comparison was made with the Acute Physiology and Chronic Health Evaluation (APACHE) II and Simplified Acute Physiology Score (SAPS) II models.
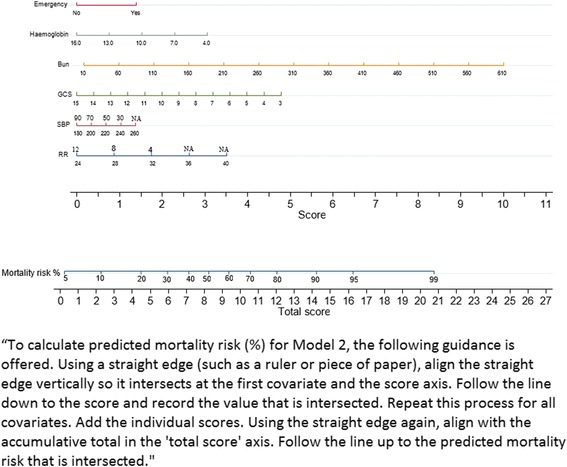
Results: Model 1 recorded the respiratory rate, systolic blood pressure, Glasgow Coma Scale (GCS), blood urea, haemoglobin, mechanical ventilation, and vasopressor use on ICU admission. Model 2, named TropICS (Tropical Intensive Care Score), included emergency surgery, respiratory rate, systolic blood pressure, GCS, blood urea, and haemoglobin. Model 3 included respiratory rate, emergency surgery, and GCS. AUC was 0.818 (95% confidence interval (CI) 0.800-0.835) for model 1, 0.767 (0.741-0.792) for TropICS, and 0.725 (0.688-0.762) for model 3. The Hosmer-Lemeshow C-Statistic p values were less than 0.05 for models 1 and 3 and 0.18 for TropICS. In comparison, when APACHE II and SAPS II were applied to the same dataset, AUC was 0.707 (0.688-0.726) and 0.714 (0.695-0.732) and the C-Statistic was 124.84 (p < 0.001) and 1692.14 (p < 0.001), respectively.
Conclusion: This paper proposes TropICS as the first multinational critical care prognostic model developed in a non-HIC setting.
Keywords: APACHE II; Critical care; Lower middle income country; Model performance; Prognostic model; Resource limited settings.
Conflict of interest statement
Ethics approval and consent to participate
Not applicable.
Consent for publication
Not applicable.
Competing interests
The authors declare that they have no competing interests.
Publisher’s Note
Springer Nature remains neutral with regard to jurisdictional claims in published maps and institutional affiliations.
Figures
Comment in
-
Developing a feasible and valid scoring system for critically ill patients in resource-limited settings.Crit Care. 2018 Jan 5;22(1):2. doi: 10.1186/s13054-017-1902-z. Crit Care. 2018. PMID: 29304846 Free PMC article. No abstract available.
References
-
- Yatawatta AB, Wanniarachchi CR, Goonasekera CDA. An audit of intensive care services in Sri Lanka. Ceylon Med J. 2004;49:51–4. - PubMed
MeSH terms
LinkOut - more resources
Full Text Sources
Other Literature Sources
