. 2018 Jan:128:255-268.
doi: 10.1016/j.neuropharm.2017.10.014. Epub 2017 Oct 16.

Mechanisms of μ-opioid receptor inhibition of NMDA receptor-induced substance P release in the rat spinal cord

Affiliations

Mechanisms of μ-opioid receptor inhibition of NMDA receptor-induced substance P release in the rat spinal cord

Wenling Chen et al. Neuropharmacology. 2018 Jan.

Abstract

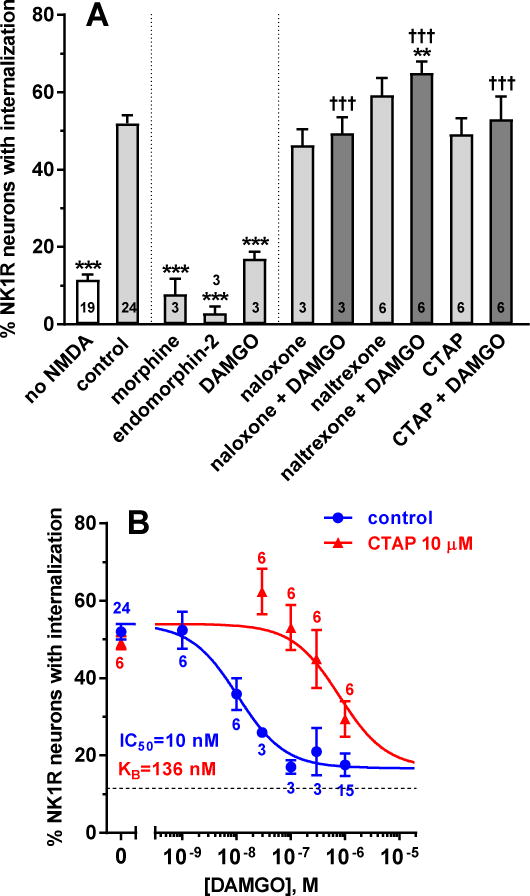
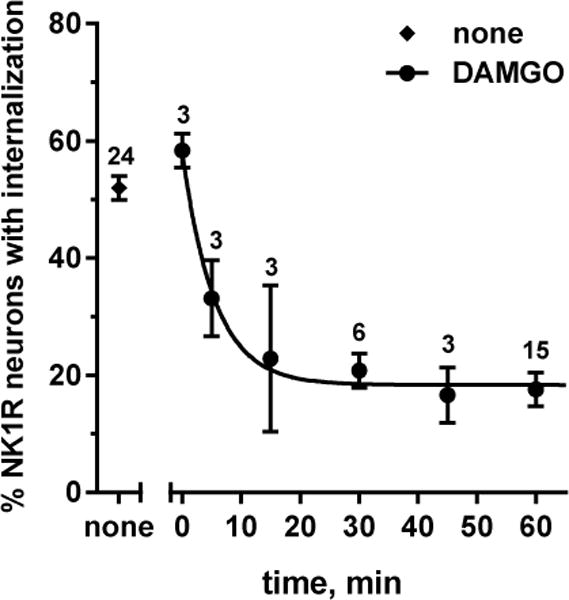
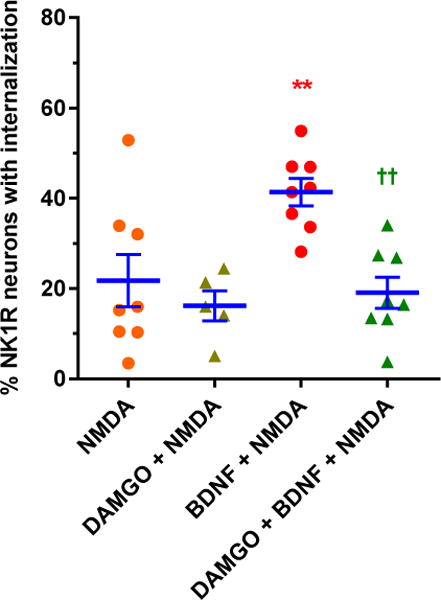
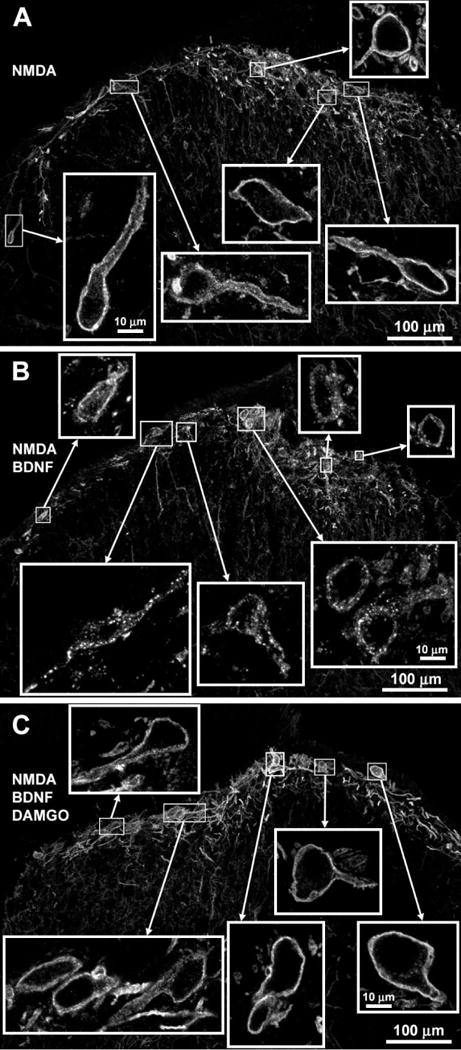
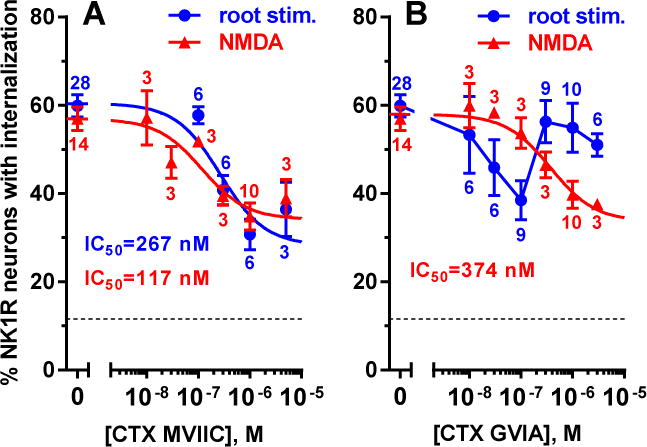
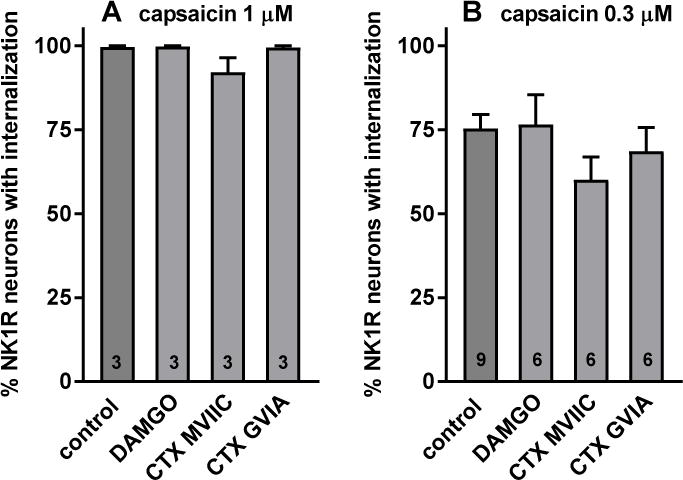
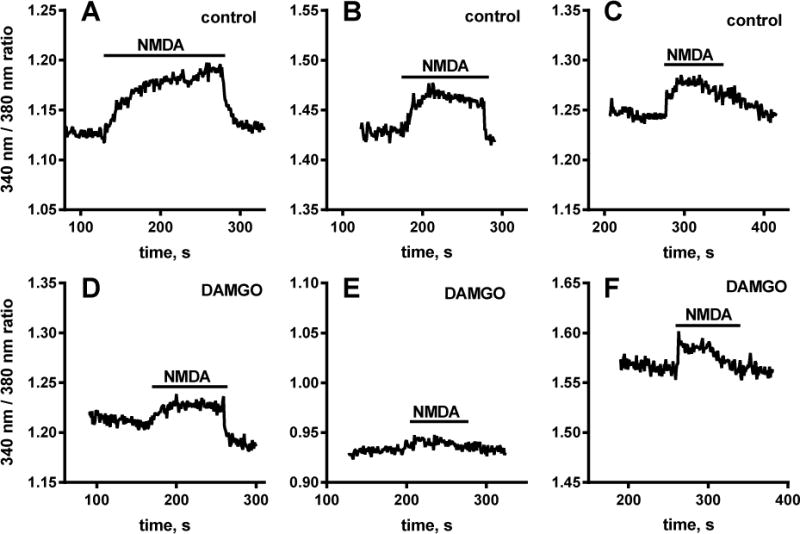
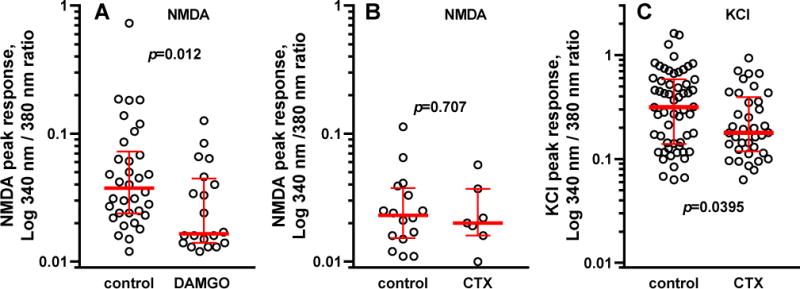
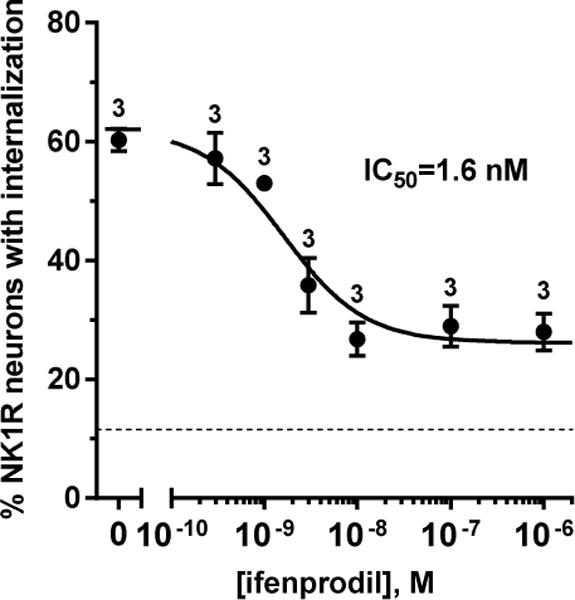
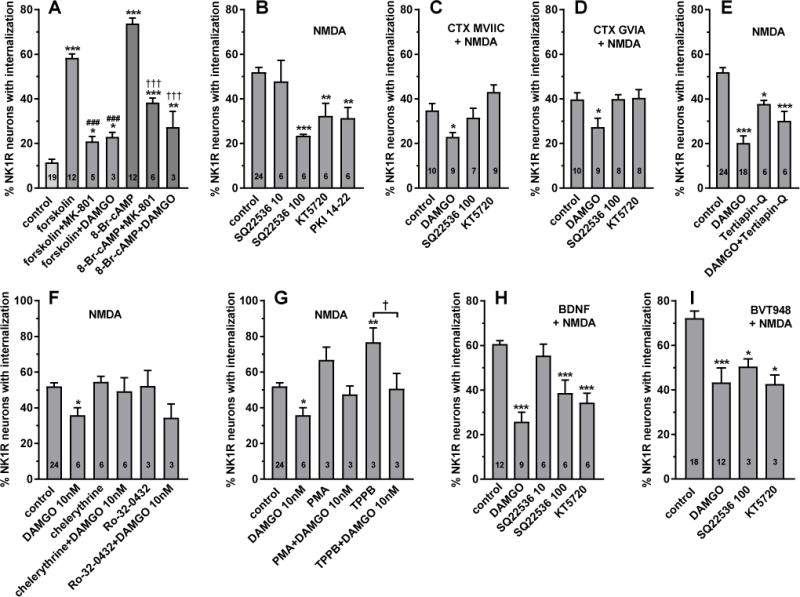
The interaction between NMDA receptors and μ-opioid receptors in primary afferent terminals was studied by using NMDA to induce substance P release, measured as neurokinin 1 receptor internalization. In rat spinal cord slices, the μ-opioid receptor agonists morphine, DAMGO and endomorphin-2 inhibited NMDA-induced substance P release, whereas the antagonist CTAP right-shifted the concentration response of DAMGO. In vivo, substance P release induced by intrathecal NMDA after priming with BDNF was inhibited by DAMGO. ω-Conotoxins MVIIC and GVIA inhibited about half of the NMDA-induced substance P release, showing that it was partially mediated by the opening of voltage-gated calcium (Cav) channels. In contrast, DAMGO or ω-conotoxins did not inhibit capsaicin-induced substance P release. In cultured DRG neurons, DAMGO but not ω-conotoxin inhibited NMDA-induced increases in intracellular calcium, indicating that μ-opioid receptors can inhibit NMDA receptor function by mechanisms other than inactivation of Cav channels. Moreover, DAMGO decreased the ω-conotoxin-insensitive component of the substance P release. Potent inhibition by ifenprodil showed that these NMDA receptors have the NR2B subunit. Activators of adenylyl cyclase and protein kinase A (PKA) induced substance P release and this was decreased by the NMDA receptor blocker MK-801 and by DAMGO. Conversely, inhibitors of adenylyl cyclase and PKA, but not of protein kinase C, decreased NMDA-induced substance P release. Hence, these NMDA receptors are positively modulated by the adenylyl cyclase-PKA pathway, which is inhibited by μ-opioid receptors. In conclusion, μ-opioid receptors inhibit NMDA receptor-induced substance P release through Cav channel inactivation and adenylyl cyclase inhibition.

Keywords: BVT948 (PubChem CID: 6604934); CTAP (PubChem CID: 90479802); Calcium channel; DAMGO (PubChem CID: 5462471); Endomorphin-2 (PubChem CID: 5311081); KT5720 (PubChem CID: 454202); Mu-opioid receptor; NMDA (PubChem CID: 22880); NMDA receptor; Neurokinin 1 receptor; Primary afferent; Protein kinase A; SQ22536 (PubChem CID: 5270); d-serine (PubChem CID: 71077); ω-conotoxin GVIA (PubChem CID: 73169082); ω-conotoxin MVIIC (PubChem CID: 56841670).


Figures

Figure 1
Figure 1. MOR inhibition of NMDA-induced substance P release in spinal cord slices
Spinal cord slices were incubated for 60 min with compounds and then for 2 min with NMDA and D-Ser (both 10 μM). The number of slices (n) is given inside the bars or next to the points. A. ‘no NMDA’: no compounds and no NMDA; ‘control’: no compounds followed by NMDA+D-Ser. Compounds were MOR agonists (1 μM morphine, 1 μM endomorphin-2, 100 nM DAMGO) and antagonists (10 μM naloxone, 10 μM naltrexone, 10 μM CTAP). ANOVA, p<0.0001. Holm-Sidak’s post-hoc tests: *** p<0.001, ** p<0.01 compared with control; ††† p<0.001 compared with DAMGO. B. DAMGO concentration-responses without (control) and with 10 μM CTAP. Data were analyzed by non-linear regression using the Gaddum-Schild model, with shared bottom and top parameters. Parameter values obtained were: IC50 (DAMGO) = 10 nM (95% CI 3.9 – 26.5 nM), KB (CTAP) = 136 nM (95% CI 43 – 393 nM), top = 54.0 ± 1.8%, bottom = 16.7 ± 2.7%, R2 = 0.64 (global fit).
Figure 2
Figure 2. Time course of the inhibition of NMDA-induced NK1R internalization by DAMGO
Spinal cord slices were incubated for the times indicated with 1 μM DAMGO and then for 2 min with 10 μM NMDA and D-Ser; “none”: no DAMGO incubation; 0 min: DAMGO included in the 2 min incubation with NMDA and D-Ser. Curve: fitting of a one-phase decay function: Y0 = 58 ± 6%, plateau = 18 ± 2%, K = 0.18 ± 0.08 min−1, t1/2 = 3.8 min (95% CI = 1.1 min – 11.5 min), R2 = 0.565. The number of slices (n) is given next to the points.
Figure 3
Figure 3. In vivo inhibition by DAMGO of NMDA-induced substance P release
Rats received three intrathecal injections using the following time line: 0 h - saline or BDNF (0.3 μg); 3 h - saline or DAMGO (3 nmol); 4 h - NMDA + D-Ser (10 nmol each). Data are from spinal segment L4. NMDA induced NK1R internalization only after BDNF, and this was reduced by DAMGO. ANOVA: p=0.0011, F3,25 = 7.33. Holm-Sidak’s post-hoc test: ** p <0.01 compared with NMDA; †† p < 0.01 compared with BDNF + NMDA.
Figure 4
Figure 4. Confocal microscope images of lamina 1 neurons with and without NK1R internalization
Images were taken from the L4 spinal segment of the rats used from the experiment in Fig. 3. Rats received three intrathecal injections using the following time line: 0 h - saline or BDNF (0.3 μg); 3 h - saline or DAMGO (3 nmol); 4 h - NMDA + D-Ser (10 nmol each). A. Rat injected with saline-saline-NMDA; there was no NK1R internalization. B. Rat injected with BDNF-saline-NMDA; NK1R internalization is clear in 5 out of 7 cells. C. Rat injected with BDNF-DAMGO-NMDA; there was no NK1R internalization. Images are 10 optical sections taken with a 20× objective (main panels, voxel size 692 × 692 × 854 nm, scale bar 100 μm) or a 63× objective (insets, voxel size 132 × 132 × 377 nm, scale bar 10 μm).
Figure 5
Figure 5. Inhibition by ω-conotoxins (CTX) of NK1R internalization evoked by NMDA or dorsal root stimulation. NMDA
Spinal cord slices were incubated for 60 min with different concentrations of CTX MVIIC (A) or CTX GVIA (B), and then for 2 min with 10 μM NMDA and D-Ser. Root stimulation: Spinal cord slices with one dorsal root (L4–L5) were superfused for 2 min with CTX MVIIC (A) or incubated for 60 min with CTX GVIA and then superfused with it (B). Next, the dorsal root was stimulated with 1000 pulses (20 V, 0.4 ms) at 100 Hz, and the slice was superfused with aCSF for 10 min more. For controls (0 M), slices were incubated or superfused with aCSF. Parameters of the concentration-response curves are given in Table 1. The number of slices (n) is given next to the points. The dotted horizontal line represents basal values of NK1R internalization in the absence of NMDA or root stimulation.
Figure 6
Figure 6. Capsaicin-induced NK1R internalization was not affected by DAMGO or ω-conotoxins (CTX)
Spinal cord slices were incubated for 60 min with aCSF (“no capsaicin” and control), 100 nM DAMGO), 1 μM CTX-MVIIC or 1 μM CTX-GVIA. Then the slices (except for “no capsaicin”) were incubated for 2 min with 1 μM (A) or 0.3 μM (B) capsaicin. Numbers inside bars indicate the number of slices in each group. ANOVA (A): p=0.0957, F3,8 = 2.99; ANOVA (B): p=298, F3,23 = 1.3.
Figure 7
Figure 7. Representative traces of increases in [Ca2+]i produced by NMDA in DRG neurons
Cultured DRG neurons were loaded for 1 h with 5 μM Fura-2 AM and then incubated for 15 min with 20 ng/ml BDNF alone (A–C) or with 1 μM DAMGO (D–F). [Ca2+]i was measured with a fluorescence microscope while the cells were superfused with medium. Addition of 250 μM NMDA + 10 μM glycine (“NMDA”) produced increases in [Ca2+]i. Preincubation with DAMGO resulted in smaller increases in [Ca2+]i induced by NMDA + glycine.
Figure 8
Figure 8. DAMGO, but not CTX MVIIC, decreases NMDA-induced [Ca2+]i responses in DRG neurons
A. Cultured DRG neurons were loaded for 1 h with 5 μM Fura-2 AM and then incubated for 15 min with 20 ng/ml BDNF with or without 1 μM DAMGO. Responses were evoked by rapid infusion of 250 μM NMDA + 10 μM glycine. B. DRG neurons were loaded for 1 h with Fura-2 AM without (control) or with 1 μM CTX GVIA (CTX), and then incubated with BDNF as above before stimulation with 250 μM NMDA + 10 μM glycine. C. Neurons loaded with Fura-2 AM for 1 h with or without CTX GVIA were stimulated with 50 mM KCl to induce the opening of Cav channels. Bars show the median response and the interquartile range. A Mann-Whitney test was used to obtain the p values given in each panel.
Figure 9
Figure 9. Ifenprodil inhibition of NMDA-induced NK1R internalization
Concentration-responses for the NR2B-selective antagonist ifenprodil were obtained by incubating spinal cord slices with ifenprodil alone for 45 min and with NMDA, D-Ser, captopril and thiorphan (all 10 μM) for 2 min. The number of slices (n) is given next to the points. IC50 = 1.6 nM (95% CI = 0.7 – 3.6 μM), top = 62 ± 3%, bottom = 26 ± 2%, R2 = 0.86. The dotted horizontal line represents basal values of NK1R internalization in the absence of NMDA.
Figure 10
Figure 10. Involvement of AC, PKA and PKC on substance P release
A. Spinal cord slices were incubated for 60 min with 10 μM forskolin, 0.5 mM 8-Br-cAMP, or nothing (control). MK-801 (10 μM) or DAMGO (1 μM) were added at the same time as forskolin or 8-Br-cAMP. B–I: Substance P release was induced by incubating spinal cord slices for 2 min with 10 μM NMDA and 10 μM D-Ser. Before that, the slices were incubated for 60 min with the other compounds indicated. Compounds listed inside the panels above “+ NMDA” were applied to all of the slices in that panel, and were: 1 μM CTX MVIIC (C), 1 μM CTX GVIA (D), 20 ng/ml BDNF (H), and 10 μM BVT948 (I). In these panels, ‘control’ refers to slices incubated with these compounds followed by NMDA+D-Ser. Other compounds were: 10 μM chelerythrine (PKC inhibitor), 1 μM DAMGO, 10 μM KT5720 (PKA inhibitor), 10 μM PKI 14–22 myristolated (PKA inhibitor), 1 μM phorbol 12-myristate 13-acetate (PMA, PKC activator), 1 μM Ro-32-0432 (PKC inhibitor), 10 μM or 100 μM SQ 22536 (AC inhibitor), 100 nM tertiapin Q (GIRK inhibitor), and 1 μM TPPB (PKC activator). ANOVA: A, p<0.0001, F4,49=112; B, p<0.0001, F5,48=9.1; C, p=0.0007, F3,31=7.4; D, p=0.02, F3,31=3.8; E, p<0.0001, F3,49=30; F, p=0.0179, F5,42=1.826; G, p<0.0001, F5,36=1.869; H, p<0.0001, F4,34=17; I, p=0.0003, F3,32=8.48. Holm-Sidak’s post-hoc tests: * p<0.05, ** p<0.01, *** p<0.001, compared with control; ### p<0.001 compared to forskolin, ††† p< 0.001 compared to 8-Br-cAMP, † p< 0.05 as indicated. Numbers inside the bars indicate the number of slices in each group (n).

Similar articles

Cited by

References

    1. Abbadie C, Trafton J, Liu H, Mantyh PW, Basbaum AI. Inflammation increases the distribution of dorsal horn neurons that internalize the neurokinin-1 receptor in response to noxious and non-noxious stimulation. J Neurosci. 1997;17:8049–8060. - PMC - PubMed
    1. Adelson DW, Lao L, Zhang G, Kim W, Marvizón JC. Substance P release and neurokinin 1 receptor activation in the rat spinal cord increases with the firing frequency of C-fibers. Neuroscience. 2009;161:538–553. - PMC - PubMed
    1. Aimone LD, Yaksh TL. Opioid modulation of capsaicin-evoked release of substance P from rat spinal cord in vivo. Peptides. 1989;10:1127–1131. - PubMed
    1. Allen BJ, Rogers SD, Ghilardi JR, Menning PM, Kuskowski MA, Basbaum AI, Simone DA, Mantyh PW. Noxious cutaneous thermal stimuli induce a graded release of endogenous substance P in the spinal cord: imaging peptide action in vivo. J Neurosci. 1997;17:5921–5927. - PMC - PubMed
    1. Bardoni R, Torsney C, Tong CK, Prandini M, MacDermott AB. Presynaptic NMDA receptors modulate glutamate release from primary sensory neurons in rat spinal cord dorsal horn. J Neurosci. 2004;24:2774–2781. - PMC - PubMed

MeSH terms