. 2017 Nov;29(11):2727-2752.
doi: 10.1105/tpc.17.00348. Epub 2017 Oct 17.

Plastic Transcriptomes Stabilize Immunity to Pathogen Diversity: The Jasmonic Acid and Salicylic Acid Networks within the Arabidopsis/ Botrytis Pathosystem

Affiliations

Plastic Transcriptomes Stabilize Immunity to Pathogen Diversity: The Jasmonic Acid and Salicylic Acid Networks within the Arabidopsis/ Botrytis Pathosystem

Wei Zhang et al. Plant Cell. 2017 Nov.

Abstract

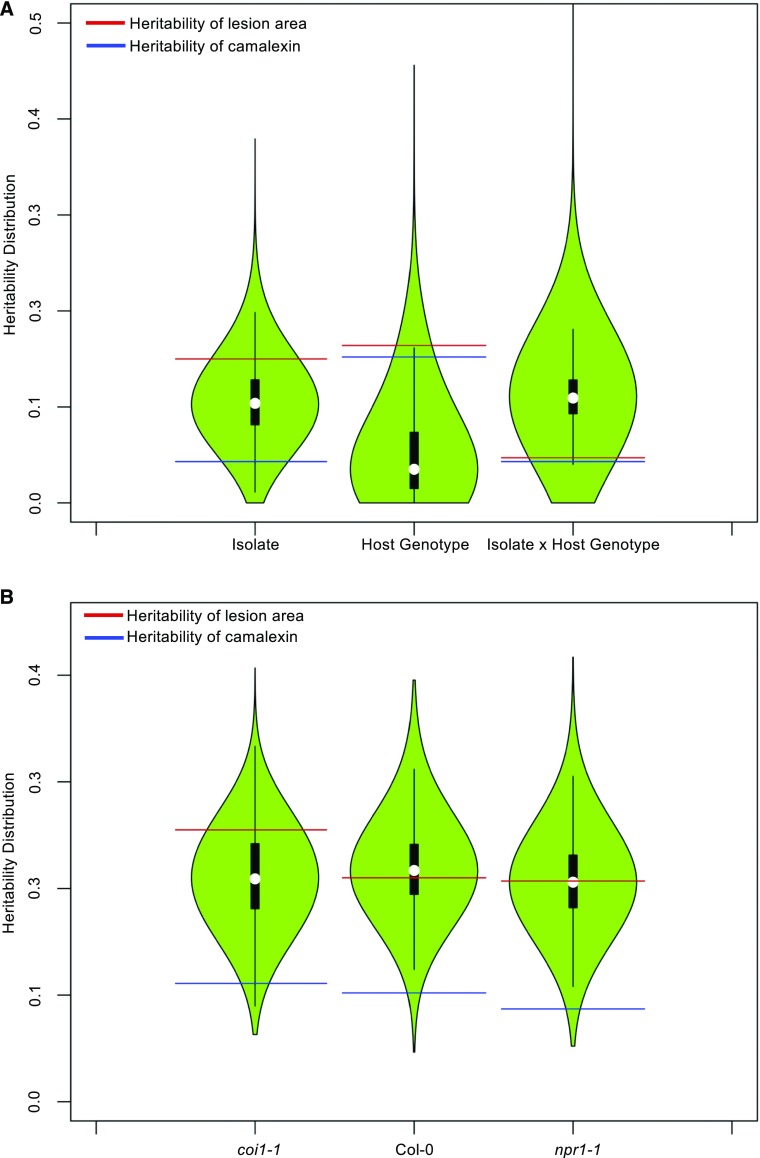
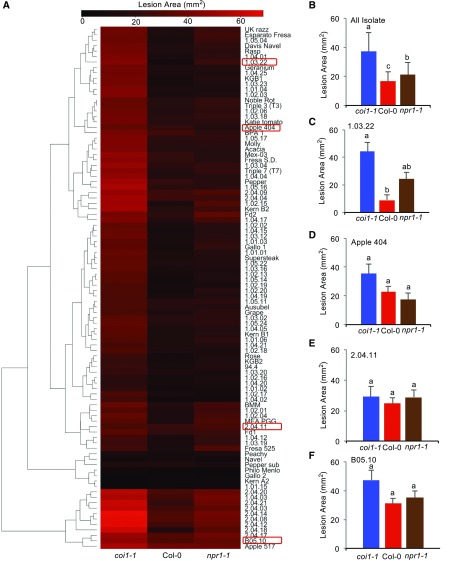
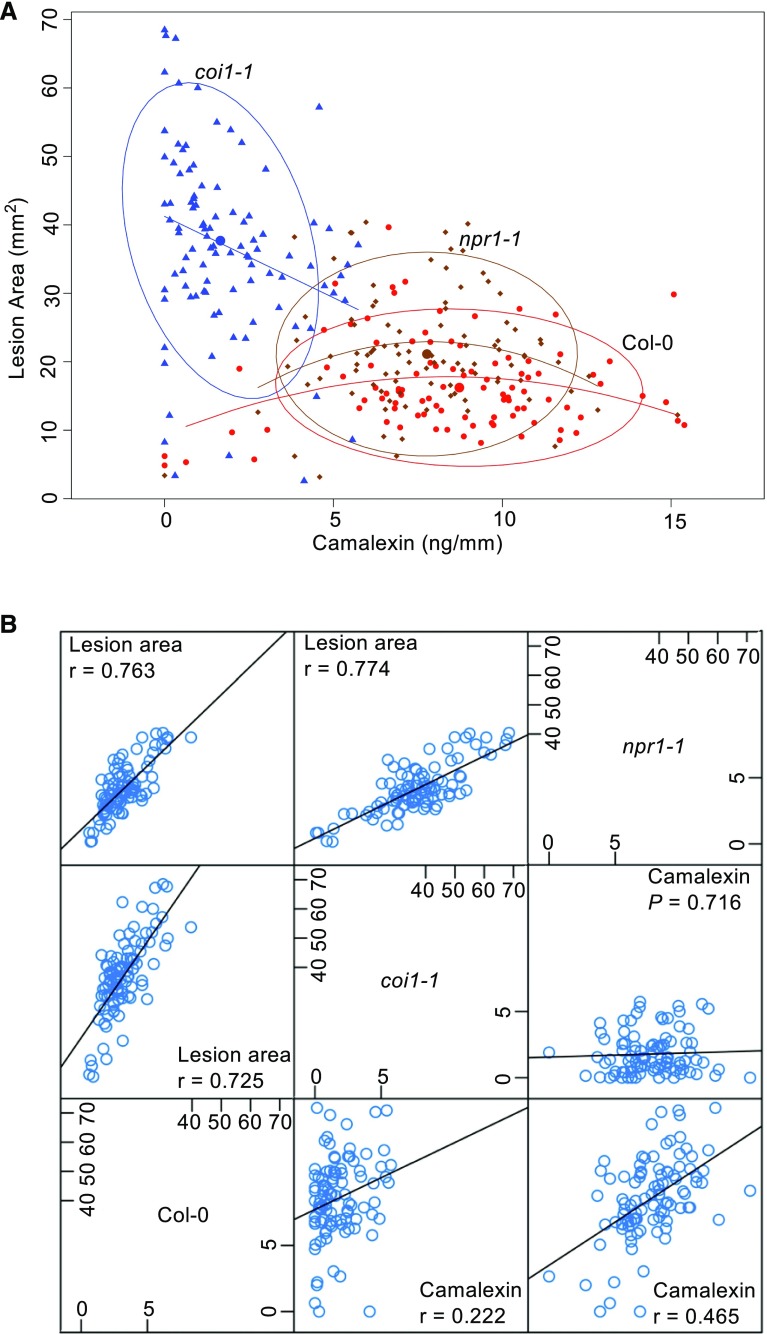
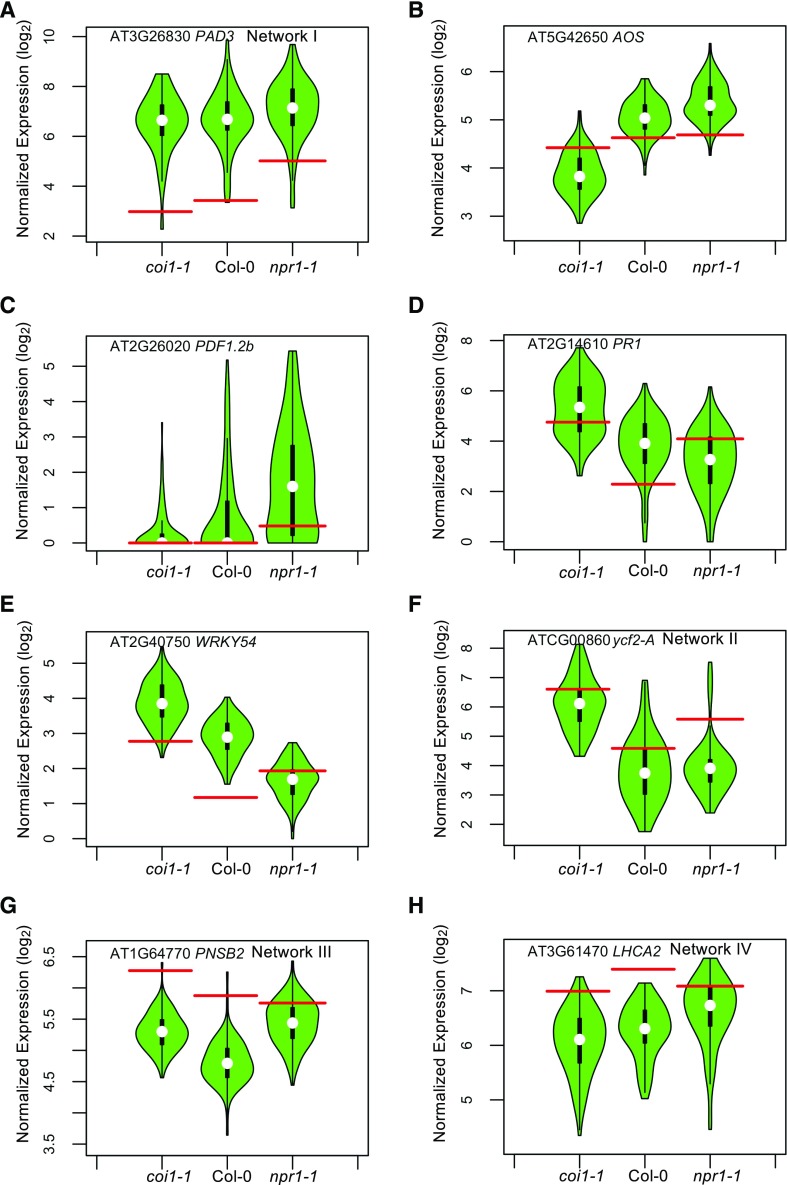
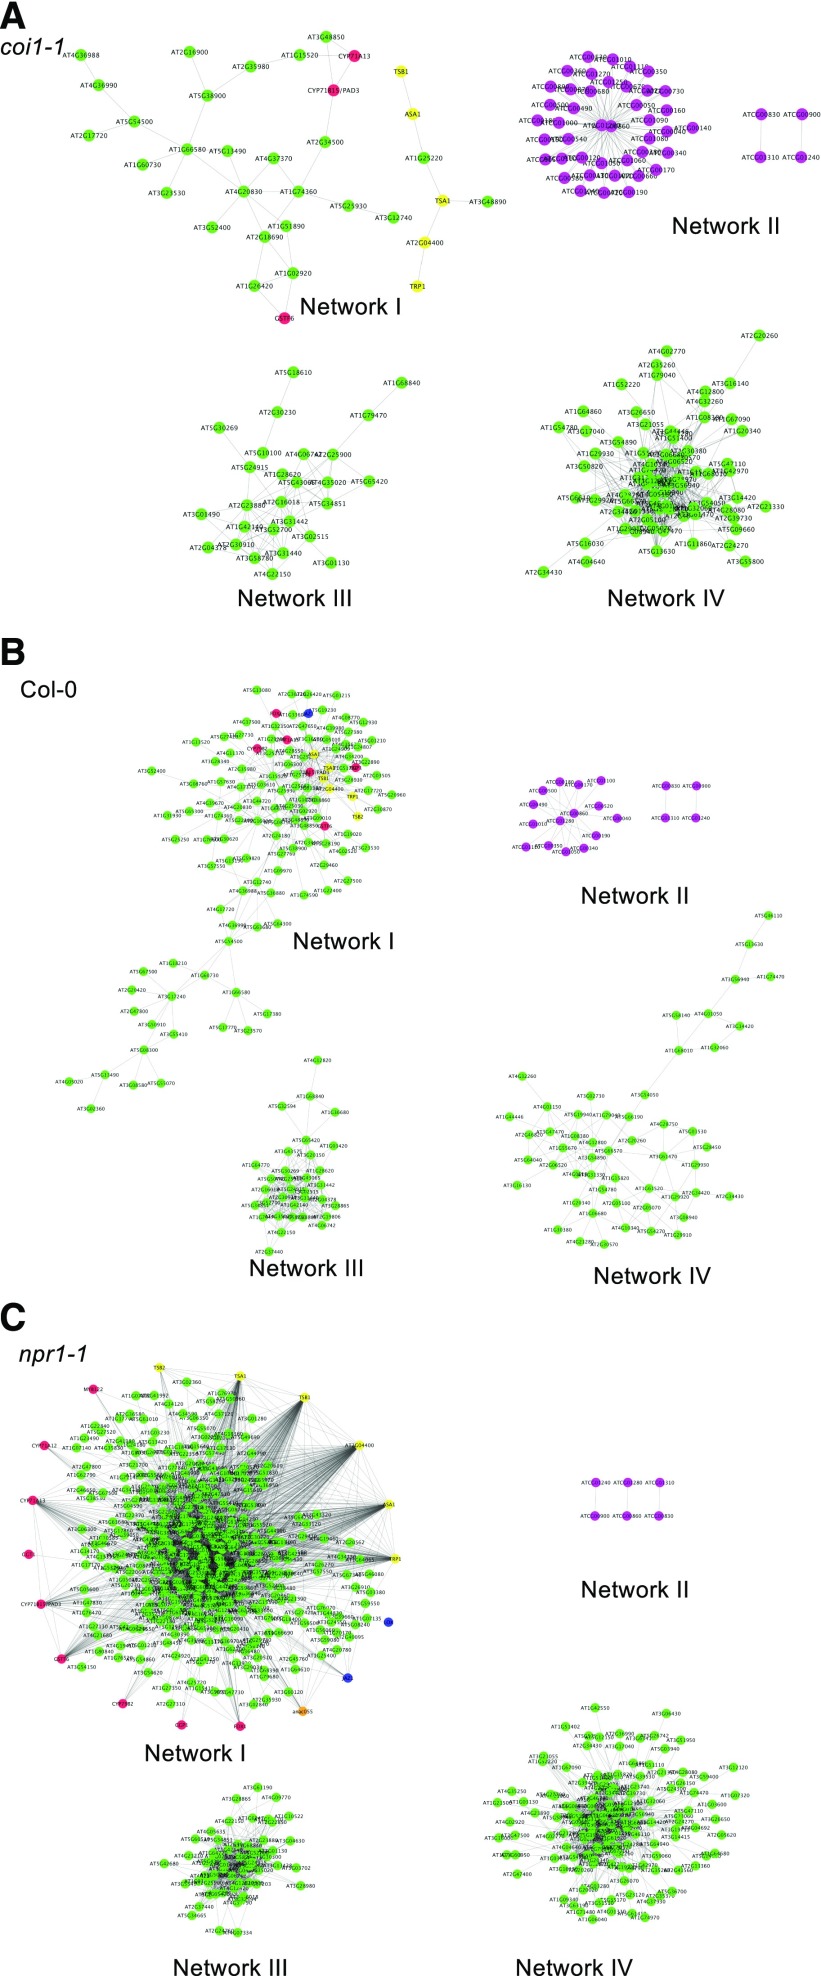
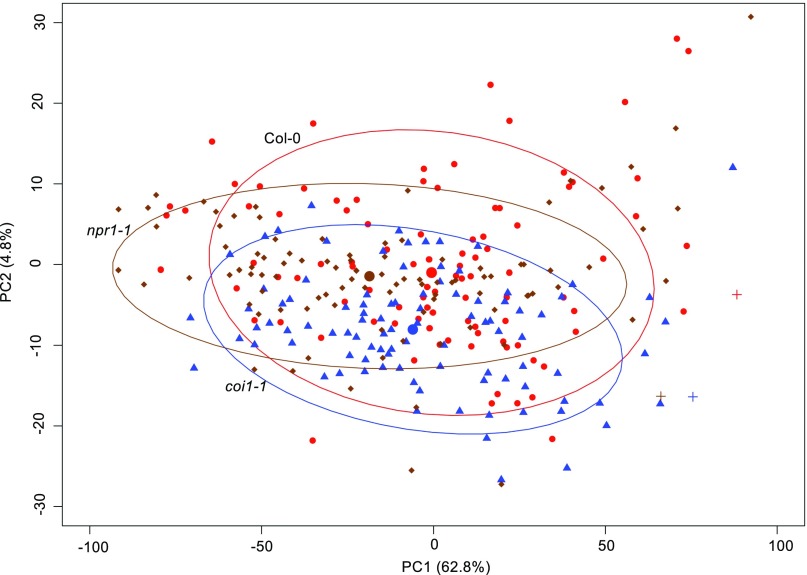
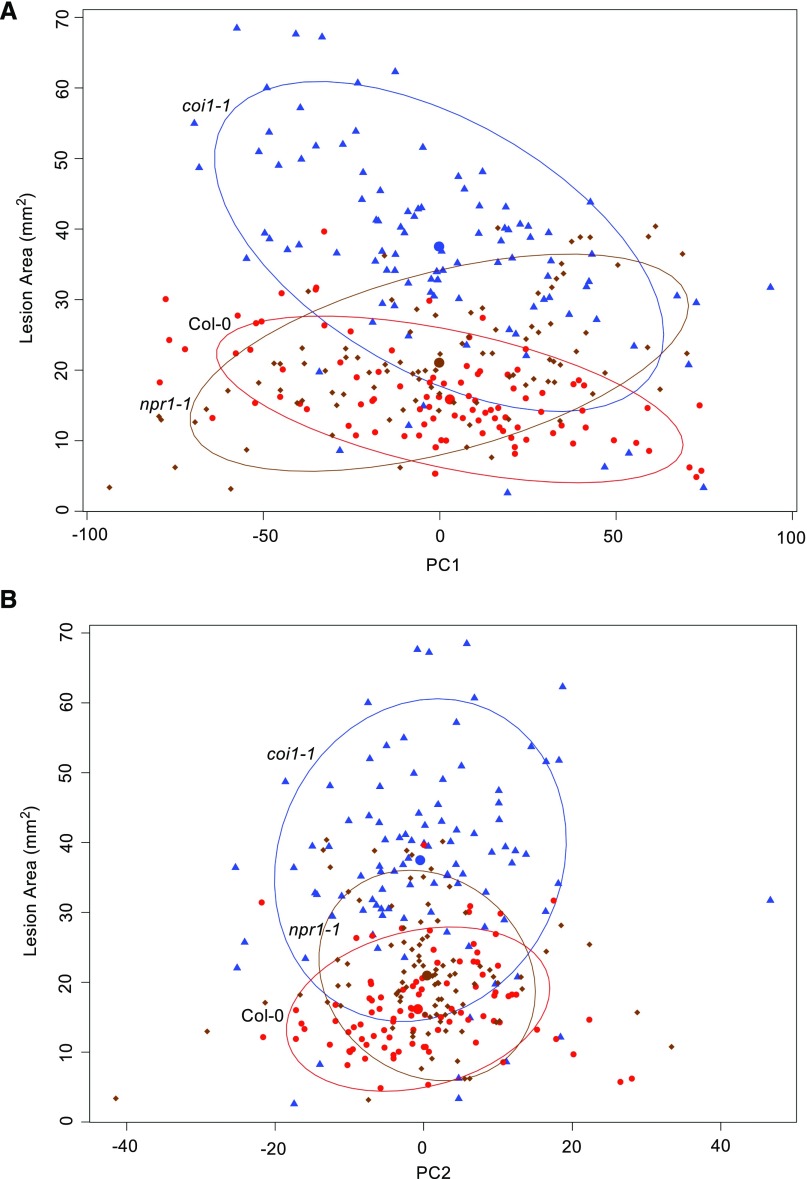
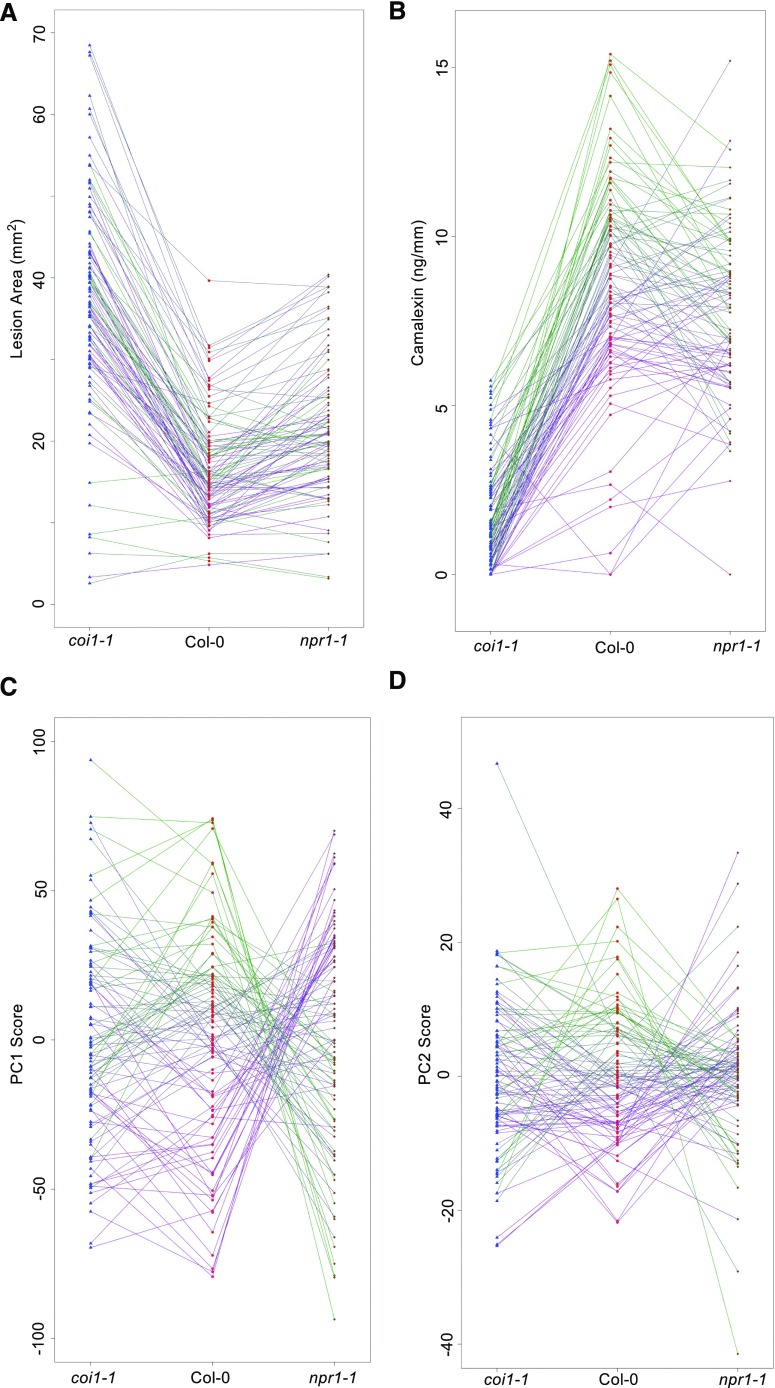
To respond to pathogen attack, selection and associated evolution has led to the creation of plant immune system that are a highly effective and inducible defense system. Central to this system are the plant defense hormones jasmonic acid (JA) and salicylic acid (SA) and crosstalk between the two, which may play an important role in defense responses to specific pathogens or even genotypes. Here, we used the Arabidopsis thaliana-Botrytis cinerea pathosystem to test how the host's defense system functions against genetic variation in a pathogen. We measured defense-related phenotypes and transcriptomic responses in Arabidopsis wild-type Col-0 and JA- and SA-signaling mutants, coi1-1 and npr1-1, individually challenged with 96 diverse B. cinerea isolates. Those data showed genetic variation in the pathogen influences on all components within the plant defense system at the transcriptional level. We identified four gene coexpression networks and two vectors of defense variation triggered by genetic variation in B. cinerea This showed that the JA and SA signaling pathways functioned to constrain/canalize the range of virulence in the pathogen population, but the underlying transcriptomic response was highly plastic. These data showed that plants utilize major defense hormone pathways to buffer disease resistance, but not the metabolic or transcriptional responses to genetic variation within a pathogen.


Figures

Figure 1.
Figure 1.
Distribution of Genetic Variation Controlling Defense Responses. Violin plots illustrating the distribution of estimated broad-sense heritability (H2) values for transcripts responding to 96 B. cinerea isolates across Arabidopsis genotypes. Heritability is partitioned across the different sources, 96 pathogen genotypes (Isolate), the Col-0, coi1-1, and npr1-1 plant genotypes (Host), and the corresponding interaction. The red lines indicate heritability values for lesion area, while blue shows those for camalexin accumulation in the same experiments. Plant defense-related phenotypes of camalexin accumulation and lesion area were measured on leaves from three Arabidopsis genotypes at 72 HPI with 96 diverse B. cinerea isolates. The transcriptomic analysis was conducted by sequencing mRNA extracted from infected Arabidopsis leaves at 16 HPI. (A) Heritability distributions for all 23,898 detected Arabidopsis transcripts in B. cinerea infected plant tissues. (B) Heritability values for Arabidopsis transcripts in B. cinerea infected plant tissues estimated by individually modeling the Col-0, coi1-1, and npr1-1 genotypes. The Arabidopsis genotypes are presented on the horizontal axis.
Figure 2.
Figure 2.
Variation in Arabidopsis Susceptibility across Host Genotypes Driven by Natural Genetic Variation in B. cinerea. Model-corrected lesion area means were estimated using the linear model with all the data from three Arabidopsis genotypes at 72 HPI with 96 B. cinerea isolates. The three Arabidopsis genotypes are either labeled at the bottom of the figure in (A) or shown with different color bars in (B) to (F), with red for wild-type Col-0, blue for the JA-insensitive mutant coi1-1, and brown for the SA mutant npr1-1. Error bars represent se for eight total samples across two independent experiments (n = 8). (A) Hierarchical clustering of lesion areas produced by 96 B. cinerea isolates across Arabidopsis genotypes. Color key indicates the lesion area value. Red boxes show the position of isolates highlighted in (C) to (E). (B) The average lesion area produced by 96 B. cinerea isolates within each Arabidopsis genotype. (C) Lesion area of isolate 1.03.22. (D) Lesion area of isolate Apple 404. (E) Lesion area of isolate 2.04.11. (F) Lesion area of isolate B05.10. Different letters above each bar show significant differences as determined by post-hoc Tukey’s HSD test following linear modeling.
Figure 3.
Figure 3.
Correlation between Camalexin Accumulation and Lesion Area across Arabidopsis Genotypes. The relationship of camalexin and lesion area measured on leaves from three Arabidopsis genotypes at 72 HPI with 96 B. cinerea isolates was compared using model-corrected means. The three Arabidopsis genotypes are wild-type Col-0 (red dot), JA-insensitive mutant coi1-1 (blue triangle), and SA mutant npr1-1 (brown diamond). (A) Scatterplots are shown comparing camalexin accumulation and lesion area across the 96 isolates within each of the three Arabidopsis genotypes. The 90% confidence ellipse intervals are drawn for each Arabidopsis genotype for reference. The regressions with the highest correlation are shown, with the equations being as follows: coi1-1, y = −2.1x + 40.7, P = 0.013; Col-0, y = −0.06x2 + 0.88x + 14.4, P = 0.014; npr1-1, y = −0.16x2 + 2.2x + 14.6, P = 0.012. (B) Scatterplots are shown comparing lesion area (top left) and camalexin accumulation (bottom right) across pairwise Arabidopsis genotypes.
Figure 4.
Figure 4.
Plasticity in Arabidopsis Defense-Related Genes in Response to B. cinerea Genetic Variation. The Arabidopsis genotypes, wild-type Col-0, JA-insensitive mutant coi1-1, and SA mutant npr1-1, are shown on the x axis. Violin plots show the distribution of transcript accumulation in response to the 96 B. cinerea isolates for specific transcripts. Red lines indicate the average transcript accumulation in mock-treated plant tissues for each Arabidopsis genotype. The transcripts shown are PAD3 (A), AOS (B), PDF1.2b (C), PR1(D), WRKY54 (E), ycf2-A (F), PNSB2 (G), and LHCA2 (H).
Figure 5.
Figure 5.
PR1 Expression across Arabidopsis Genotypes. Rank plot showing the relationship of PR1 expression across three host genotypes (x axis) in control and in response to 30 diverse B. cinerea isolates (right). The isolates shown on the plot were chosen to provide an image of the major patterns found in the full collection of 96 isolates. The isolate names are shown in the same order as the lines for the npr1-1 mutant. The three Arabidopsis genotypes are wild-type Col-0 (red dot), JA-insensitive mutant coi1-1 (blue triangle), and SA mutant npr1-1 (brown diamond). The model-corrected means for transcript of PR1 are utilized for this plot. The transcript expression levels of PR1 across three Arabidopsis genotypes in control or induced by the same isolate are represented with colored connecting lines. Blue line indicates the expression levels of PR1 in the control treated samples. Purple lines indicate isolates where the expression levels of PR1 are higher in coi1-1 and npr1-1 than in Col-0. Black lines indicate isolates where the PR1 expression levels are higher in coi1-1 than in Col-0 but lower in npr1-1. Orange lines indicate isolates where the highest PR1 expression levels are in Col-0. The green line indicates an isolate with slightly higher PR1 expression levels in npr1-1 and slightly lower in coi1-1.
Figure 6.
Figure 6.
Gene Coexpression Networks Associated with Variation in Arabidopsis Transcriptomic Responses to Natural Genetic Variation in B. cinerea. The four core transcript networks as estimated both by PCA and correlation are shown with the suggested biological function determined by GO enrichment. These are as follows: Network I, JA and SA signaling processes and camalexin biosynthesis; Network III, defense and cell cycle; Networks II and IV, photosynthesis. Nodes within each network represent Arabidopsis transcripts. Purple nodes show transcripts encoded by the plastid genome. Red and yellow nodes represent biosynthetic genes for camalexin and tryptophan, respectively. Blue and orange nodes represent genes in the JA- and SA-signaling pathways, respectively. The interrelationship between the nodes within each network represents similarity between the expression levels of transcript. The similarity matrix is computed using Spearman’s rank correlation coefficient. The interrelationship between the genes within these networks is shown for the Arabidopsis genotypes wild-type Col-0 (A), JA-insensitive mutant coi1-1 (B), and SA-insensitive mutant npr1-1 (C).
Figure 7.
Figure 7.
PCA Comparison of Arabidopsis Transcriptomic Profiles Responding to Natural Genetic Variation in B. cinerea. Scatterplots show the scores of the first two principal components estimated using the response of the top 2000 transcripts responding to B. cinerea within the total data set using the mean response in Col-0. Red dots show the scores for the response to the individual isolates in Arabidopsis wild-type Col-0. Blue triangles show the response of coi1-1, and brown diamonds show the response of the SA-insensitive mutant npr1-1. Red, blue, and brown crosses represent the imputed score from mock treated samples from Col-0, coi1-1, and npr1-1, respectively. The 90% confidence ellipse intervals are drawn on scores of the first two principal components from each Arabidopsis genotype for reference.
Figure 8.
Figure 8.
Correlation between Lesion Area and Transcriptome Responses of Arabidopsis Genotypes. Scatterplots are shown comparing lesion area as measured at 72 HPI to the transcriptomic response at 16 HPI as measured using the first two principal components. The three Arabidopsis genotypes are wild-type Col-0 (red dot), JA-insensitive mutant coi1-1 (blue triangle), and SA mutant npr1-1 (brown diamond). Each point represents the model-corrected mean for each of the 96 isolates. The 90% confidence ellipse intervals are drawn for reference lesion area versus transcriptome PC1 (A) and lesion area versus transcriptome PC2 (B).
Figure 9.
Figure 9.
Differential Interactions of Host × Pathogen Genotype across Host Defense Responses. Rank plots showing the relationship of Arabidopsis defense responses across three host genotypes (x axis) in response to 96 diverse B. cinerea isolates. The three Arabidopsis genotypes are wild-type Col-0 (red dot), JA-insensitive mutant coi1-1 (blue triangle), and SA mutant npr1-1 (brown diamond). The model-corrected means for all traits are utilized for these plots. The connecting lines are colored in a gradient from green to purple based on their value in the Col-0 host genotype. (A) Lesion area at 72 HPI. (B) Camalexin accumulation at 72 HPI. (C) Transcriptome PC1 at 16 HPI. (D) Transcriptome PC2 at 16 HPI.

Similar articles

Cited by

References

    1. Alter O., Brown P.O., Botstein D. (2000). Singular value decomposition for genome-wide expression data processing and modeling. Proc. Natl. Acad. Sci. USA 97: 10101–10106. - PMC - PubMed
    1. An B., Li B., Qin G., Tian S. (2015). Function of small GTPase Rho3 in regulating growth, conidiation and virulence of Botrytis cinerea Fungal Genet. Biol. 75: 46–55. - PubMed
    1. Atwell S., Corwin J.A., Soltis N.E., Subedy A., Denby K.J., Kliebenstein D.J. (2015). Whole genome resequencing of Botrytis cinerea isolates identifies high levels of standing diversity. Front. Microbiol. 6: 996. - PMC - PubMed
    1. Bednarek P., Piślewska-Bednarek M., Ver Loren van Themaat E., Maddula R.K., Svatoš A., Schulze-Lefert P. (2011). Conservation and clade-specific diversification of pathogen-inducible tryptophan and indole glucosinolate metabolism in Arabidopsis thaliana relatives. New Phytol. 192: 713–726. - PubMed
    1. Benjamini Y., Hochberg Y. (1995). Controlling the false discovery rate: a practical and powerful approach to multiple testing. J. R. Stat. Soc. Ser. A Stat. Soc. 57: 289–300.

MeSH terms