. 2017 Nov;29(11):2801-2816.
doi: 10.1105/tpc.17.00645. Epub 2017 Oct 17.

Antagonistic Transcription Factor Complexes Modulate the Floral Transition in Rice

Affiliations

Antagonistic Transcription Factor Complexes Modulate the Floral Transition in Rice

Vittoria Brambilla et al. Plant Cell. 2017 Nov.

Abstract

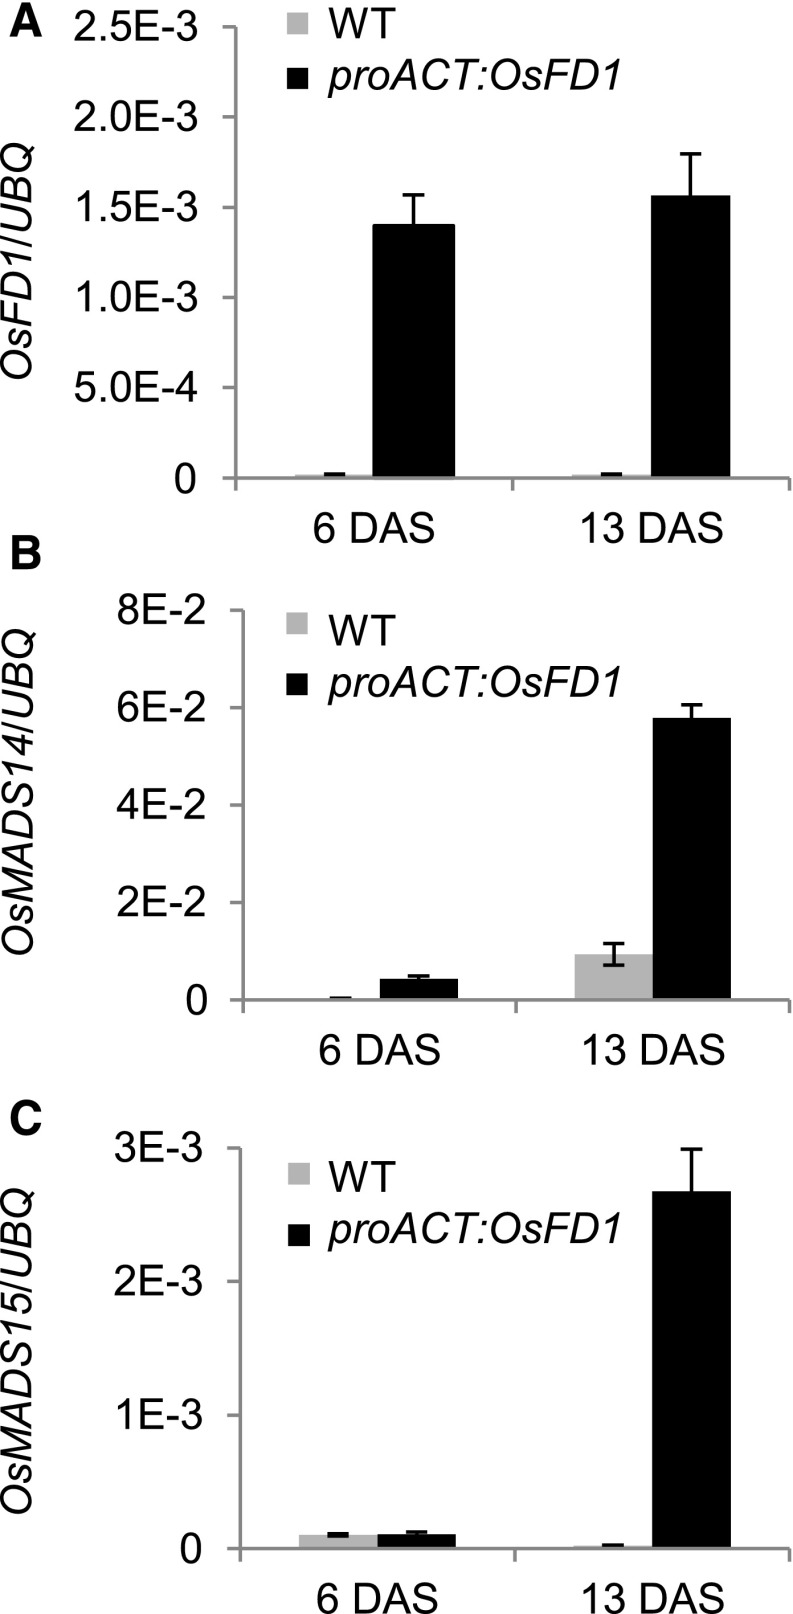
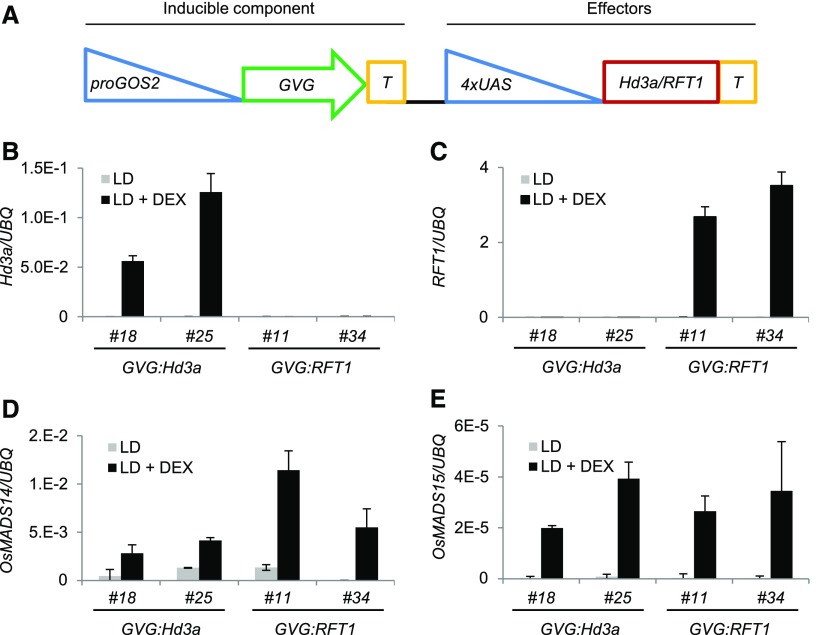
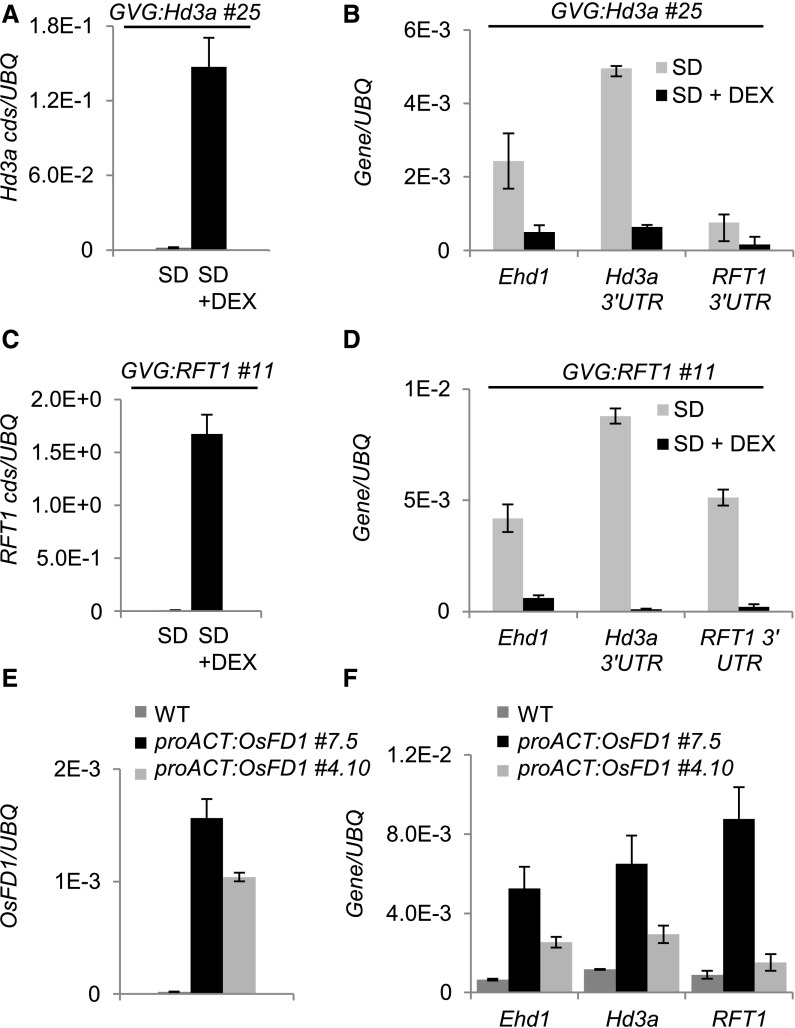
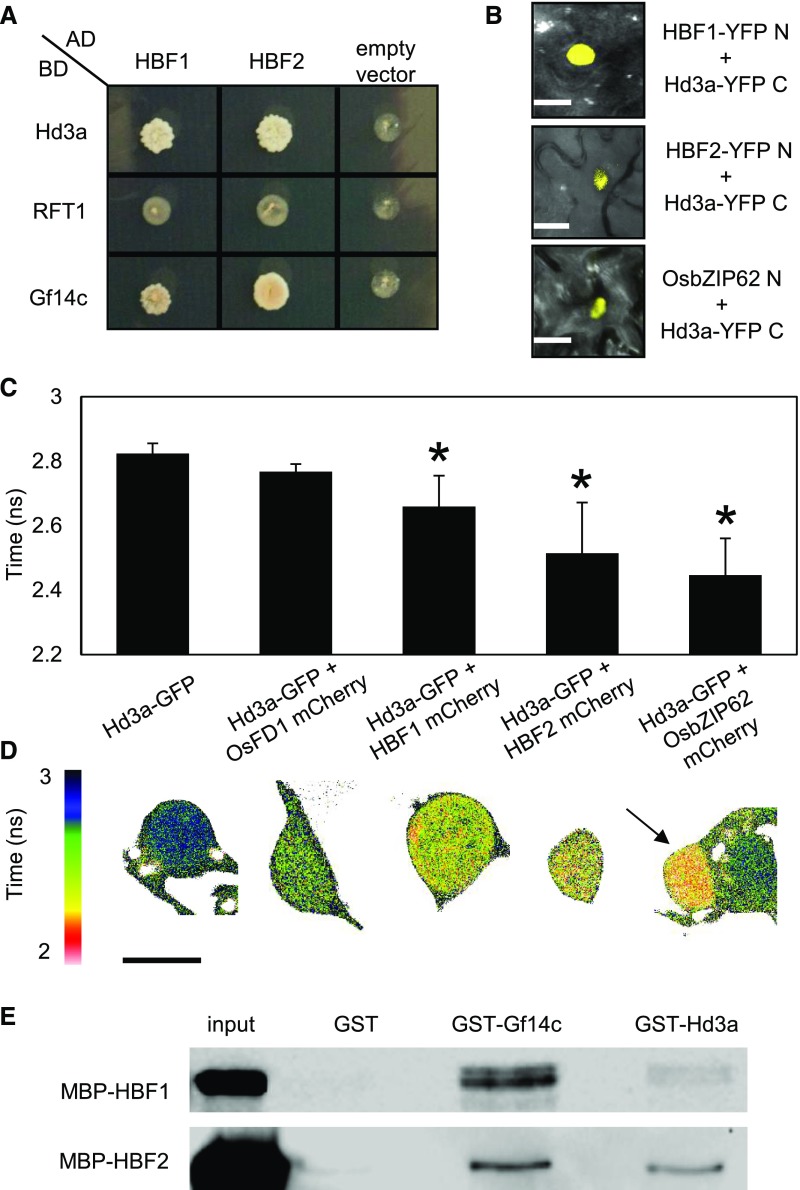
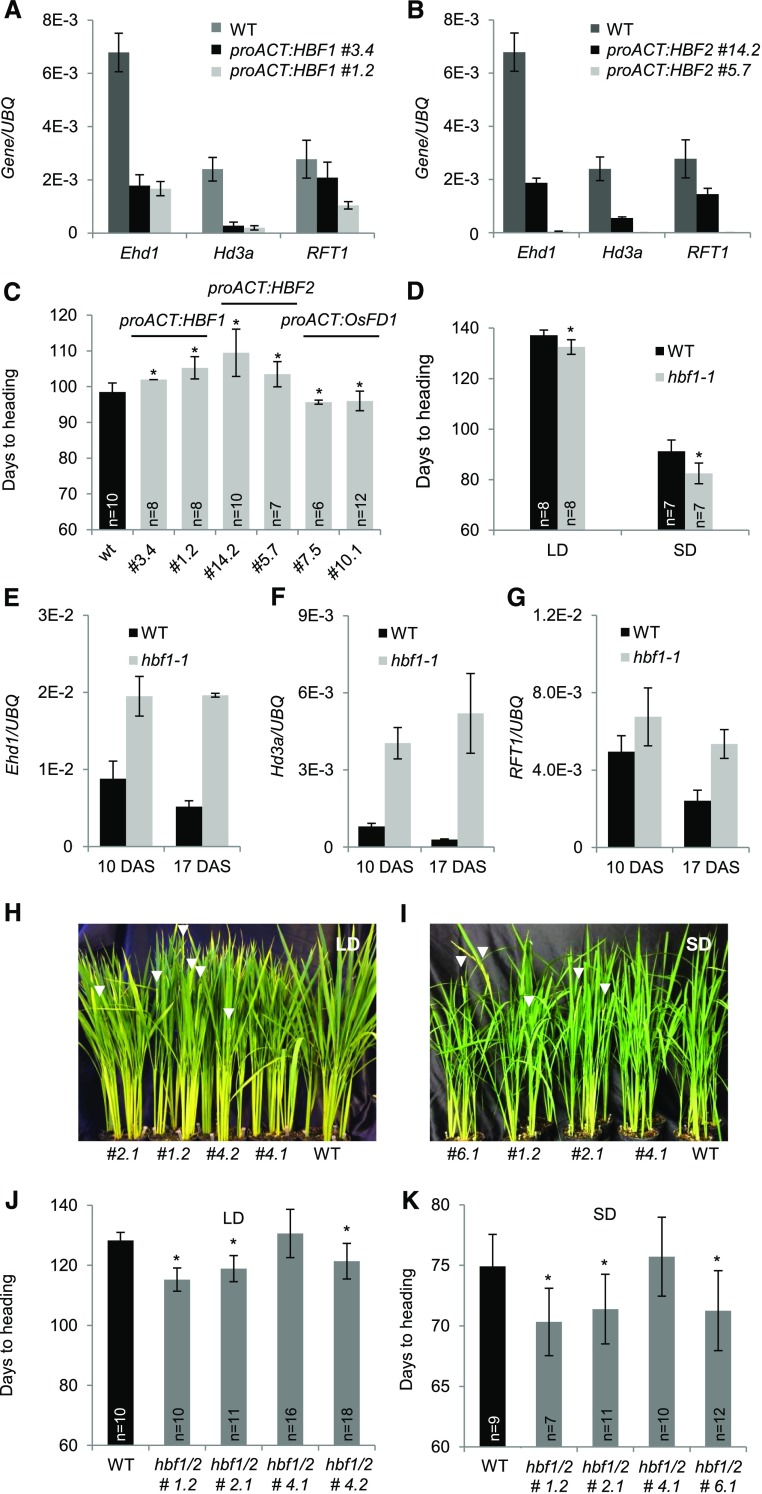
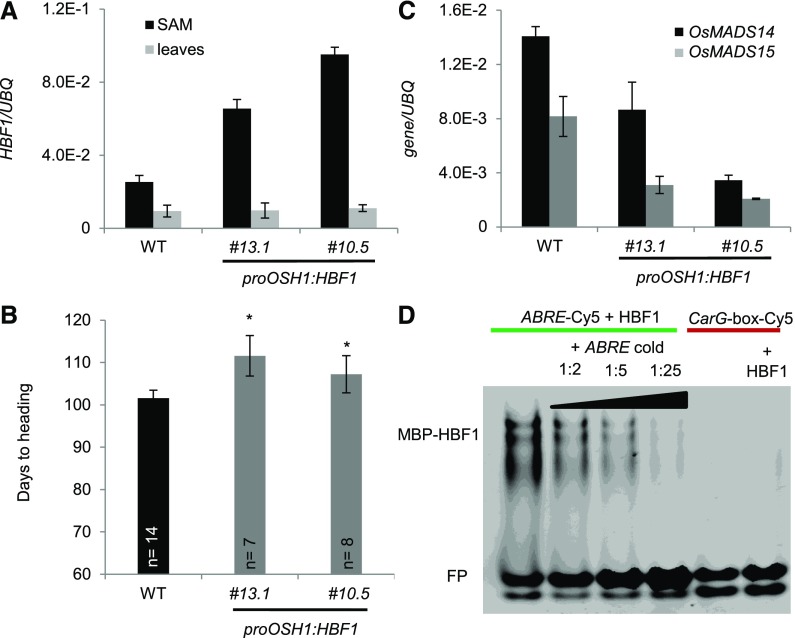
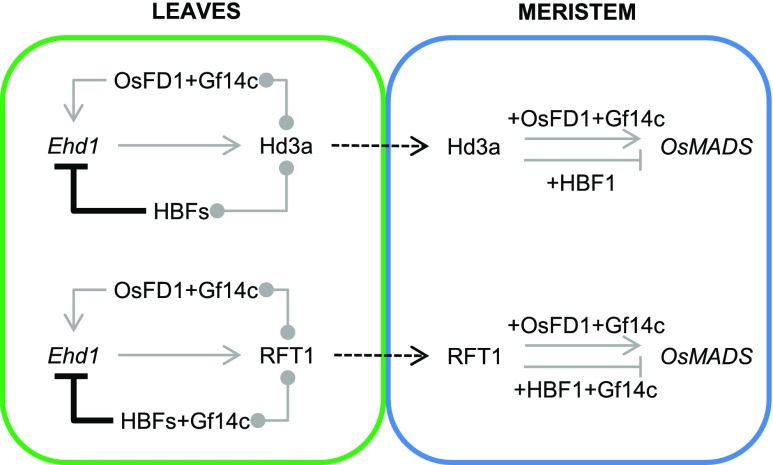
Plants measure day or night lengths to coordinate specific developmental changes with a favorable season. In rice (Oryza sativa), the reproductive phase is initiated by exposure to short days when expression of HEADING DATE 3a (Hd3a) and RICE FLOWERING LOCUS T 1 (RFT1) is induced in leaves. The cognate proteins are components of the florigenic signal and move systemically through the phloem to reach the shoot apical meristem (SAM). In the SAM, they form a transcriptional activation complex with the bZIP transcription factor OsFD1 to start panicle development. Here, we show that Hd3a and RFT1 can form transcriptional activation or repression complexes also in leaves and feed back to regulate their own transcription. Activation complexes depend on OsFD1 to promote flowering. However, additional bZIPs, including Hd3a BINDING REPRESSOR FACTOR1 (HBF1) and HBF2, form repressor complexes that reduce Hd3a and RFT1 expression to delay flowering. We propose that Hd3a and RFT1 are also active locally in leaves to fine-tune photoperiodic flowering responses.


Figures

Figure 1.
Figure 1.
Overexpression of OsFD1 in Leaves Induces Transcription of Targets of the FAC. Expression of OsFD1 (A), OsMADS14 (B), and OsMADS15 (C) in leaves of transgenic proACT:OsFD1 plants. Plants were grown under LD (14.5 h light) for 6 weeks and then shifted to SD (10 h light). Leaves were collected at ZT0 at 6 and 13 d after shift to SD (DAS). UBIQUITIN (UBQ) was used as standard for quantification of gene expression. Data are represented as mean ± sd. E-n = × 10−n. ANOVA tests for graphs in (A) to (C) are shown in Supplemental File 1.
Figure 2.
Figure 2.
Expression of OsMADS14 and OsMADS15 in Leaves Is Dependent on Expression of Hd3a and RFT1. (A) Schematics of the inducible system used in this study. The GVG chimeric protein is expressed under the GOS2 promoter to produce the inducible part of the vector. The Hd3a or RFT1 coding sequences are cloned under the control of the 4x UPSTREAM ACTIVATION SEQUENCE (UAS) to produce the effector component of the vector. T indicates the terminator. (B) to (E) Expression of Hd3a (B), RFT1 (C), OsMADS14 (D), and OsMADS15 (E) in leaves of DEX-inducible transgenic plants grown under LD. Leaves were harvested at ZT0. GVG:Hd3a and GVG:RFT1 indicate DEX-inducible Hd3a- and RFT1-overexpressing lines, respectively. Two independent transgenic lines are shown for each construct. Plants were either DEX- or mock-treated, and transcripts were quantified using primers designed on the coding sequences. UBQ was used as standard for quantification of gene expression. Data are represented as mean ± sd. xE-n = × 10−n. ANOVA tests for graphs in (B) to (E) are shown in Supplemental File 1.
Figure 3.
Figure 3.
A Negative Feedback Loop Independent of OsFD1 Reduces Ehd1, Hd3a, and RFT1 Expression during Floral Induction in Leaves. (A) to (D) DEX-induced overexpression of Hd3a ([A] and [B]) or RFT1 ([C] and [D]) causes strong increase of Hd3a (A) or RFT1 (C) transcript accumulation from transgenic sequences, but downregulation of Ehd1, Hd3a, and RFT1 endogenous transcripts, compared with mock-treated controls ([B] and [D]). (E) and (F) Two independent transgenic proACT:OsFD1 lines show increased expression of OsFD1 (E) and of Ehd1, Hd3a, and RFT1 in leaves compared with the wild type (F). DEX was applied at 13 DAS, and leaf samples were collected at ZT0, 16 h later. proACT:OsFD1 plants were collected at ZT0 and 12 DAS. Leaves from 10 plants per treatment were sampled. UBQ was used as standard for quantification of gene expression. Data are represented as mean ± sd. Primers on Hd3a or RFT1 coding sequences or on the 3′ untranslated regions were used to distinguish transgenic+endogenous ([A] and [C]) from endogenous transcripts, respectively ([B] and [D]). ANOVA tests for graphs in (A) to (F) are shown in Supplemental File 1.
Figure 4.
Figure 4.
HBF1 and HBF2 Interact with GF14c and Directly with Hd3a. (A) Yeast two-hybrid assays between Hd3a, RFT1, and Gf14c fused to the binding domain (BD) and HBF1 or HBF2 fused to the activation domain (AD) of Gal4. Colonies were grown on selective -L-W-H medium supplemented with 10 mM 3-aminotriazole. (B) BiFC assays showing restored YFP fluorescence in nuclei upon coexpression of Hd3a-YFP C with HBF1-YFP N, HBF2-YFP N, or OsbZIP62-YFP N. Bar = 10 μm. (C) FRET-FLIM measurements of the Hd3a-GFP donor lifetime in the presence of the acceptors OsFD1-mCherry (no FRET), HBF1-mCherry, HBF2-mCherry, or OsbZIP62-mCherry. The average lifetime of 10 transformed nuclei per measurement is shown ± sd. An asterisk indicates significance for P < 0.0003 (Student’s t test). ANOVA test for the graph is shown in Supplemental File 1. (D) Color code indicating the lifetime of GFP at each pixel in one representative nucleus for the interactions shown in (C). For the interaction between Hd3a and OsbZIP62 two adjacent cells are shown, where only the left nucleus (arrow) coexpresses both constructs, while the right one expresses only Hd3a-GFP. Accordingly, shortened lifetime is observed only in the left nucleus. (E) GST pull-down assay showing interactions between MBP-HBF1 and MBP-HBF2 with GST-Gf14c and GST-Hd3a, but not with GST alone. An immunoblot using an anti-MBP antibody is shown. Protein sizes are MBP-HBF1, 79.5 kD, and MBP-HBF2, 79.5 kD. Resin loading control is shown in Supplemental Figure 3E.
Figure 5.
Figure 5.
HBF1 and HBF2 Encode Floral Repressors Reducing Ehd1 Expression. (A) and (B) Quantification of mRNA levels of Ehd1, Hd3a, and RFT1 in leaves of proACT:HBF1 (A) and proACT:HBF2 (B) overexpression plants grown for 8 weeks under LD (16 h light) and then shifted to SD (10 h light). UBQ was used as standard for quantification of gene expression. Data are represented by mean ± sd. (C) Days to heading of wild type, proACT:HBF1, proACT:HBF2, and proACT:OsFD1 overexpressors grown for 8 weeks under LD (16 h light) and then shifted to SD (10 h light). (D) Heading dates of wild type (Dongjin) and hbf1-1 mutants grown under continuous LD (14.5 h light) or continuous SD (10 h light). (E) to (G) Expression of Ehd1 (E), Hd3a (F), and RFT1 (G) in hbf1-1 mutant plants compared with the wild type. (H) to (K) mRNA levels are shown at 10 and 17 d after shifting plants from LD to SD. (H) and (I) Nipponbare wild type and T2 hbf1 hbf2 CRISPR mutants grown under continuous LD (14.5 h light) (H) or shifted from LD (16 h light) to SD (10 h light) 8 weeks after sowing (I). Arrowheads indicate the emerging panicles. (J) and (K) Quantification of heading dates in the same plants as in (H) and (I), respectively (n indicates the number of plants scored). Asterisks indicate P < 0.05 in an unpaired two tailed Student’s t test. E-n = × 10−n. The detailed genotypes of the mutants are reported in Supplemental Figure 5C. ANOVA tests for graphs in (A) to (G), (J), and (K) are shown in Supplemental File 1.
Figure 6.
Figure 6.
HBF1 Represses Flowering at the SAM. (A) Quantification of HBF1 expression in SAMs and leaves of plants misexpressing HBF1 from the OSH1 promoter. Two independent transgenic lines are shown. (B) Heading dates of proOSH1:HBF1 transgenic plants grown for 8 weeks under LD (16 h light) and then shifted to SD (10 h light) (n indicates the number of plants scored). Asterisks indicate P < 0.05 in an unpaired two-tailed Student’s t test. (C) Quantification of OsMADS14 and OsMADS15 expression in SAMs of transgenic proOSH1:HBF1 plants. Samples in (A) and (C) were collected from apical meristems grown under LD and then exposed to 12 inductive SD. UBQ was used as standard for quantification of gene expression. All data are represented by mean ± sd. E-n = × 10−n. (D) Electrophoretic mobility shift assay between MBP-HBF1 and ABRE-Cy5 (lanes 1–4) and HBF1 and CArG-box-Cy5 (lane 6). The specificity of interaction between HBF1 and ABRE-Cy5 was tested by incubation with increasing amounts of unlabeled oligonucleotides (labeled/unlabeled oligonucleotide ratios 1:2, 1:5, and 1:25). HBF1 was incubated with an oligonucleotide containing a CArG-box-Cy5 (lanes 5 and 6) as a negative control. FP, free probe. ANOVA tests for graphs in (A) to (C) are shown in Supplemental File 1.
Figure 7.
Figure 7.
Combinatorial Circuitry Controlling Production of and Response to Florigenic Proteins in Rice. In leaves, Hd3a and RFT1 can promote expression of Ehd1 by forming a canonical FAC with OsFD1 and Gf14c, and they can repress it by interacting with HBFs. Hd3a can interact directly with HBFs, whereas RFT1 might interact indirectly with HBFs through GF14c. Binding of HBF1 to the Ehd1 promoter is direct. Upon translocation to the meristem, Hd3a and RFT1 proteins can promote transcription of OsMADS target genes by forming a canonical FAC. HBF1 at least can repress transcription of the same targets by forming a repressive FAC. Gray arrows and flat-end arrows indicate transcriptional activation and repression, respectively. Connectors indicate protein-protein interactions. Thick, black flat-end arrows indicate direct repression by protein-DNA binding. Dashed arrows indicate protein movement.

Similar articles

Cited by

References

    1. Abelenda J.A., Cruz-Oró E., Franco-Zorrilla J.M., Prat S. (2016). Potato StCONSTANS-like1 suppresses storage organ formation by directly activating the FT-like StSP5G repressor. Curr. Biol. 26: 872–881. - PubMed
    1. Andrés F., Coupland G. (2012). The genetic basis of flowering responses to seasonal cues. Nat. Rev. Genet. 13: 627–639. - PubMed
    1. Berezin M.Y., Achilefu S. (2010). Fluorescence lifetime measurements and biological imaging. Chem. Rev. 110: 2641–2684. - PMC - PubMed
    1. Bleckmann A., Weidtkamp-Peters S., Seidel C.A., Simon R. (2010). Stem cell signaling in Arabidopsis requires CRN to localize CLV2 to the plasma membrane. Plant Physiol. 152: 166–176. - PMC - PubMed
    1. Brambilla V., Fornara F. (2013). Molecular control of flowering in response to day length in rice. J. Integr. Plant Biol. 55: 410–418. - PubMed

MeSH terms