. 2017 Dec 4;216(12):3991-4005.
doi: 10.1083/jcb.201703168. Epub 2017 Oct 17.

RECQ-like helicases Sgs1 and BLM regulate R-loop-associated genome instability

Affiliations

RECQ-like helicases Sgs1 and BLM regulate R-loop-associated genome instability

Emily Yun-Chia Chang et al. J Cell Biol. .

Abstract

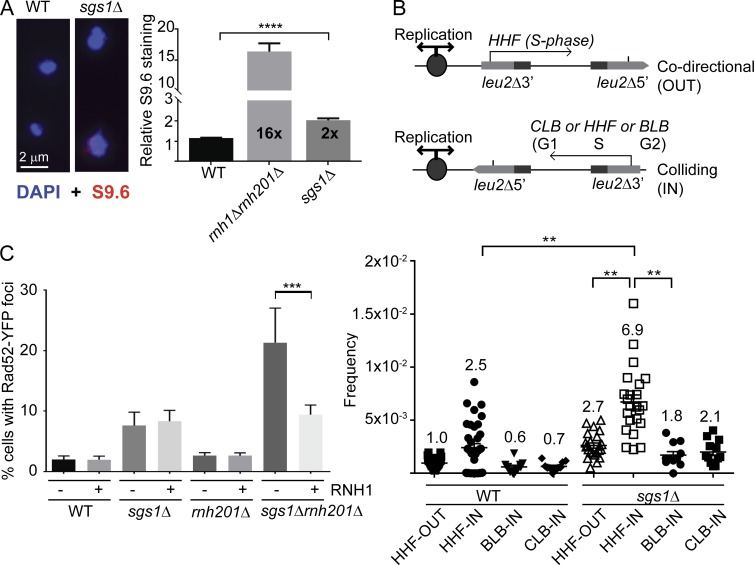
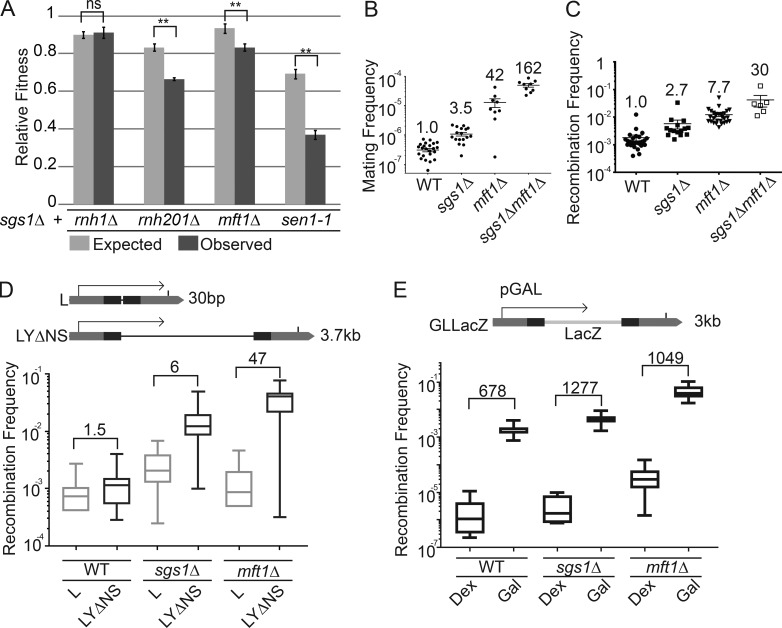
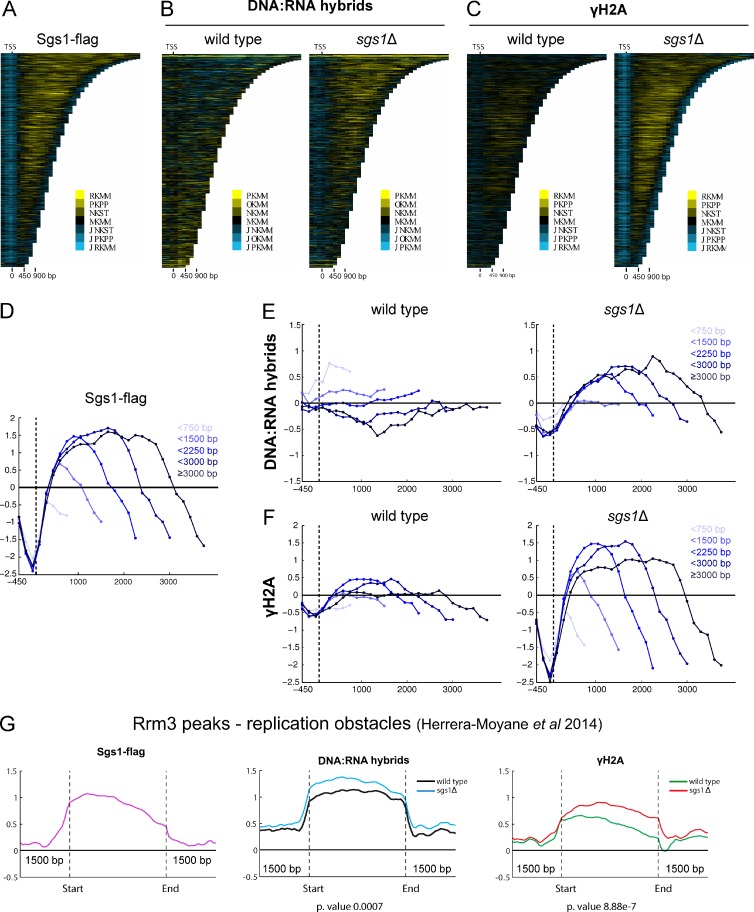
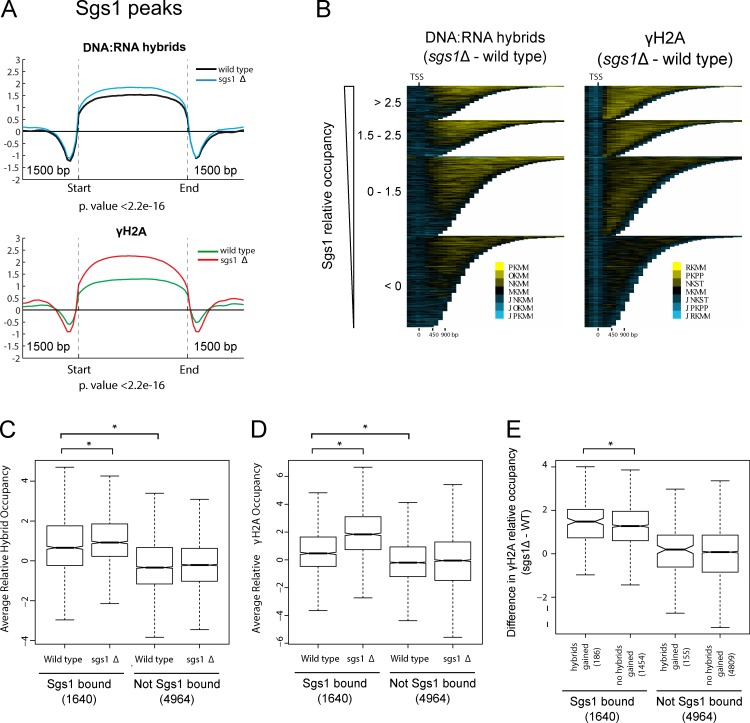
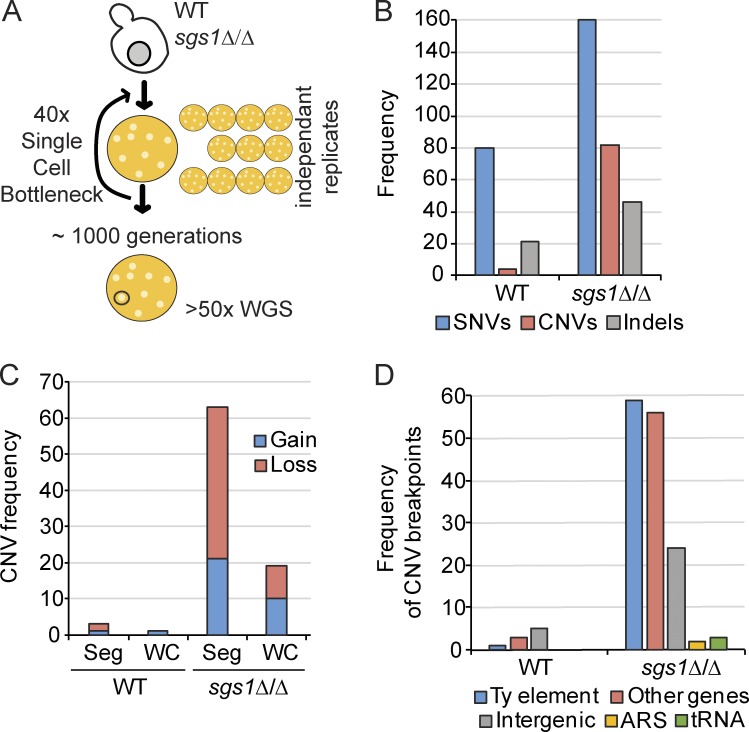
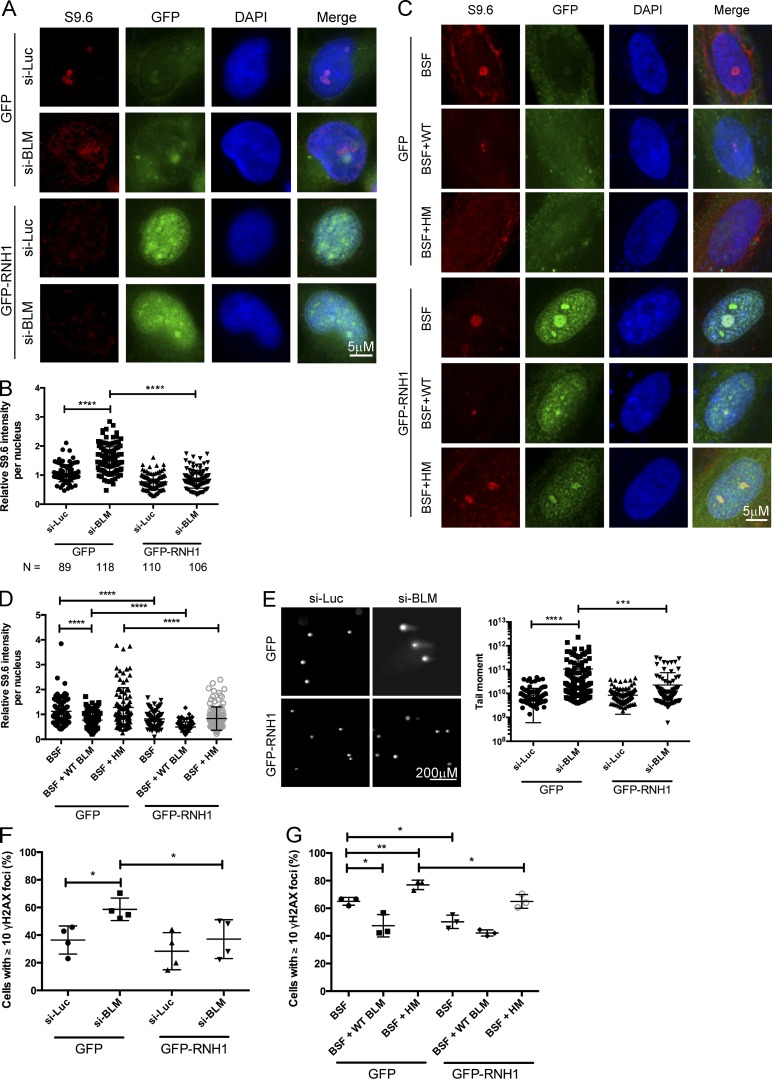
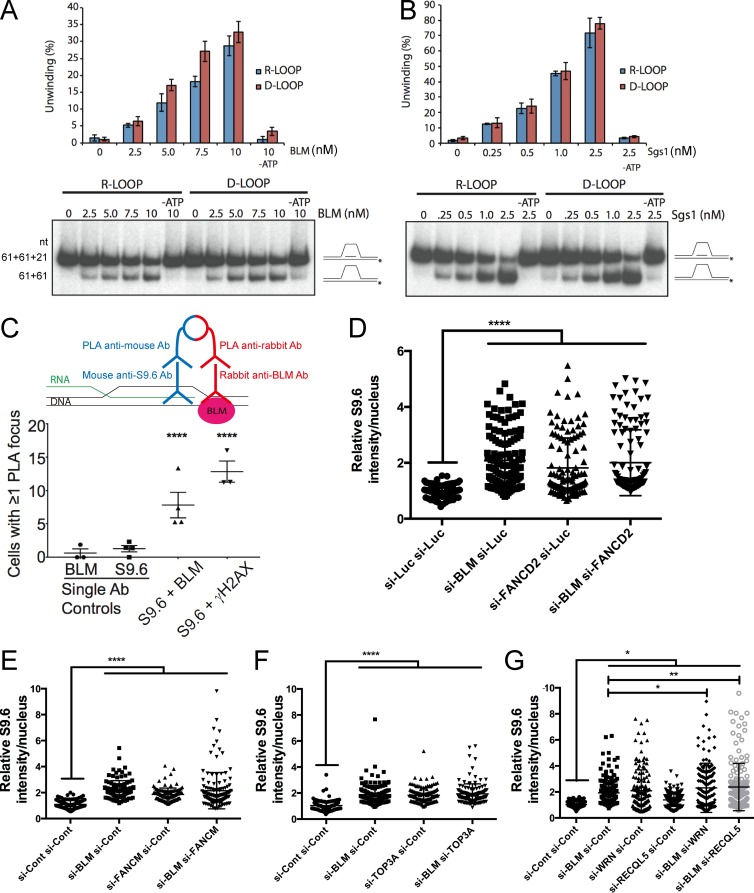
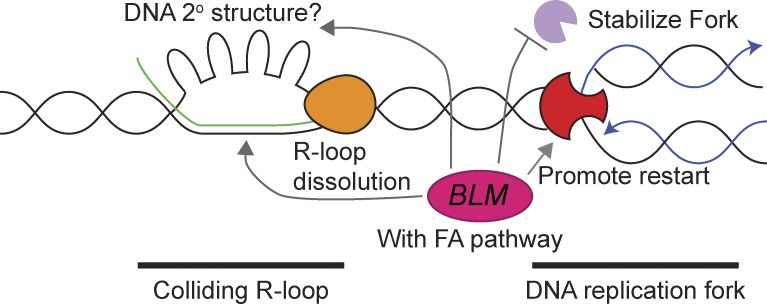
Sgs1, the orthologue of human Bloom's syndrome helicase BLM, is a yeast DNA helicase functioning in DNA replication and repair. We show that SGS1 loss increases R-loop accumulation and sensitizes cells to transcription-replication collisions. Yeast lacking SGS1 accumulate R-loops and γ-H2A at sites of Sgs1 binding, replication pausing regions, and long genes. The mutation signature of sgs1Δ reveals copy number changes flanked by repetitive regions with high R-loop-forming potential. Analysis of BLM in Bloom's syndrome fibroblasts or by depletion of BLM from human cancer cells confirms a role for Sgs1/BLM in suppressing R-loop-associated genome instability across species. In support of a potential direct effect, BLM is found physically proximal to DNA:RNA hybrids in human cells, and can efficiently unwind R-loops in vitro. Together, our data describe a conserved role for Sgs1/BLM in R-loop suppression and support an increasingly broad view of DNA repair and replication fork stabilizing proteins as modulators of R-loop-mediated genome instability.


Figures

Figure 1.
Figure 1.
Transcription–replication conflicts and R-loops in sgs1Δ cells. (A) S9.6 staining for DNA:RNA hybrids in yeast chromosome spreads (n = 4; for WT, rnh1Δrnh201Δ, and sgs1Δ, 616, 286, and 690 nuclei total were scored). Left, representative images; right, quantification of signal intensity per nucleus. Error bars represent SEM. Fold increase over WT is indicated in each bar. Bar, 2 µm. (B) Hyperrecombination caused by transcription–replication collisions. Top, schematics of transcription direction and cell cycle stage of each promoter are indicated. Bottom, quantification of recombination frequencies for the indicated strain and plasmid. Fold increases over WT +HHF-out are shown above each bar. 11 or more independent frequencies were measured for each sample. (C) DNA damage synergy in sgs1Δrnh201Δ is R-loop–dependent. Quantification of Rad52-YFP foci in the indicated strain with either an empty vector (−) or a Gal-inducible RNH1 (+) construct (n = 3). Error bars are SEM. **, P < 0.01; ***, P < 0.001; ****, P < 0.0001.
Figure 2.
Figure 2.
Cooperative genome maintenance by R-loop regulators and Sgs1. (A) Growth defects in strains lacking Sgs1 and the indicated gene. Quantitative growth curve analysis (n = 4 with technical triplicates in each experiment; error bars are SEM) showed observed fitness values were significantly lower than expected values. (B and C) Synergistic genome instability in SGS1, MFT1 double deletions. (B) Mating frequency as a measure of chromosome instability by the ALF assay. (C) Recombination frequency in the direct repeat plasmid system LNA (Prado et al., 1997). Fold increase over WT is shown above each measurement in the indicated strains. Error bars are SEM. (D and E) Plasmid-based LEU2 recombination frequency as a function of transcript length (D) and frequency (E). Above each panel is a schematic of the assay that measures recombination frequency, transcript length dependence, and transcript frequency dependence. For D, the length of the intervening sequence between the leu2 repeats (dark bars) is shown at right. The fold increase over WT is shown above each bar. The direction of transcription is indicated by an arrow. For E, Dex, dextrose (low expression); Gal, galactose (high expression). For D, n ≥ 14 and for E, n ≥ 6 independent frequencies were measured. Boxplots in D and E plot whiskers to the maximum and minimum values, with the box between the 25th and 75th percentile and the line at the median value.
Figure 3.
Figure 3.
The genomic binding profile of Sgs1 and the effect of SGS1 deletion on γ-H2A and R-loop occupancy. All profiles were generated in duplicate with quantile normalized and mean data shown here. (A, B, and C) Chromatra plots showing a heat map of Sgs1 (A), DNA:RNA hybrid (B), and γ-H2A (C) occupancy over protein coding genes sorted by length and aligned at the TSS (Hentrich et al., 2012). (D–F) Mean genome-wide Sgs1 (D), DNA:RNA hybrid (E), and γ-H2A (F) occupancy in WT (left) and sgs1Δ (right) as a function of gene length. A total of 4,868 genes were split into the indicated gene length categories (538 genes < 750 bp, 1,861 genes < 1,500 bp, 1,263 genes < 2,250 bp, 636 genes < 3,000 bp, and 570 genes ≤ 3,000 bp) with mean enrichment scores calculated and plotted for each category. We observed Sgs1 binding and increase in DNA:RNA hybrid and γ-H2A levels in the sgs1Δ mutant compared with WT at longer genes. Mean values and statistics are reported in the Results section. (G) Mean Sgs1 (left), DNA:RNA hybrid (center), and γ-H2A (right) occupancy across previously identified Rrm3 peaks (Herrera-Moyano et al., 2014) for the indicated strains. Two-sided Wilcox test p-values comparing mean occupancy scores in sgs1Δ versus WT are noted below.
Figure 4.
Figure 4.
Intersection of Sgs1, R-loops and DNA damage. All profiles were generated in duplicate with quantile normalized and averaged data shown here. (A) Mean DNA:RNA hybrid (top) and γ-H2A (bottom) occupancy across Sgs1-binding sites for the indicated strains. Two-sided Wilcox test p-value comparing mean occupancy scores in sgs1Δ versus WT is noted below. (B) Chromatra plots showing a heat map of the difference in DNA:RNA hybrid (left) and γ-H2A (right) occupancy in sgs1Δ compared with WT. Protein coding genes are sorted by length and Sgs1 occupancy and aligned at the TSS (Hentrich et al., 2012). (C and D) Box plots comparing mean occupancy scores of DNA:RNA hybrids (C) and γ-H2A (D) in WT and the sgs1Δ mutant at Sgs1-bound versus not bound ORFs. *, P < 0.05, for two-tailed Wilcox tests. The numbers of genes in each category are shown in brackets. All other comparisons are not significant. (E) Box plot showing increases in γ-H2A levels at genes that are bound by Sgs1 and that gain DNA:RNA hybrids upon loss of SGS1 compared with those that do not gain hybrids. *, P < 0.05, for one-tailed Wilcox test. The numbers of genes in each category are shown in brackets. Changes in γ-H2A were not observed when genes that gained hybrids but were not bound to Sgs1 were compared with those that have neither hybrids nor Sgs1 association. The whiskers on boxplots in C–E represent 1.5× the interquartile range.
Figure 5.
Figure 5.
The mutation spectrum of SGS1-deficient yeast. (A) Schematic of the 1,000 generation mutation accumulation approach (Segovia et al., 2017). 12 independent lines for each condition were generated and sequenced. WGS, whole genome sequencing. (B) Frequency of SNVs, CNVs, and insertions and deletions (indels) in mutation accumulation lines of the indicated strains. (C) CNV breakpoint classes in mutation accumulation lines. Seg, segmental copy number change; WC, whole chromosome aneuploidy. (D) CNV breakpoint characteristics in mutation accumulation lines. ARS, autonomously replicating sequences (DNA replication origins). For more detailed information, see Table S2.
Figure 6.
Figure 6.
R-loop accumulation and DNA damage in BLM-depleted cells. (A and C) Representative images of S9.6 staining in HeLa cells treated with the indicated siRNA targeted for BLM (si-BLM) or a control luciferase (si-Luc; A) or Bloom’s syndrome fibroblasts complemented with an empty vector control (BSF), WT BLM (BSF + WT), or helicase dead mutant (BSF + HM; C). Cells were transfected with either a control vector (GFP) or one expressing GFP-RNaseH1. (B and D) Quantification of S9.6 signal intensity for nuclear area in the indicated conditions in HeLa cells (B) or Bloom’s syndrome fibroblasts (D). Cell numbers scored across three independent replicates are noted below panel B for HeLa cells. (E) RNaseH-dependent DNA breaks in BLM-deficient HeLa cells. (Left) Representative comet tail images from single-cell electrophoresis. (Right) Quantification of comet tail moment under the indicated conditions. t tests were used for comparisons shown. (F and G) Percentages of cells with ≥10 γ-H2AX foci in HeLa cells treated with indicated siRNA expressing GFP or GFP-RNaseH1 (F) or Bloom’s syndrome fibroblasts expressing GFP or GFP-RNaseH1 (G). *, P < 0.05; **, P < 0.01; ***, P < 0.001; ****, P < 0.0001.
Figure 7.
Figure 7.
Potential mechanism of BLM-dependent R-loop mitigation. Comparative R-loop and D-loop unwinding by BLM (A) and Sgs1 (representive gel shown of three separate experiments is shown; error bars are SEM; B). Schematics of the slow migrating oligonucleotide loop substrate and faster migrating product are shown at right and nucleotide (nt) sizes are listed to the left of A. Protein concentrations used are listed above. Quantification of unwinding efficiency is shown in the graph. (C) Proximity ligation of BLM and DNA:RNA hybrids in cells. A schematic of PLA (above) shows that signal only emerges when two epitopes (DNA:RNA and BLM) are close enough to ligate oligonucleotides conjugated to secondary antibodies (Ab). S9.6 and γ-H2AX were previously associated in cells using PLA and serve as a positive control (Stork et al., 2016). Cells with any fluorescence signal were scored as positive. Pooled count data for single primary antibody controls and dual antibody PLA reactions were compared using a Fisher’s exact test. (D–G) Nuclear S9.6 staining data for the indicated siRNA treatments. Dot plots show the range of values quantified. Western blots to confirm double knockdown efficiency are shown in Fig. S3. P-values were determined by ANOVA with Sidak’s multiple comparisons test post hoc. *, P < 0.05; **, P < 0.01; ****, P < 0.0001.
Figure 8.
Figure 8.
Model of Sgs1/BLM impact on R-loops. Shown are a replication fork (red) heading toward a stalled RNA polymerase (orange) and associated R-loop. Possible roles for BLM/Sgs1 at these sites are highlighted with arrows and discussed in the Discussion section.

Similar articles

Cited by

References

    1. Ang J.S., Duffy S., Segovia R., Stirling P.C., and Hieter P.. 2016. Dosage Mutator Genes in Saccharomyces cerevisiae: A Novel Mutator Mode-of-action of the Mph1 DNA Helicase. Genetics. 204:975–986. 10.1534/genetics.116.192211 - DOI - PMC - PubMed
    1. Ashton T.M., and Hickson I.D.. 2010. Yeast as a model system to study RecQ helicase function. DNA Repair (Amst.). 9:303–314. 10.1016/j.dnarep.2009.12.007 - DOI - PubMed
    1. Bhatia V., Barroso S.I., García-Rubio M.L., Tumini E., Herrera-Moyano E., and Aguilera A.. 2014. BRCA2 prevents R-loop accumulation and associates with TREX-2 mRNA export factor PCID2. Nature. 511:362–365. 10.1038/nature13374 - DOI - PubMed
    1. Blackford A.N., Nieminuszczy J., Schwab R.A., Galanty Y., Jackson S.P., and Niedzwiedz W.. 2015. TopBP1 interacts with BLM to maintain genome stability but is dispensable for preventing BLM degradation. Mol. Cell. 57:1133–1141. 10.1016/j.molcel.2015.02.012 - DOI - PMC - PubMed
    1. Böhm S., and Bernstein K.A.. 2014. The role of post-translational modifications in fine-tuning BLM helicase function during DNA repair. DNA Repair (Amst.). 22:123–132. 10.1016/j.dnarep.2014.07.007 - DOI - PMC - PubMed

MeSH terms

Grants and funding