. 2017 Dec 1;292(48):19905-19918.
doi: 10.1074/jbc.M117.817510. Epub 2017 Oct 17.

Autophagy induction under carbon starvation conditions is negatively regulated by carbon catabolite repression

Affiliations

Autophagy induction under carbon starvation conditions is negatively regulated by carbon catabolite repression

Atsuhiro Adachi et al. J Biol Chem. .

Abstract

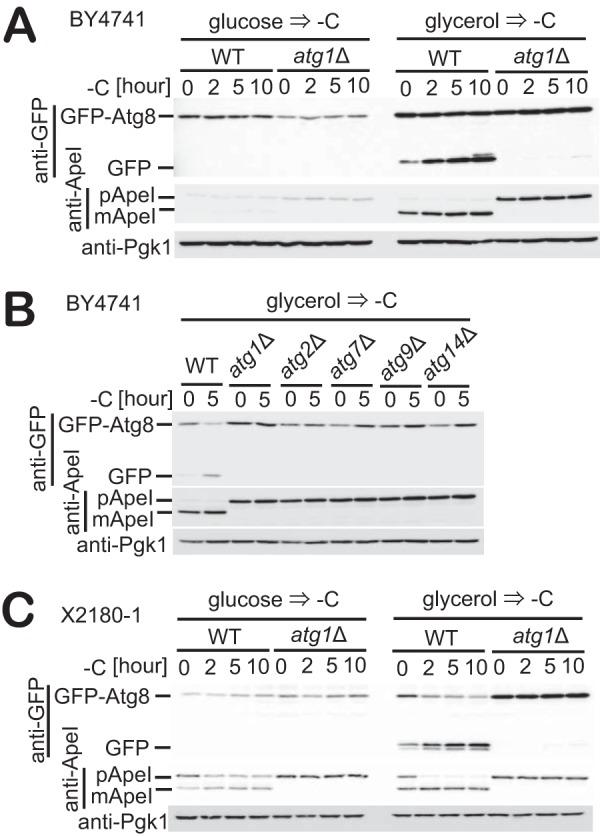
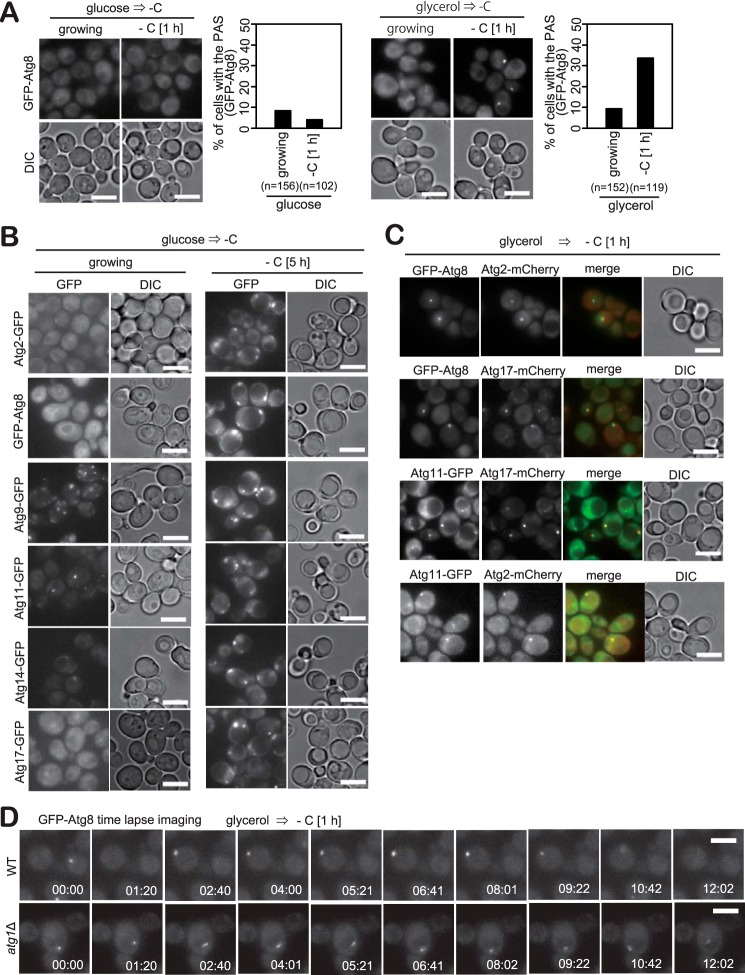
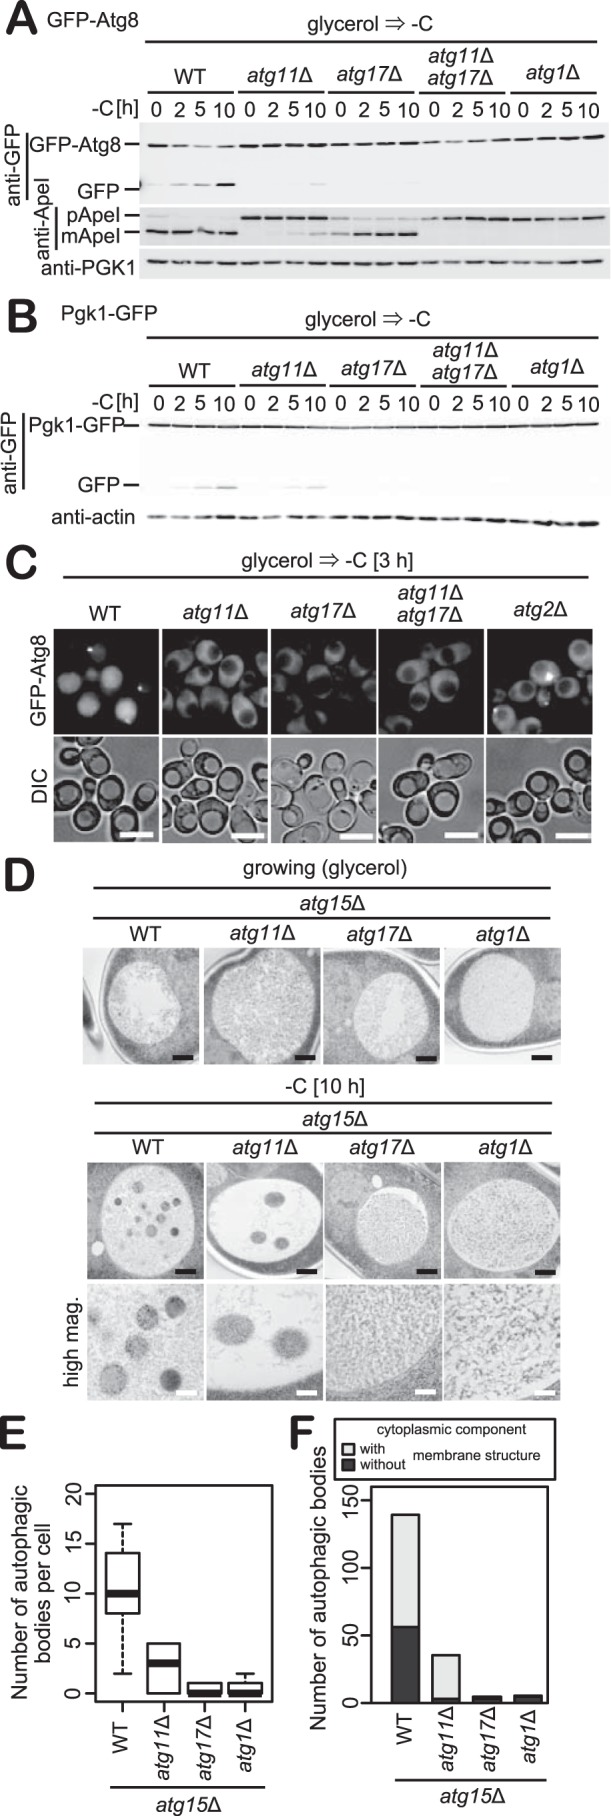
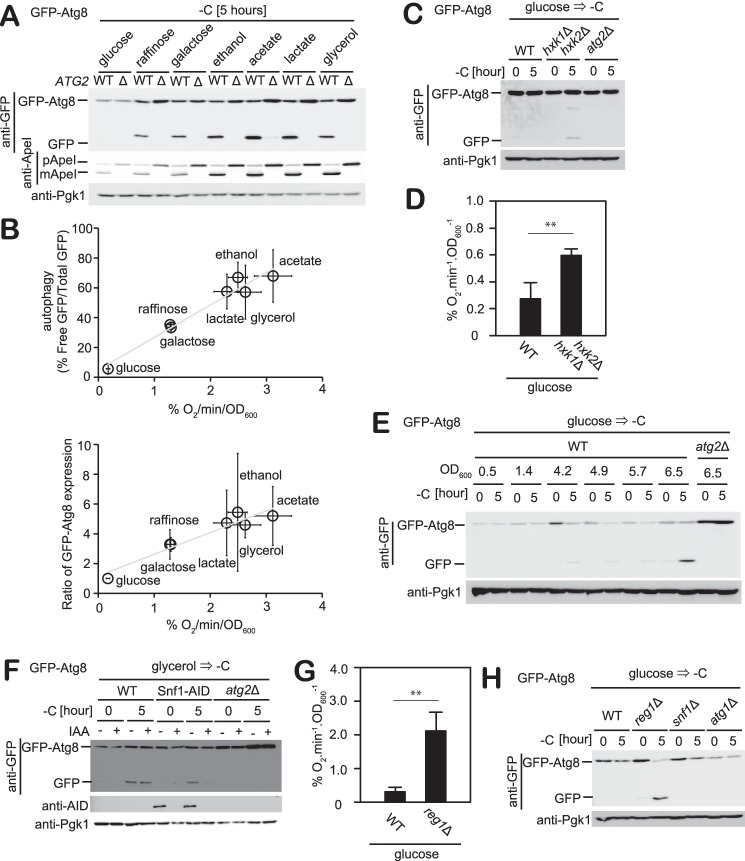
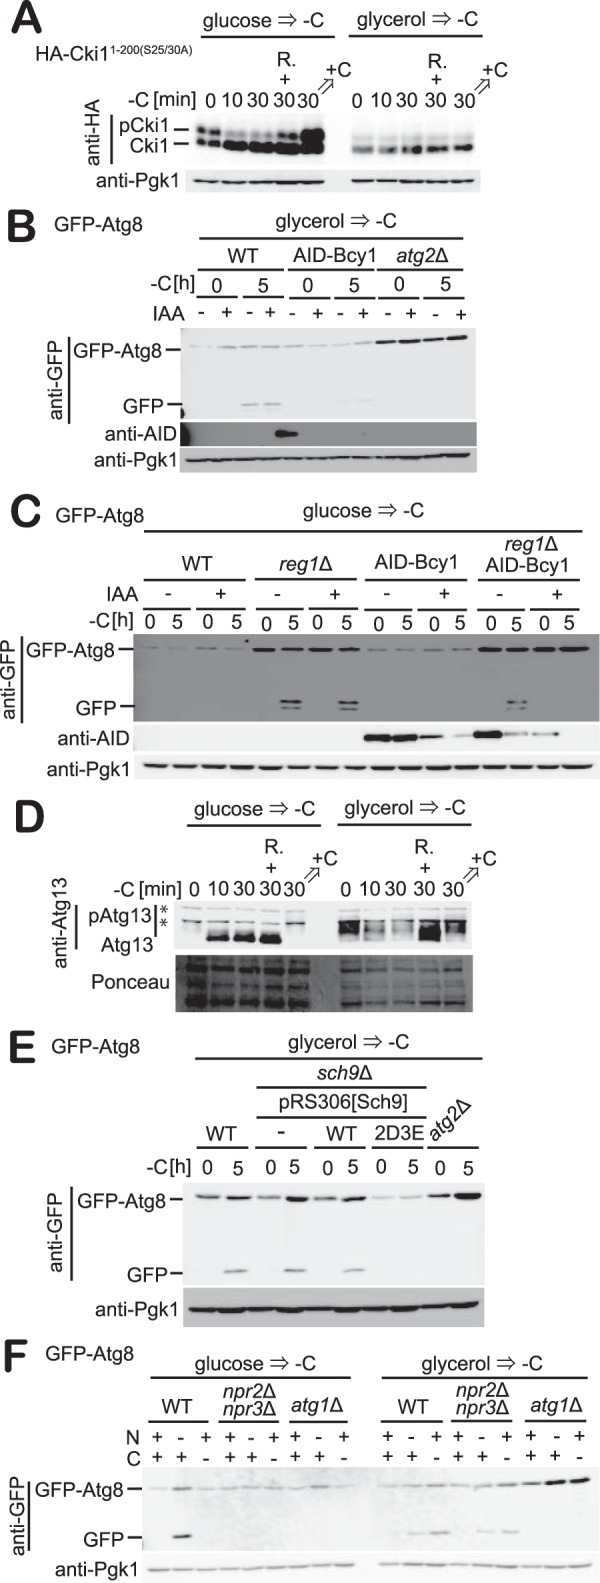
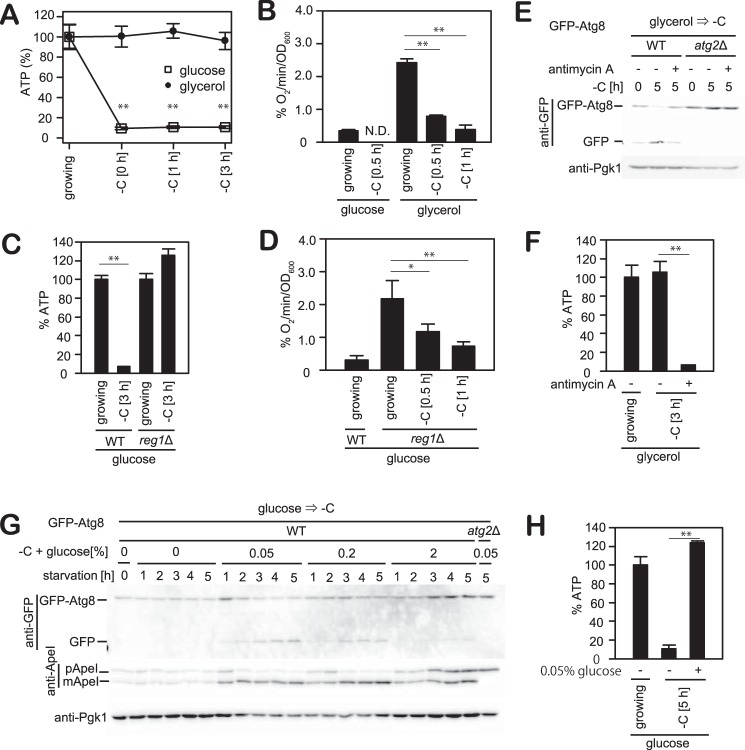
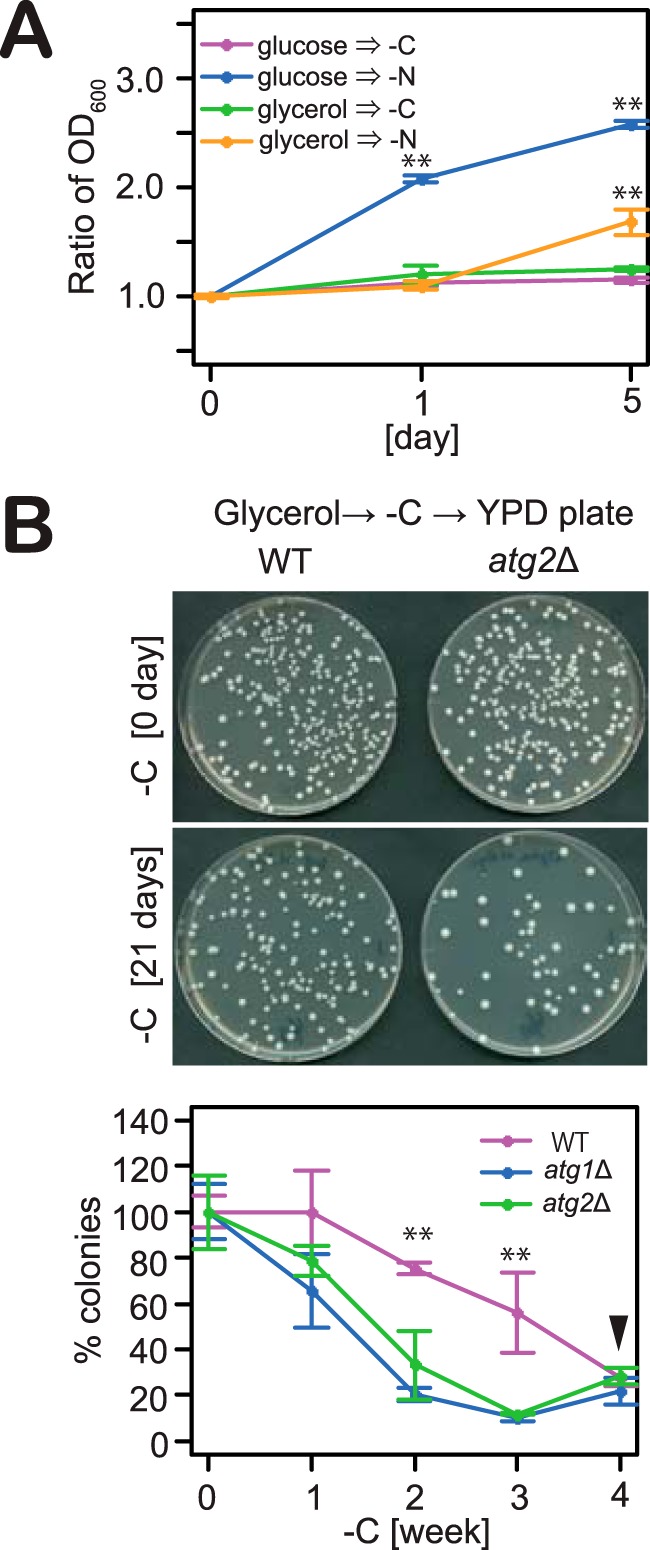
Autophagy is a conserved process in which cytoplasmic components are sequestered for degradation in the vacuole/lysosomes in eukaryotic cells. Autophagy is induced under a variety of starvation conditions, such as the depletion of nitrogen, carbon, phosphorus, zinc, and others. However, apart from nitrogen starvation, it remains unclear how these stimuli induce autophagy. In yeast, for example, it remains contentious whether autophagy is induced under carbon starvation conditions, with reports variously suggesting both induction and lack of induction upon depletion of carbon. We therefore undertook an analysis to account for these inconsistencies, concluding that autophagy is induced in response to abrupt carbon starvation when cells are grown with glycerol but not glucose as the carbon source. We found that autophagy under these conditions is mediated by nonselective degradation that is highly dependent on the autophagosome-associated scaffold proteins Atg11 and Atg17. We also found that the extent of carbon starvation-induced autophagy is positively correlated with cells' oxygen consumption rate, drawing a link between autophagy induction and respiratory metabolism. Further biochemical analyses indicated that maintenance of intracellular ATP levels is also required for carbon starvation-induced autophagy and that autophagy plays an important role in cell viability during prolonged carbon starvation. Our findings suggest that carbon starvation-induced autophagy is negatively regulated by carbon catabolite repression.

Keywords: ATP; autophagy; energy metabolism; glucose; yeast.


Conflict of interest statement

The authors declare that they have no conflicts of interest with the contents of this article

Figures

Figure 1.
Figure 1.
Autophagy is induced in glycerol-grown cells in response to carbon starvation. A, WT and atg1Δ cells expressing GFP-Atg8 grown in glucose or glycerol medium were subjected to carbon starvation. The cleavage of GFP-Atg8 and Ape1 maturation at the indicated time was assessed by immunoblotting with antibodies against GFP, Ape1, and Pgk1. Pgk1 was used as a loading control. B, WT, atg1Δ, atg2Δ, atg7Δ, atg9Δ, or atg14Δ cells expressing GFP-Atg8 grown in glycerol medium were subjected to carbon starvation. Immunoblotting was performed as described in A. C, WT or atg1Δ cells expressing GFP-Atg8 grown in glucose or glycerol medium were exposed to carbon starvation. Immunoblotting was performed as described in A.
Figure 2.
Figure 2.
Behavior of Atg proteins under carbon starvation. A, cells expressing GFP-Atg8 grown in glucose or glycerol medium were exposed to carbon starvation for 1 h before fluorescence images were acquired. The number of cells with the PAS (GFP-Atg8) was counted, and their percentages relative to the total numbers of cells are shown. B, cells expressing Atg2-GFP, GFP-Atg8, Atg9-GFP, Atg11-GFP, Atg14-GFP, or Atg17-GFP grown in glucose medium were exposed to carbon starvation for 5 h, and fluorescence images were then acquired. C, cells expressing GFP-Atg8 and Atg2-mCherry, GFP-Atg8 and Atg17-mCherry, Atg11-GFP and Atg17-mCherry, or Atg11-GFP and Atg2-mCherry were grown in glycerol medium and exposed to carbon starvation for 1 h before fluorescence microscopy. D, WT and atg1Δ cells expressing GFP-Atg8 grown in glycerol medium were exposed to carbon starvation. Then, fluorescence images were acquired every 20 s at 0.-μm step increments. The Z-slices were stacked. Scale bar, 5 μm.
Figure 3.
Figure 3.
Carbon starvation–induced autophagy is highly dependent on Atg11. A and B, WT, atg11Δ, atg17Δ, atg11Δatg17Δ, or atg2Δcells expressing GFP-Atg8 or Pgk1-GFP grown in glycerol medium were exposed to carbon starvation. The cleavage of GFP-Atg8 or Pgk1-GFP and the Ape1 maturation were analyzed by immunoblotting with antibodies against GFP, Ape1, and Pgk1. Pgk1 or actin was used as a loading control. C, WT, atg11Δ, atg17Δ, atg11Δatg17Δ, or atg2Δ cells expressing GFP-Atg8 grown in glycerol medium were exposed to carbon starvation for 3 h before fluorescence microscopy. Scale bars, 5 μm. D, atg15Δ, atg15Δatg11Δ, and atg15Δatg1Δcells grown in glycerol medium were exposed to carbon starvation for 10 h. Images were acquired by transmission electron microscopy. Black bars, 500 nm; white bars, 200 nm. E, box plot of the number of autophagic bodies per cell in images obtained under the same conditions as shown in D. Whiskers indicate highest and lowest values, the top and bottom of the box represent upper and lower quartiles, respectively, and the central line indicates the median of data. n = 13 (WT, atg11Δ) or 12 (atg17Δ, atg1Δ). F, bars indicate total number of autophagic bodies containing cytoplasmic components with or without membrane structures in D.
Figure 4.
Figure 4.
Extent of autophagy in response to carbon starvation is highly correlated with oxygen consumption rate. A, WT and atg2Δ cells expressing GFP-Atg8 grown in the presence of indicated carbon sources were exposed to carbon starvation for 5 h. The cleavages of GFP-Atg8 and Ape1 maturation were analyzed by immunoblotting with antibodies against GFP, Ape1, and Pgk1. Pgk1 was used as a loading control. B, oxygen consumption rate in cells grown in indicated carbon sources was measured. A correlation between oxygen consumption and autophagy activity (upper) or Atg8 protein level (lower) is shown. Extent of autophagy was shown as the ratios of free GFP band intensities and total GFP ones (GFP-Atg8 and free GFP) acquired from A. Error bars denote S.D. C, WT, hxk1Δhxk2Δ. or atg2Δ cells expressing GFP-Atg8 grown in glucose were exposed to carbon starvation for 5 h. Immunoblotting was performed as described in A. D, oxygen consumption rate in WT or hxk1Δhxk2Δ cells grown in glucose medium was measured. Error bars denote S.D. **, p < 0.05 by Student's t test. E, WT and atg2Δ cells expressing GFP-Atg8 grown in glucose at the indicated cell densities were exposed to carbon starvation for 5 h. Immunoblotting was performed as described in A. F, WT, Snf1-AID, or atg2Δ cells expressing GFP-Atg8 grown in glycerol medium were treated with IAA for 30 min before being subjected to carbon starvation for 5 h. Immunoblotting was performed as described in A. G, oxygen consumption rate in WT or reg1Δ cells grown in glucose medium was measured. Error bars denote S.D. **, p < 0.05 by Student's t test. H, WT, reg1Δ, snf1Δ, or atg1Δ cells expressing GFP-Atg8 grown in glucose medium were exposed to carbon starvation for 5 h. Immunoblotting was performed as described in A.
Figure 5.
Figure 5.
Activation of PKA or Torc1 suppresses carbon starvation–induced autophagy. A, cells expressing HA-Cki11–200(S25A/S30A) grown in glucose or glycerol medium were subjected to carbon starvation. Phosphorylation was analyzed by immunoblotting with antibodies against HA. R denotes addition of rapamycin. +C denotes addition of carbon source. B, WT, AID-Bcy1, or atg2Δ cells expressing GFP-Atg8 grown in glycerol medium were treated with IAA for 1 h and exposed to carbon starvation for 5 h. The cleavages of GFP-Atg8 at the indicated time were analyzed by immunoblotting with antibodies against GFP, Ape1, AID, and Pgk1. Pgk1 was used as a loading control. C, WT, reg1Δ, AID-Bcy1, or reg1ΔAID-Bcy1 cells expressing GFP-Atg8 grown in glucose medium were treated with IAA for 1 h and exposed to carbon starvation for 5 h. Immunoblotting was performed as described in B. D, cells grown in glucose or glycerol medium were exposed to carbon starvation. The phosphorylation status of Atg13 was analyzed by immunoblotting with antibodies against Atg13. R denotes addition of rapamycin. +C denotes addition of carbon source. E, WT, sch9Δ, atg2Δ, sch9Δ harboring plasmids for Sch9(WT) or Sch9(2D3E) cells expressing GFP-Atg8 grown in glycerol medium were exposed to carbon starvation for 5 h. Immunoblotting was performed as described in B. F, WT, npr2Δnpr3Δ, or atg1Δ cells expressing GFP-Atg8 grown in glucose or glycerol medium were exposed to carbon or nitrogen starvation for 5 h. Immunoblotting was performed as described in A.
Figure 6.
Figure 6.
Intracellular ATP level is correlated with autophagy induction in response to carbon starvation. A and B, WT cells grown in glucose or glycerol medium were exposed to carbon starvation. Intracellular ATP or oxygen consumption rates were measured. Error bars denote S.D. **, p < 0.05 by Student's t test (n = 3). C and D, WT or reg1Δ cells were grown in glucose medium and exposed to carbon starvation. Intracellular ATP or oxygen consumption rates were measured. Error bars denote S.D. **, p < 0.05; *, p < 0.5 by Student's t test (n = 3). E, WT and atg2Δ cells expressing GFP-Atg8 grown in glycerol medium were exposed to carbon starvation in the presence of antimycin A (5 μm) for 5 h. The cleavage of GFP-Atg8 was analyzed by immunoblotting with antibodies against GFP and Pgk1. Pgk1 was used as a loading control. F, cells grown in glycerol medium were exposed to carbon starvation with antimycin A (5 μm) for 3 h. Intracellular ATP level was measured. Error bars denote S.D. **, p < 0.05 by Student's t test (n = 3). G, WT and atg2Δ cells expressing GFP-Atg8 grown in glucose medium were shifted to medium containing indicated concentrations of glucose. The GFP-Atg8 and Ape1 maturation were analyzed by immunoblotting with antibodies against GFP, Ape1, and Pgk1. Pgk1 was used as a loading control. H, cells grown in glucose medium were shifted to medium containing 0.05% glucose. Intracellular ATP level was measured. Error bars denote S.D. **, p < 0.05 by Student's t test (n = 3).
Figure 7.
Figure 7.
Autophagy induction is required for the maintenance of homeostasis during carbon starvation. A, cells grown in glucose or glycerol medium were exposed to nitrogen or carbon starvation, and A600 values were measured. Error bars denote S.D. **, p < 0.05 by Student's t test (n = 3). B, WT, atg1Δ, and atg2Δ cells grown in glycerol medium were exposed to carbon starvation. At indicated time cultures were diluted 1 × 10⁵-fold and plated onto YPD agar. The plates were incubated at 30 °C for 4 days. The number of colonies on plates was counted. Error bars denote S.D. **, p < 0.05 by Student's t test (n = 3). Arrowhead indicates culture re-growth (“gasping”) (68, 69).

Similar articles

Cited by

References

    1. Rabinowitz J. D., and White E. (2010) Autophagy and metabolism. Science 330, 1344–1348 - PMC - PubMed
    1. Tsukada M., and Ohsumi Y. (1993) Isolation and characterization of autophagy-defective mutants of Saccharomyces cerevisiae. FEBS Lett. 333, 169–174 - PubMed
    1. Mizushima N. (2005) The pleiotropic role of autophagy: from protein metabolism to bactericide. Cell Death Differ. 12, 1535–1541 - PubMed
    1. Mizushima N., Levine B., Cuervo A. M., and Klionsky D. J. (2008) Autophagy fights disease through cellular self-digestion. Nature 451, 1069–1075 - PMC - PubMed
    1. Onodera J., and Ohsumi Y. (2004) Ald6p is a preferred target for autophagy in yeast, Saccharomyces cerevisiae. J. Biol. Chem. 279, 16071–16076 - PubMed

MeSH terms

LinkOut - more resources