. 2017 Dec 15;292(50):20362-20378.
doi: 10.1074/jbc.M117.786863. Epub 2017 Oct 17.

Transcription factor 19 interacts with histone 3 lysine 4 trimethylation and controls gluconeogenesis via the nucleosome-remodeling-deacetylase complex

Affiliations

Transcription factor 19 interacts with histone 3 lysine 4 trimethylation and controls gluconeogenesis via the nucleosome-remodeling-deacetylase complex

Sabyasachi Sen et al. J Biol Chem. .

Abstract

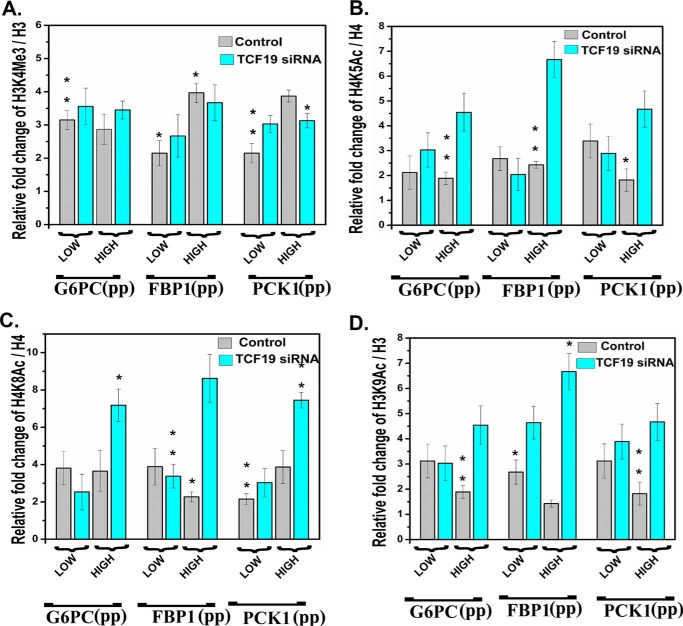
Transcription factor 19 (TCF19) has been reported as a type 1 diabetes-associated locus involved in maintenance of pancreatic β cells through a fine-tuned regulation of cell proliferation and apoptosis. TCF19 also exhibits genomic association with type 2 diabetes, although the precise molecular mechanism remains unknown. It harbors both a plant homeodomain and a forkhead-associated domain implicated in epigenetic recognition and gene regulation, a phenomenon that has remained unexplored. Here, we show that TCF19 selectively interacts with histone 3 lysine 4 trimethylation through its plant homeodomain finger. Knocking down TCF19 under high-glucose conditions affected many metabolic processes, including gluconeogenesis. We found that TCF19 overexpression represses de novo glucose production in HepG2 cells. The transcriptional repression of key genes, induced by TCF19, coincided with NuRD (nucleosome-remodeling-deacetylase) complex recruitment to the promoters of these genes. TCF19 interacted with CHD4 (chromodomain helicase DNA-binding protein 4), which is a part of the NuRD complex, in a glucose concentration-independent manner. In summary, our results show that TCF19 interacts with an active transcription mark and recruits a co-repressor complex to regulate gluconeogenic gene expression in HepG2 cells. Our study offers critical insights into the molecular mechanisms of transcriptional regulation of gluconeogenesis and into the roles of chromatin readers in metabolic homeostasis.

Keywords: PHD finger; gene transcription; gluconeogenesis; glucose metabolism; histone H3 lysine 4 trimethylation; histone deacetylation; histone modification; nucleosome remodeling deacetylase (NuRD); transcription factor; transcription repressor.


Conflict of interest statement

The authors declare that they have no conflicts of interest with the contents of this article

Figures

Figure 1.
Figure 1.
PHD finger of TCF19 binds to histone H3K4Me3. A, schematic representation of TCF19 protein with domain arrangement. FHA, Forkhead-associated domain. B, purified GST-PHD protein incubated with core histones isolated from chicken erythrocyte, immunoblotted with the anti-H3 and anti-H4 antibody. C, preferential interaction of TCF19-PHD (FLAG) with H3K4Me3. HEK293 cells were transiently transfected with full-length TCF19 (FLAG) and TCF19-ΔPHD (FLAG), followed by M2-agarose pulldown, and probed with anti-FLAG, anti-H3K4Me3, anti-H3, and anti-H4 antibody. Deletion of PHD domain abrogates interaction of TCF19 with H3K4Me3 as well as H3 and H4. CONT, empty vector–transfected; TRANS, FLAG-tagged full-length TCF19/ΔPHD–transfected. D, interaction of biotinylated peptides with TCF19 PHD-GST. Pulldown was performed with streptavidin beads, followed by immunoblotting by the anti-GST antibody. Purified GST-PHD domain showed preferential interaction with H3K4Me3 peptide. E, binding isotherms obtained from steady-state fluorescence spectroscopy of TCF19-PHD and indicated peptides. Below, interaction of the PHD finger with increasing multiples of the equilibrium dissociation constant (0.5, 1, 2, 3, 4, and 5 times Kd) showed incremental binding to H3K4Me3. F, GST-tagged PHD finger of TCF19 shows a preference for first the H3 lysine 4 trimethylation, as opposed to other H3 trimethylations. G, multiple-sequence alignment shows conserved features of TCF19-PHD and other H3K4Me3-binding PHD fingers. Zinc-coordinating sites are highlighted in cyan; other residues for lysine trimethyl recognition are highlighted in magenta. ZN1, zinc 1; ZN2, zinc 2. H, molecular modeling of TCF19 PHD domain followed by docking of H3K4Me3 N-terminal peptide (amino acids 1–8). Trp-316 and Trp-307 are proximal to the H3K4Me3 peptide in the docked structure. I, interaction of the indicated biotinylated peptides with wild-type TCF19 PHD-GST and W316A/W307A mutants of PHD-GST. Mutation in tryptophan at position 316 compromised the binding ability of the PHD domain. The Coomassie Blue gel image represents the amount of purified wild-type and mutant protein PHD finger (for all Western blots). Amido Black–stained spots below represent an equal amount of peptide loading. J, TCF19 interacts preferentially with H3K4Me3 compared with other H3 trimethylations. Lysate from HepG2 cells grown under high-glucose (40 mm glucose) conditions was immunoprecipitated with anti-TCF19 antibody and probed with TCF19, H3K4Me3, H3K9Me3, H3K27Me3, and H3K36Me3 antibody. Inp, input.
Figure 2.
Figure 2.
Regulation of metabolic processes by TCF19. A, HepG2 cells were cultured in LG conditions of 5 mm glucose, followed by HG exposure at 40 mm for 48 h, and subsequently reverting to the LG state for 2, 3, and 4 days. Cell lysates were probed with anti-TCF19, anti-NF-κB (as a positive control for high-glucose conditions), and β-actin (loading control). Below, quantification of protein levels are expressed as -fold change over loading control. Nor. Int., normalized intensity. B, alteration in histone H3 trimethylation status in HepG2 cells maintained at LG (5.5 mm glucose) and HG (40 mm) conditions. Numerical values below each band represent normalized values of protein level over β-tubulin. C, heat maps of expression values for differentially expressed genes on TCF19 knockdown under high-glucose conditions (p ≤ 0.05, -fold change ≥ 1.5). Down-regulated genes are marked in green, and up-regulated genes are marked in red. D, effect of knockdown of TCF19 in HepG2, Huh7, and HepaRG cells on core gluconeogenic genes. TCF19 siRNA was transfected in the above-mentioned cells under low-glucose conditions (a) and high-glucose conditions (b). Non-targeting siRNA was used as a negative control, and 18S rRNA was used for normalization. Experiments were repeated three times, and error bars represent S.D. Unpaired Student's t test was used to determine p value (*, p < 0.05; **, p < 0.01). E, table showing a list of enriched GO terms, common between BinGO and DAVID analysis tools. Genes from TCF19 knockdown (high-glucose conditions) with p ≤ 0.05 and -fold change ≥ 1.5 were used for analysis. F, selected GO categories showing the highest enrichment of differentially expressed genes from TCF19 knockdown in high-glucose conditions, analyzed by the PANTHER classification tool.
Figure 3.
Figure 3.
TCF19 inhibits transcription of key gluconeogenic genes. A, transcriptional activity of three key gluconeogenic genes in HepG2 cells (G6PC, FBP1, and PCK1) was quantified in the presence of known activators (dexamethasone/cMAP) and repressor (insulin), either singly or in combination, with overexpression of either full-length TCF19 (TCF19 FL) or TCF19 ΔPHD FLAG-tagged constructs. After 16 h of transfection, cells were treated with the above-mentioned activator and repressor for 6 h in glucose production buffer. -Fold change was calculated over mRNA levels of HepG2 cells under low-glucose medium, and 18S rRNA was used for normalization. Experiments were repeated three times, and error bars represent S.D. Unpaired Student's t test was used to determine p value (*, p < 0.05; **, p < 0.01). B, transcription levels of the three gluconeogenic genes were quantified by real-time PCR with mRNA isolated from HepG2 treated with TCF19 siRNA, under the influence of gluconeogenic activator (Dexamethasone/cMAP) or repressor (Insulin) either singly or in combination. -Fold change calculated over mRNA levels of HepG2 cells treated with scrambled siRNA and 18S rRNA was used for normalization. Experiments were repeated three times, and error bars represent S.D. Unpaired Student's t test was used to determine p value (*, p < 0.05; **, p < 0.01). C, similar experiments as in A were repeated in Huh7 cells under gluconeogenic activator or repressor influence, transfected with either FLAG-tagged full-length TCF19 or TCF19ΔPHD construct. D, transcriptional activity of the gluconeogenic genes were quantified in Huh7 cells under the influence of gluconeogenic activator or repressor after TCF19 siRNA transfection. E, HepaRG cells were chosen as a non-cancerous model to study the effect of TCF19 on gluconeogenesis. HepaRG cells were cultured under specialized conditions to induce differentiation to primary-like cells. A difference in cell morphology was observed between cells after 24 h of plating (a) and after 21 days of culture to induce differentiation (b). Images were acquired in an Invitrogen EVOS FL cell imaging system, under 20× magnification. c, mRNA levels of hepatocyte differentiation markers were checked for cells at day 21 versus cells at day 1. APOB, apolipoprotein B; ALB, albumin; HNF4α, hepatocyte nuclear factor 4α. 18S rRNA was used for normalization. Experiments were repeated three times, and error bars represent S.D. Unpaired Student's t test was used to determine p value (*, p < 0.05; **, p < 0.01). F, expression of the key gluconeogenic genes were quantified in differentiated HepaRG cells, transfected with FLAG-tagged full-length TCF19 protein under the influence of gluconeogenic activators dexamethasone and cAMP (Dex/cAMP) either singly or in combination with repressor insulin. G, firefly luciferase reporter construct containing an upstream G6PC promoter region was used to assess promoter binding affinity of full-length TCF19 or ΔPHD constructs under the influence of gluconeogenic activators or repressors. H, G6PC reporter construct containing critical mutations at the insulin response element in the promoter region was used to assess the specificity of TCF19 for insulin-mediated recruitment at the G6PC promoter. Full-length TCF19 or TCF19 ΔPHD was transiently transfected into HepG2 cells, and a luciferase assay was performed after the indicated treatments. The activities are shown as mean -fold enhancement compared with the empty vector after normalization with Renilla luciferase activity. Each transfection was performed in triplicate, and the experiments were repeated three times. Unpaired Student's t test was used to determine p value (*, p < 0.05; **, p < 0.01).
Figure 4.
Figure 4.
TCF19 inhibits endogenous glucose production in cancerous (HepG2 and Huh7) and primary-like (differentiated HepaRG) hepatocytes. A, a glucose production assay was done to measure endogenous glucose production in HepG2 cells under overexpression of either TCF19-FLAG or TCF19 (ΔPHD)-FLAG by transient transfection. Cells were maintained in glucose production buffer and treated with 5 μm dexamethasone + 10 mm cAMP with or without 100 nm insulin for 8 h. B, glucose production was also measured in HepG2 cells under TCF19-depleted conditions (TCF19 siRNA transfected versus scrambled siRNA). Cells were maintained in glucose production buffer and treated with 5 μm dexamethasone + 10 mm cAMP with or without 100 nm insulin for 8 h. Similar experiments were replicated in Huh7 cells under FLAG TCF19 overexpression (full-length or ΔPHD) (C) or TCF19 depletion (TCF19 siRNA) (D). E, a glucose production assay was also performed in differentiated HepaRG cells following the same protocol under FLAG full-length TCF19 overexpression. F, TCF19 occupancy was investigated at the gluconeogenic gene promoters in HepG2 cells treated with gluconeogenic activator (5 μm dexamethasone + 10 mm cAMP) or in combination with repressor (100 nm insulin). NAV1.2 gene promoter was used as a control non-gluconeogenic gene promoter. Values are shown as S.D. of biological triplicate in each case. Unpaired Student's t test was used to determine p value (*, p < 0.05; **, p < 0.01).
Figure 5.
Figure 5.
TCF19 associates with NuRD complex and regulates gluconeogenic genes. ChIP assays were done in HepG2 cells maintained under low-glucose conditions (5 mm glucose) or high-glucose conditions (40 mm glucose). As a template for recruitment, ∼500 bp of the region upstream of the transcription start site of each of the three key gluconeogenic genes was selected, and previously reported primers were used. pp, proximal promoter region. The 3′-UTRs of individual genes were used as a negative control. NAV1.2 promoter is used as a glucose–non-responsive control for TCF19. Recruitment of TCF19 was found to be enhanced in high-glucose conditions (A). High-glucose conditions also resulted in increased chromatin occupancy of CHD4 (B), MTA1 (C), and HDAC1 (D), which are components of the NuRD complex. E, binding of CHD4 to promoter region was reduced on siRNA-mediated knockdown of TCF19 in HepG2 cells under high-glucose conditions. Values are shown as S.D. of biological triplicates in each case. Unpaired Student's t test was used to determine p value (*, p < 0.05; **, p < 0.01). F, TCF19 and CHD4 interact with each other. Endogenous IP was done in HepG2 cells in both LG and HG conditions. IP with anti-CHD4 was probed for TCF19, and IP with anti-TCF19 was probed for CHD4. IgG used as negative control in both cases.
Figure 6.
Figure 6.
A and B, hyperglycemia induced changes in histone modifications at the gluconeogenic gene promoters. A and B, increased chromatin occupancy of H3 and H4 unmodified histone, indicating chromatin compaction on increasing glucose concentration. C, no significant change was observed for the H3K4Me3 mark in the target promoter region upon high-glucose shift. D–F, depletion of activation marks at the promoter site; H4K8Ac, H4K5Ac, and H3K9Ac also indicate overall chromatin compaction. pp, proximal promoter region. The 3′-UTRs of individual genes were used as a negative control. Values are shown as S.D. of biological triplicates in each case. Unpaired Student's t test was used to determine p value (*, p < 0.05; **, p < 0.01).
Figure 7.
Figure 7.
TCF19 depletion in HepG2 cells leads to increase in histone acetylation at gluconeogenic promoters. siRNA-mediated depletion of TCF19 in HepG2 cells maintained in either low-glucose or high-glucose conditions causes no significant alteration of the H3K4Me3 mark at the promoter region of the key gluconeogenic genes (A), whereas activation marks like H4K5Ac (B), H4K8Ac (C), and H3K9Ac (D) were significantly increased upon TCF19 knockdown in high-glucose conditions, indicating derepression of the gluconeogenic genes. pp, proximal promoter region. Unpaired Student's t test was used to determine p value (*, p < 0.05; **, p < 0.01).

Similar articles

Cited by

References

    1. Nordlie R. C., Foster J. D., and Lange A. J. (1999) Regulation of glucose production by the liver. Annu. Rev. Nutr. 19, 379–406 - PubMed
    1. Foufelle F., and Ferré P. (2002) New perspectives in the regulation of hepatic glycolytic and lipogenic genes by insulin and glucose: a role for the transcription factor sterol regulatory element binding protein-1c. Biochem. J. 366, 377–391 - PMC - PubMed
    1. He L., Sabet A., Djedjos S., Miller R., Sun X., Hussain M. A., Radovick S., and Wondisford F. E. (2009) Metformin and insulin suppress hepatic gluconeogenesis through phosphorylation of CREB binding protein. Cell 137, 635–646 - PMC - PubMed
    1. Gray S. G., and De Meyts P. (2005) Role of histone and transcription factor acetylation in diabetes pathogenesis. Diabetes Metab. Res. Rev. 21, 416–433 - PubMed
    1. Chalkiadaki A., and Guarente L. (2011) Metabolic signals regulate SIRT1 expression. EMBO Rep. 12, 985–986 - PMC - PubMed

Publication types

MeSH terms

Associated data