. 2017 Dec 8;292(49):20342-20352.
doi: 10.1074/jbc.M117.811133. Epub 2017 Oct 17.

Analysis of substrate specificity of Trypanosoma brucei oligosaccharyltransferases (OSTs) by functional expression of domain-swapped chimeras in yeast

Affiliations

Analysis of substrate specificity of Trypanosoma brucei oligosaccharyltransferases (OSTs) by functional expression of domain-swapped chimeras in yeast

Kristina Poljak et al. J Biol Chem. .

Abstract

N-Linked protein glycosylation is an essential and highly conserved post-translational modification in eukaryotes. The transfer of a glycan from a lipid-linked oligosaccharide (LLO) donor to the asparagine residue of a nascent polypeptide chain is catalyzed by an oligosaccharyltransferase (OST) in the lumen of the endoplasmic reticulum (ER). Trypanosoma brucei encodes three paralogue single-protein OSTs called TbSTT3A, TbSTT3B, and TbSTT3C that can functionally complement the Saccharomyces cerevisiae OST, making it an ideal experimental system to study the fundamental properties of OST activity. We characterized the LLO and polypeptide specificity of all three TbOST isoforms and their chimeric forms in the heterologous expression host S. cerevisiae where we were able to apply yeast genetic tools and newly developed glycoproteomics methods. We demonstrated that TbSTT3A accepted LLO substrates ranging from Man5GlcNAc2 to Man7GlcNAc2 In contrast, TbSTT3B required more complex precursors ranging from Man6GlcNAc2 to Glc3Man9GlcNAc2 structures, and TbSTT3C did not display any LLO preference. Sequence differences between the isoforms cluster in three distinct regions. We have swapped the individual regions between different OST proteins and identified region 2 to influence the specificity toward the LLO and region 1 to influence polypeptide substrate specificity. These results provide a basis to further investigate the molecular mechanisms and contribution of single amino acids in OST interaction with its substrates.

Keywords: N-linked glycosylation; Trypanosoma brucei; glycosylation occupancy analysis; lipid-linked oligosaccharide specificity; oligosaccharide; oligosaccharyltransferase; yeast.


Conflict of interest statement

The authors declare that they have no conflicts of interest with the contents of this article

Figures

Figure 1.
Figure 1.
LLO specificity of TbSTT3 paralogues. Strains deleted for genomic STT3stt3) were complemented by a URA3-plasmid encoding yeast STT3 (ScSTT3). The strains harbored a second LEU2-marked plasmid encoding TbSTT3A, TbSTT3B, TbSTT3C, ScSTT3, or no STT3 gene (e.v.). Serial dilutions of Δstt3Δalg3 (A), Δstt3Δalg9 (B), Δstt3Δalg12 (C), Δstt3Δalg6 (D), and Δstt3 (E) were spotted onto 5-FOA-containing medium and incubated at 23 °C for different times to select for ura− cells. STT3s encoded on the LEU2 plasmid complementing the genomic Δstt3 deletion support growth on 5-FOA-containing medium. LLO structures of the respective strains were depicted schematically. F, yeast LLO structure is represented by two GlcNAc (black squares), nine Man (gray circles), and three Glc (black circles) residues with the respective linkages indicated, and LLO branches are labeled by a–c.
Figure 2.
Figure 2.
Protein sequence alignment of TbSTT3B and TbSTT3C. Protein sequences of TbSTT3B and TbSTT3C were aligned, and identical residues are displayed in black. Residues distinct in TbSTT3B and TbSTT3C are labeled white. The sequences of TbSTT3B and TbSTT3C show sequence differences in three discrete regions (1–3) labeled by a rectangle. All three regions are located in the lumenal part of the TbSTT3 proteins. The conserved WWDXG motif is marked by a horizontal line above the sequence.
Figure 3.
Figure 3.
LLO specificity of TbSTT3s is provided by distinct regions in the proteins. Strains deleted for genomic STT3 (Δstt3) were complemented by a URA3 plasmid encoding yeast STT3 (ScSTT3). The strains harbored a second LEU2-marked plasmid encoding TbSTT3B, TbSTT3C, and TbSTT3B-C chimeras (see text for description), ScSTT3, or no STT3 gene (e.v.). Serial dilutions of Δstt3Δalg3 (A) and Δstt3 (B) were spotted on 5-FOA containing medium and incubated at 23 °C for 7 days (Δstt3) to 15 days (Δstt3Δalg3) to select for Ura cells. STT3s encoded on the LEU2-plasmid complementing the genomic Δstt3 deletion support growth on 5-FOA-containing medium. LLO structures of the respective strains were depicted schematically.
Figure 4.
Figure 4.
Glycosylation site occupancy and sequence composition analysis for TbSTT3s in Δstt3Δalg9 cells. Δstt3Δalg9 cells complemented with TbSTT3A, TbSTT3B, and TbSTT3C were grown in light medium and mixed 1:1 with the wild-type reference strain grown in heavy medium, and membrane-derived peptides were prepared. Peptide abundance was measured by PRM mass spectrometry. Intensity ratios of glycosylated light to heavy peptides were normalized for expression differences in TbSTT3-expressing cells and wild-type cells. The resulting ratios represent the site occupancy for the TbSTT3-expressing cells relative to the wild-type reference strain. Data are the mean of biological triplicates. A, schematic representation of SILAC PRM MS method. B, site occupancy values for TbSTT3A, TbSTT3B, and TbSTT3C are presented in a heatmap. Color is mapped from black (0%) to white (100%). Data are from supplemental Table 1. Data were used for cluster analysis. In cluster analysis samples with high similarity are close, and samples with low similarity are distant from each other. C, sequence composition analysis was performed where amino acids were grouped based on their polarity. Percentage change in respective ratio of each amino acid group between efficiently and poorly glycosylated sequences upstream of glycosylation sequons was calculated for each TbSTT3-expressing strain. Efficiently glycosylated sites are considered where glycosylation occupancy ratio compared with wild type is more than 0.75, and poorly glycosylated sites are considered where glycosylation occupancy ratio compared with wild type is less than 0.25. D, two-sample logo analysis (30) was used to calculate and visualize residues surrounding glycosylation sites that are significantly enriched in either efficiently or poorly glycosylated sites in each TbSTT3-expressing strain. Sequence size analyzed contained 10 amino acids upstream and downstream from the glycosylation site. Efficiently glycosylated sites are considered where glycosylation occupancy ratio compared with wild type is more than 0.75, and poorly glycosylated sites are considered where glycosylation occupancy ratio compared with wild type is less than 0.25.
Figure 5.
Figure 5.
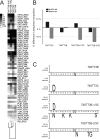
Glycosylation site occupancy and sequence composition analysis for TbSTT3B-1/3C and TbSTT3B-2/3C chimeras in Δstt3Δalg9 cells. Δstt3Δalg9 cells complemented with TbSTT3B, TbSTT3C, TbSTT3B-1/3C, and TbSTT3B-2/3C were grown in light medium and mixed 1:1 with the wild-type reference strain grown in heavy medium, and membrane-derived peptides were prepared. Intensity ratios of glycosylated light to heavy peptides were normalized for expression differences in TbSTT3-expressing cells and wild-type cells. The resulting ratios represent the site occupancy for the TbSTT3-expressing cells relative to the wild-type reference strain (reported in %). A, site occupancy values for TbSTT3B, TbSTT3C, TbSTT3B-1/3C, and TbSTT3B-2/3C were used for cluster analysis. In cluster analysis samples with high similarity are close whereas samples with low similarity are distant from each other. B, sequence composition analysis was performed where amino acids were grouped based on their polarity. Percentage change in respective ratio of each amino acid group between efficiently and poorly glycosylated sequences upstream of glycosylation sequon was calculated for each TbSTT3-expressing strain. C, two-sample logo analysis (30) was used to visualize differences between efficiently and poorly glycosylated sequences surrounding the glycosylation sites for each TbSTT3-expressing strain.

Similar articles

Cited by

References

    1. Lowe J. B., and Marth J. D. (2003) A genetic approach to mammalian glycan function. Annu. Rev. Biochem. 72, 643–691 - PubMed
    1. Helenius A., and Aebi M. (2004) Roles of N-linked glycans in the endoplasmic reticulum. Annu. Rev. Biochem. 73, 1019–1049 - PubMed
    1. Burda P., and Aebi M. (1999) The dolichol pathway of N-linked glycosylation. Biochim. Biophys. Acta 1426, 239–257 - PubMed
    1. Gavel Y., and von Heijne G. (1990) Sequence differences between glycosylated and non-glycosylated Asn-X-Thr/Ser acceptor sites: implications for protein engineering. Protein Eng. 3, 433–442 - PMC - PubMed
    1. Yan Q., and Lennarz W. J. (2002) Studies on the function of oligosaccharyl transferase subunits. Stt3p is directly involved in the glycosylation process. J. Biol. Chem. 277, 47692–47700 - PubMed

MeSH terms

Substances