. 2018 Jan;176(1):364-377.
doi: 10.1104/pp.17.01126. Epub 2017 Oct 17.

Environmental and Genetic Factors Regulating Localization of the Plant Plasma Membrane H+-ATPase

Affiliations

Environmental and Genetic Factors Regulating Localization of the Plant Plasma Membrane H+-ATPase

Miyoshi Haruta et al. Plant Physiol. 2018 Jan.

Abstract

A P-type H+-ATPase is the primary transporter that converts ATP to electrochemical energy at the plasma membrane of higher plants. Its product, the proton-motive force, is composed of an electrical potential and a pH gradient. Many studies have demonstrated that this proton-motive force not only drives the secondary transporters required for nutrient uptake, but also plays a direct role in regulating cell expansion. Here, we have generated a transgenic Arabidopsis (Arabidopsis thaliana) plant expressing H+-ATPase isoform 2 (AHA2) that is translationally fused with a fluorescent protein and examined its cellular localization by live-cell microscopy. Using a 3D imaging approach with seedlings grown for various times under a variety of light intensities, we demonstrate that AHA2 localization at the plasma membrane of root cells requires light. In dim light conditions, AHA2 is found in intracellular compartments, in addition to the plasma membrane. This localization profile was age-dependent and specific to cell types found in the transition zone located between the meristem and elongation zones. The accumulation of AHA2 in intracellular compartments is consistent with reduced H+ secretion near the transition zone and the suppression of root growth. By examining AHA2 localization in a knockout mutant of a receptor protein kinase, FERONIA, we found that the intracellular accumulation of AHA2 in the transition zone is dependent on a functional FERONIA-dependent inhibitory response in root elongation. Overall, this study provides a molecular underpinning for understanding the genetic, environmental, and developmental factors influencing root growth via localization of the plasma membrane H+-ATPase.


Figures

Figure 1.
Figure 1.
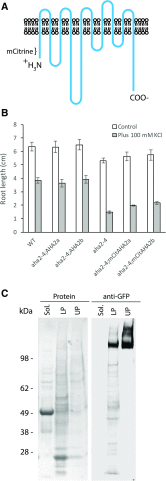
Expression of fluorescently labeled AHA2 in plants. A, Membrane topology of mCitrineAHA2 (mCitAHA2) fusion protein. The mCitrine fluorescent protein sequence was inserted at the amino acid position Leu-4 located in the cytoplasmic face of the AHA2 sequence. B, Root growth measurements of mCitAHA2-expressing plants. Arabidopsis seedlings of wild type, aha2-4 mutant, aha2-4;AHA2 (wild-type complementation) or aha2-4;mCitAHA2 were grown for 3 d onto 1/2 MS media, then transferred to the media supplemented with 100 mm KCl and grown for additional 10 d. C, Immunological detection of mCitAHA2 protein from aha2-4;mCitAHA2 plants. Ten-d-old seedlings were extracted to enrich the plasma membrane fraction using the two-phase partition method. Fifteen micrograms of proteins were loaded onto protein gel. Blot was probed with anti-GFP (right). Once the blot membranes were scanned for the immunodetection, they were stained with Ponceau S to visualize proteins (left). Sol., the fraction containing soluble proteins; LP, the lower-phase fraction containing endomembrane proteins; UP, the upper-phase fraction containing plasma membrane proteins.
Figure 2.
Figure 2.
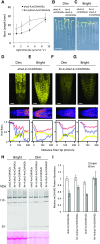
Organ length and mCitAHA2 localization in aha2-4;mCitAHA2 plants grown under bright or dim light conditions. A, Hypocotyl and root length of aha2-4;mCitAHA2 seedlings grown for 10 d under dim (2.2 μmol m−2 s−1) or bright (10 μmol m−2 s−1) light conditions. B, Hypocotyl of aha2-4;mCitAHA2 seedling grown for 10 d under the bright light. C, Hypocotyl of aha2-4;mCitAHA2 seedling grown for 10 d under the dim light. D, Root of aha2-4;mCitAHA2 seedling grown for 10 d under the bright light. E, Root of aha2-4;mCitAHA2 seedling grown for 10 d under the dim light. F, Root growth curve of aha2-4;mCitAHA2 seedlings grown under the dim light. n = 7. Data are shown with mean ± se. G, Root of aha2-4;mCitAHA2 seedling grown for 4 d under the dim light. H, Root of aha2-4;mCitAHA2 seedling grown for 10 d under the dim light. For (B) to (E) and (G) to (H), images are a maximum intensity projection of fluorescent CLSM optical sections. Scale bars indicate 50 μm for (B) and (C) and 20 μm for (D) to (E) and (G) to (H). I, Quantitation of mCitAHA2 fluorescence intensity. The mean fluorescent intensity values were calculated along the root length by a 21-pixel window size corresponding to approximately 8 μm from three 3D images of aha2-4;mCitAHA2 roots grown the dim or bright conditions (Supplemental Fig. S2). (Top) Heat map for aha2-4;mCitAHA2 intensity scale; white indicates the highest intensity and black indicates the lowest intensity. (Middle) Images of aha2-4;mCitAHA2 seedling roots grown under the dim or bright light conditions. The x axis of the root images corresponds to the scale shown in the bottom chart showing the intensity profiling. (Bottom) Quantified intensity profiles for aha2-4;mCitAHA2 seedling roots grown under the dim or bright light conditions. Approximately 60 optical slices were summed at a given pixel position. Voxels were categorized into two groups: high intensity (yellow), or medium intensity (red). Subtracting the number of low-intensity voxels from the high-intensity voxels produced the accumulation index (shown with blue plot).
Figure 3.
Figure 3.
Visualization and quantitation of intracellular localization of mCitAHA2 fluorescent signals in aha2-4;mCitAHA2 roots grown under dim light for 11 d. A, Quantitation of intracellularly localized mCitAHA2 structures (i.e. blobs). Root region 212 μm from the tip in the 3D images was segmented into the meristem (61.28 μm from the tip), the transition zone (63.77 μm above the meristem), and the elongation zone (86.95 μm above the transition zone). For each region, surface rendering and identification of intracellularly localized structures was performed as detailed in “Materials and Methods” (an example of the surfaces generated is shown in Supplemental Fig. S5). Graph shows mean number of intracellular structures ± sd (n = 3). B, 3D image of root tip of aha2-4;mCitAHA2 seedling grown for 10 d under the dim light. Image was detected by mCitrine emission. Bar, 20 μm. C, PI staining of the identical aha2-4;mCitAHA2 seedling shown in (B). Image was detected by PI emission. D, Two-channel merge of (B) and (C). Regression values for colocalization of mCitAHA2 and PI were shown at the right of the corresponding regions. E, Magnified view of the transition zone that was visualized in the mCitAHA2 channel shown in (B). Bar, 10 μm. F, Magnified view of PI-stained cells in the same region shown in (E). G, Orthogonal view of mCitAHA2 root. (Top) XZ section of the root at the position indicated with the green line shown in the bottom image. (Bottom) XY section of the root at the position indicated with the blue line shown in the top image. Bar, 15 μm. H, Magnified view of the root regions showing the transition of mCitAHA2 localization from the intracellular compartments to the plasma membrane. Bar, 15 μm. I, Diagram showing the interpretation of the fluorescent raw image shown in (H). To assist the interpretation of changes in mCitAHA2 localization, the image was reproduced by drawing. J, Annotation of cell types and mCitAHA2 cellular localization.
Figure 4.
Figure 4.
Measurement of root surface pH. A, Image of aha2-4;mCitAHA2 root grown under dim light for 10 d. A, Root image was visualized with mCitrine channel detection. The yellow color in the bathing media is due to overlapping emission from FITC-dextran. A root was submerged in an unbuffered solution containing 1 mm KCl, 1 mM CaCl2, and 3 mg/mL FITC-dextran. Bar, 20 μm. B, Visualization of FITC-dextran as a pH probe for measuring the root surface pH of the identical plant. Brighter green indicates higher pH values. C, Intensity profiling the root surface pH. (Left) Color scale for pH. (Right) Heat map of pH values at the root surface. Region surrounded by the white line was used to measure root surface pH. D, Quantitation of the mean pH values at the root surface. Data are shown as the mean ± se. n = 4. E, Image of aha2-4;mCitAHA2 root grown under dim light for 10 d and visualized with mCitrine channel detection. A root was submerged in a buffered solution containing 10 mm MES (pH5.5), 1 mm KCl, 1 mm CaCl2, and 3 mg/mL FITC-dextran. F, Visualization of FITC-dextran as a pH probe for measuring the root surface pH. G, Profiling the root surface pH. (Left) Color scale for pH. (Right) Heat map of pH values at the root surface. H, Quantitation of pH values at the root surface. Data are shown as the mean ± se. n = 4.
Figure 5.
Figure 5.
FERONIA-dependent root growth suppression and mCitAHA2 intracellular accumulation. A, Effect of fer-4 mutation on dim-light-dependent root growth suppression. The aha2-4;mCitAHA2 or fer-4; aha2-4;mCitAHA2 seedlings were grown under various light intensity conditions for 10 d. n = 7. Data are shown as the mean ± sd. B, Images of aha2-4;mCitAHA2 and fer-4; aha2-4;mCitAHA2 seedlings grown under the dim light for 10 d. Bar, 1 cm. C, Images of aha2-4;mCitAHA2 and fer-4; aha2-4;mCitAHA2 seedlings grown under the bright light for 10 d. D, Fluorescent intensity profiling of aha2-4;mCitAHA2 root grown under the dim light for 10 d. E, Fluorescent intensity profiling of aha2-4;mCitAHA2 root grown under the bright light for 10 d. F, Fluorescent intensity profiling of fer-4;aha2-4;mCitAHA2 root grown under the dim light for 10 d. G, Fluorescent intensity profiling of fer-4;aha2-4;mCitAHA2 root grown under the bright light for 10 d. Scale bar indicates 20 μm for (D) to (G). H, Comparison of mCitAHA2 protein abundance between FER wild type and fer-4 knockout plants grown under bright or dim light conditions. Crude protein extracts (6.5 μg) from seedlings grown for 10 d under bright or dim light were analyzed. (Top) Immunoblot detected with GFP antibody. (Bottom) Ponceau S staining of the identical blot is shown as a loading control. I, Quantitation of GFP positive signals shows that fer-4;aha2-4;mCitAHA2 plants grown under dim light contain more mCitAHA2 protein than aha2-4;mCitAHA2 plants. n = 3. Data are shown as the mean ± se values.

References

    1. Barbez E, Dünser K, Gaidora A, Lendl T, Busch W (2017) Auxin steers root cell expansion via apoplastic pH regulation in Arabidopsis thaliana. Proc Natl Acad Sci USA 114: E4884–E4893 - PMC - PubMed
    1. Baxter I, Tchieu J, Sussman MR, Boutry M, Palmgren MG, Gribskov M, Harper JF, Axelsen KB (2003) Genomic comparison of P-type ATPase ion pumps in Arabidopsis and rice. Plant Physiol 132: 618–628 - PMC - PubMed
    1. Bouche-Pillon S, Fleurat-Lessard P, Fromont JC, Serrano R, Bonnemain JL (1994) Immunolocalization of the plasma membrane H+ -ATPase in minor veins of Vicia faba in relation to phloem loading. Plant Physiol 105: 691–697 - PMC - PubMed
    1. Boyes DC, Zayed AM, Ascenzi R, McCaskill AJ, Hoffman NE, Davis KR, Görlach J (2001) Growth stage-based phenotypic analysis of Arabidopsis: a model for high throughput functional genomics in plants. Plant Cell 13: 1499–1510 - PMC - PubMed
    1. Chory J. (2010) Light signal transduction: an infinite spectrum of possibilities. Plant J 61: 982–991 - PMC - PubMed

Publication types

MeSH terms

LinkOut - more resources