. 2017 Oct 17;10(501):eaaj1784.
doi: 10.1126/scisignal.aaj1784.

The matricellular protein TSP1 promotes human and mouse endothelial cell senescence through CD47 and Nox1

Affiliations

The matricellular protein TSP1 promotes human and mouse endothelial cell senescence through CD47 and Nox1

Daniel N Meijles et al. Sci Signal. .

Abstract

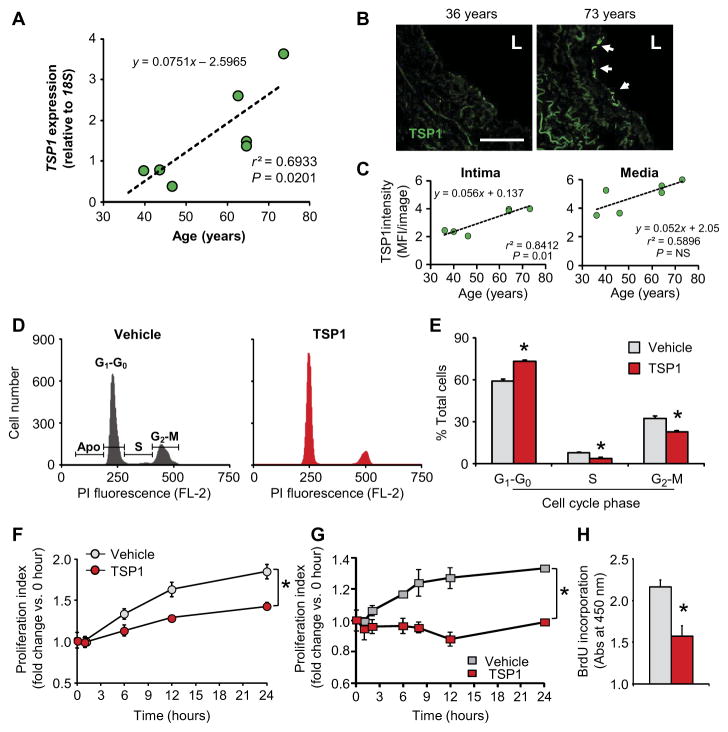
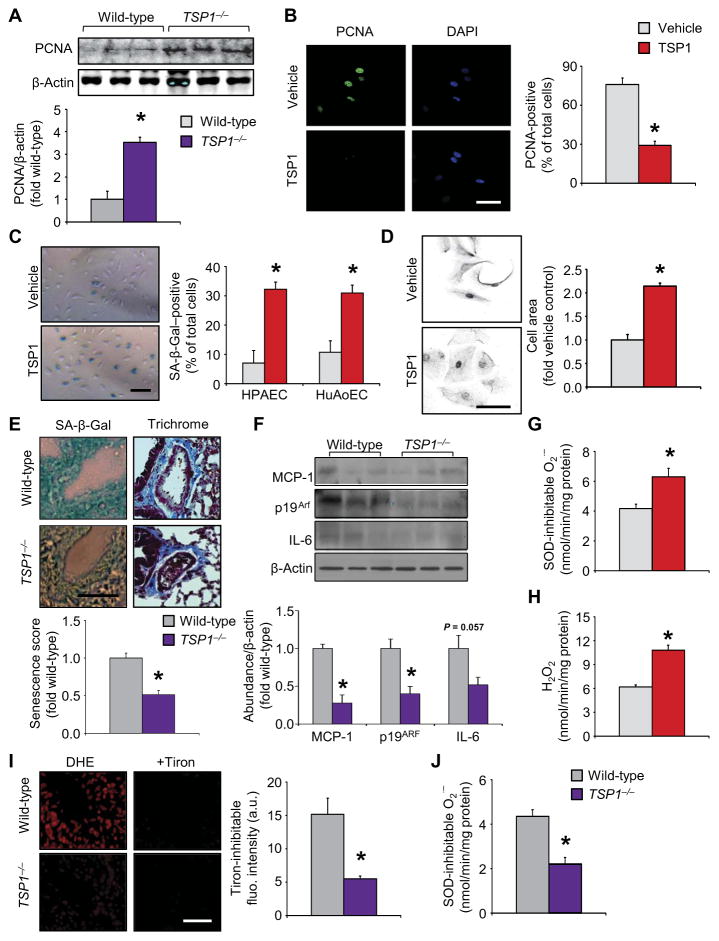
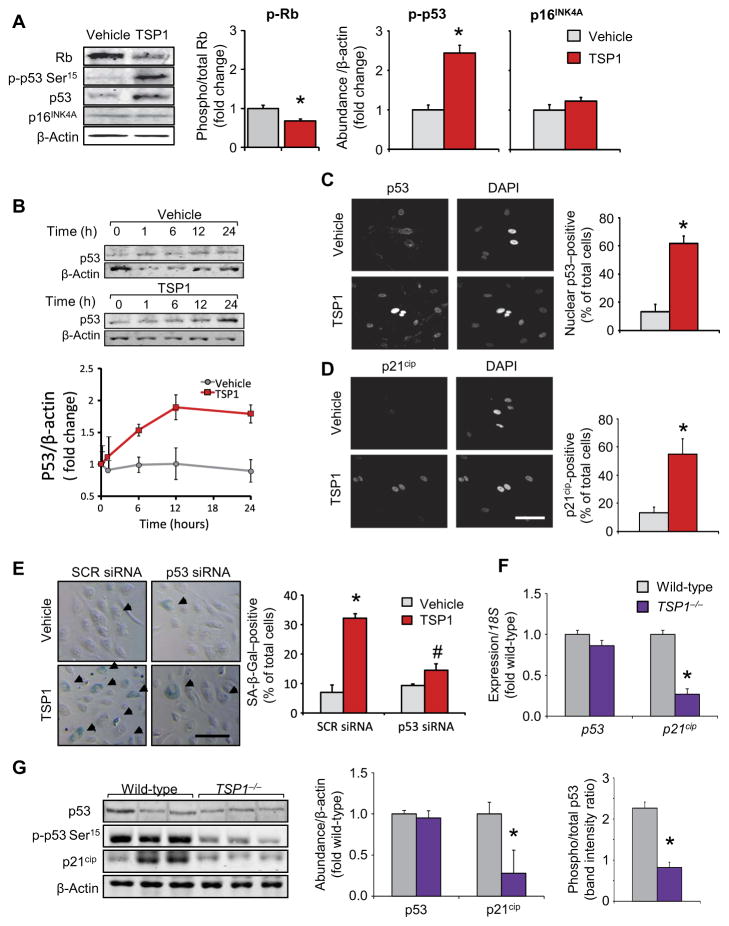
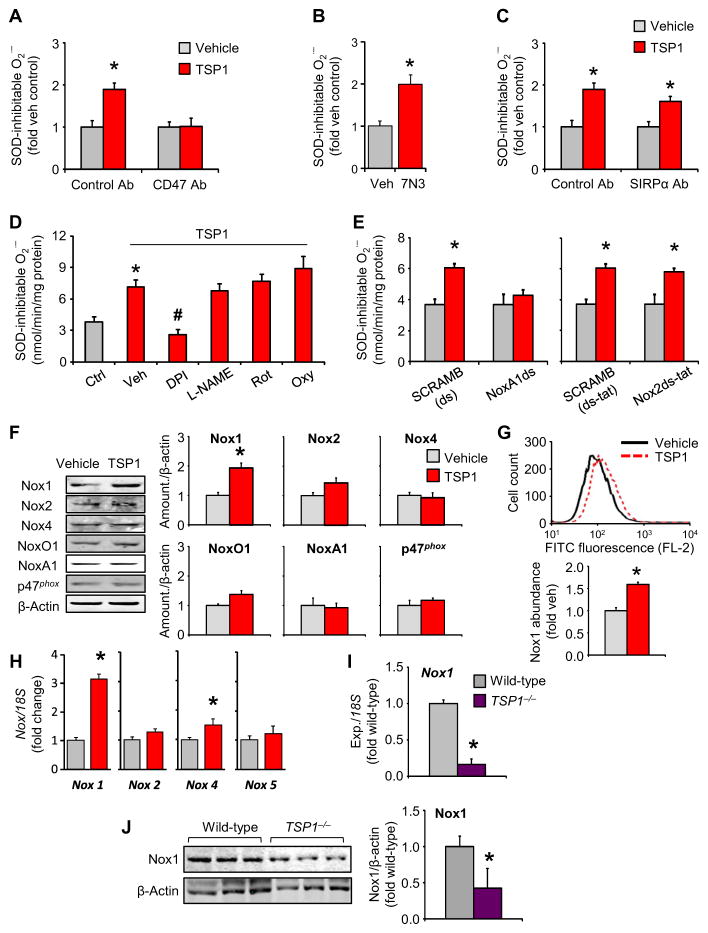
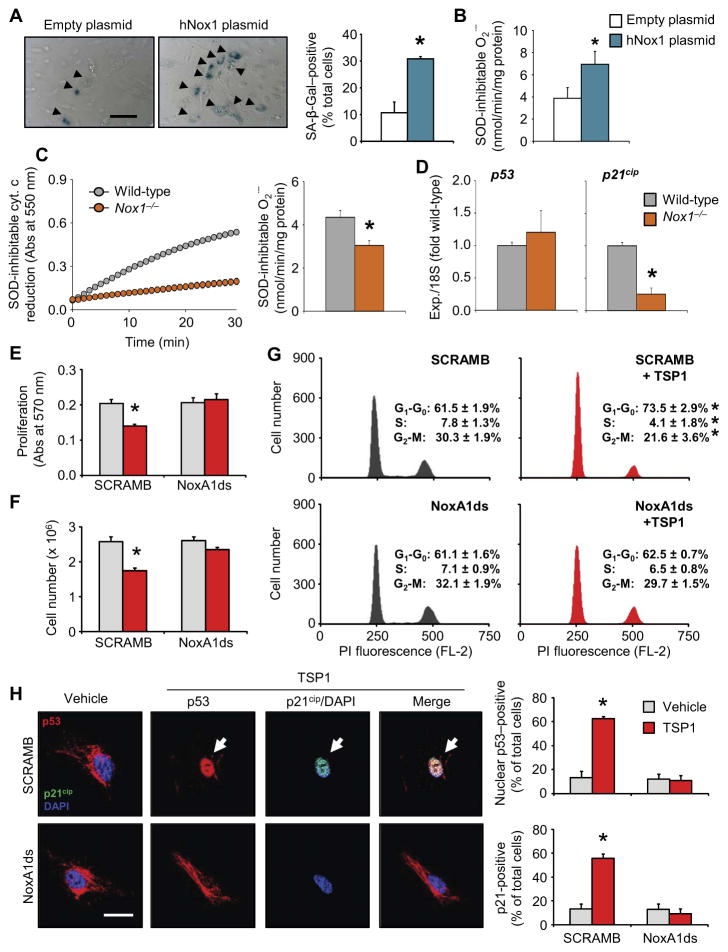
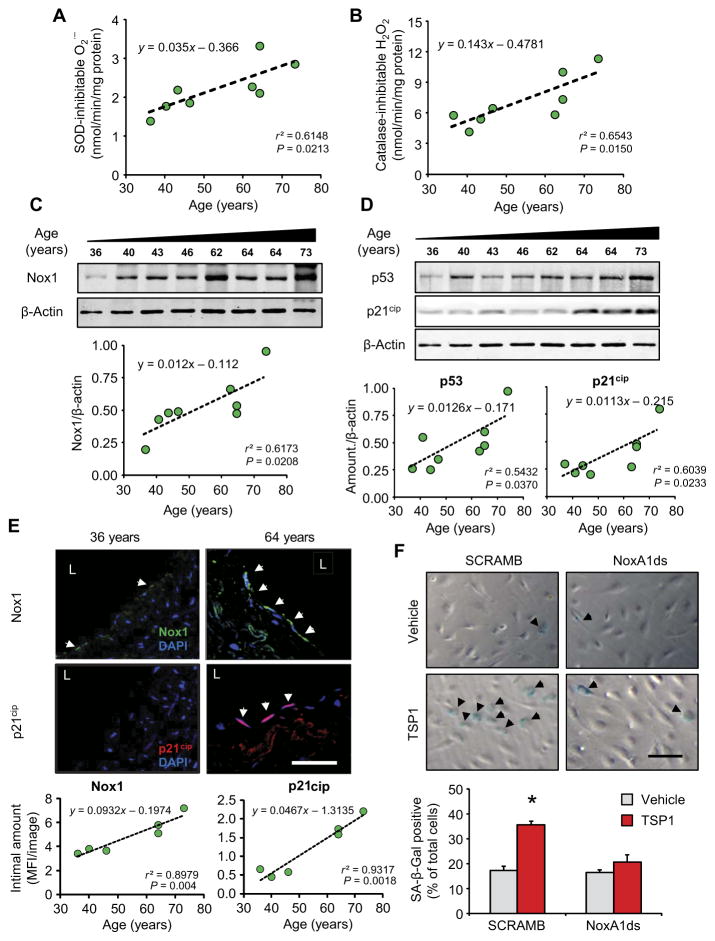
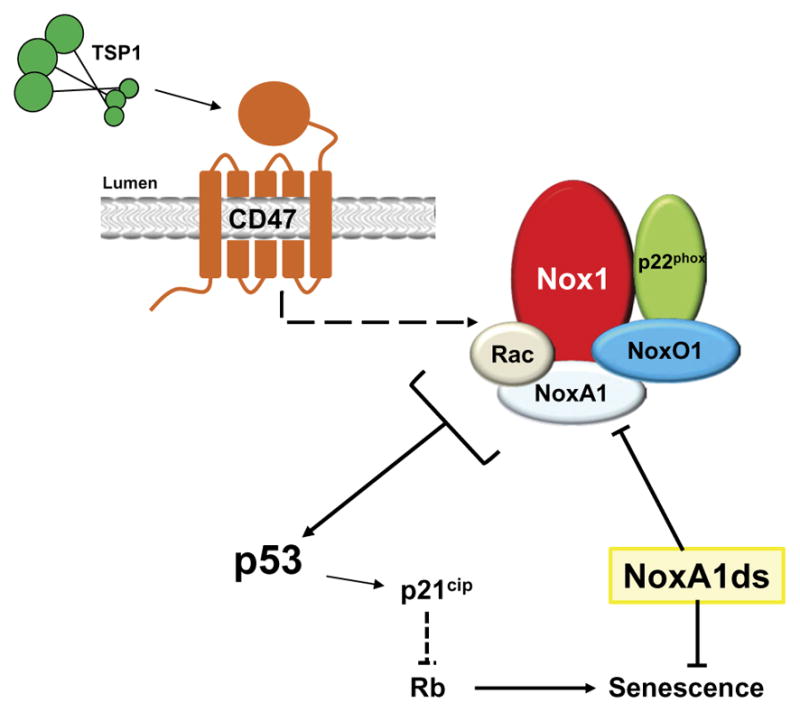
Senescent cells withdraw from the cell cycle and do not proliferate. The prevalence of senescent compared to normally functioning parenchymal cells increases with age, impairing tissue and organ homeostasis. A contentious principle governing this process has been the redox theory of aging. We linked matricellular protein thrombospondin 1 (TSP1) and its receptor CD47 to the activation of NADPH oxidase 1 (Nox1), but not of the other closely related Nox isoforms, and associated oxidative stress, and to senescence in human cells and aged tissue. In human endothelial cells, TSP1 promoted senescence and attenuated cell cycle progression and proliferation. At the molecular level, TSP1 increased Nox1-dependent generation of reactive oxygen species (ROS), leading to the increased abundance of the transcription factor p53. p53 mediated a DNA damage response that led to senescence through Rb and p21cip, both of which inhibit cell cycle progression. Nox1 inhibition blocked the ability of TSP1 to increase p53 nuclear localization and p21cip abundance and its ability to promote senescence. Mice lacking TSP1 showed decreases in ROS production, p21cip expression, p53 activity, and aging-induced senescence. Conversely, lung tissue from aging humans displayed increases in the abundance of vascular TSP1, Nox1, p53, and p21cip Finally, genetic ablation or pharmacological blockade of Nox1 in human endothelial cells attenuated TSP1-mediated ROS generation, restored cell cycle progression, and protected against senescence. Together, our results provide insights into the functional interplay between TSP1 and Nox1 in the regulation of endothelial senescence and suggest potential targets for controlling the aging process at the molecular level.


Conflict of interest statement

Competing interests: P.J.P. is named on a filed patent (US patent no. 9,187,528 B2) for NoxA1ds. All other authors declare that they have no competing interests.

Figures

Fig. 1
Fig. 1. TSP1 is increased in aging human lung vasculature and induces endothelial cell cycle arrest in vitro
Data for human tissue are shown in green; data for cell experiments are shown in red; data in gray are the corresponding controls. (A) Correlation of TSP1 expression as quantified by quantitative reverse transcription polymerase chain reaction (qRT-PCR) with age in human lung homogenates (n = 7 subjects; r2=0.69, P = 0.02). Data points are means of three replicates of the same sample. (B) Representative images of TSP1 protein abundance in the intimal and medial layer of human pulmonary arteries of a 73-year-old subject (right; arrows indicate intima) compared to an artery from a 36-year-old subject (left) as determined by immunofluorescence (IF). Scale bar, 100 μm. L, vascular lumen. (C) Quantitation of immunofluorescence images from six subjects (n = 4 samples each, 10 to 20 images per sample) is plotted as a linear regression; equation, r2, and P values are as indicated. MFI, mean fluorescence intensity. (D) Cell cycle profile analysis of vehicle (left) and TSP1-challenged (right) HPAECs measured by propidium iodide (PI) labeling and fluorescence-activated cell sorting (FACS). FL-2, fluorescence channel 2. (E) Quantitative analysis of cell cycle phase distribution of HPAECs. Data are the means ± SEM of 20,000 events (n = 4 biological replicates per treatment group) expressed as percentage. *P < 0.05 for TSP1 challenge compared to vehicle control by Mann-Whitney test of each phase. (F and G) HPAEC proliferation in the presence or absence of TSP1, as measured by trypan blue exclusion assay (F) and MTT assay (G). Data are means ± SEM (n = 3 biological replicates per treatment). P < 0.001 for TSP1 compared to vehicle control by repeated-measures analyses. (H) BrdU incorporation in HPAECs in the presence or absence of TSP1 at 24 hours. Data are means ± SEM (n = 3 biological replicates per treatment). *P < 0.05 for TSP1 challenge compared to vehicle control by Student’s t test.
Fig. 2
Fig. 2. TSP1 promotes cell and tissue senescence in vitro and oxidative stress in wild-type middle-aged mice
Data for TSP1−/− samples are plotted in purple; data for cell experiments are in red; data in gray represent the corresponding controls. (A and B) Abundance of the S phase–associated proliferation marker PCNA in middle-aged TSP1−/− mice (purple bar) compared to age-matched wild-type controls (gray bar) as analyzed by Western blotting (A) and in HPAECs exposed to TSP1 as analyzed by immunofluorescence (B). Data are means ± SEM [n = 6 animals per group (A); n = 3 cell populations per treatment, 10 to 20 images per immunodetection (scale bar, 20 μm)] (B); *P < 0.05 compared to wild-type or vehicle control by Student’s t test. (C to F) Endothelial cell senescence as detected by SA-β-Gal labeling [C; HPAECs and human aortic endothelial cells (HuAoECs)] and increases in cell size (D; HPAECs). SA-β-Gal (E, left) and trichrome staining (E, right) were used on en face tissue to visualize senescence, gross lung vessel morphology, and collagen deposition (blue) in middle-aged wild-type and TSP1−/− lungs. The abundance of SASP factors [MCP-1, p19Arf, and interleukin-6 (IL-6)] was assessed by Western blotting in middle-aged TSP1−/− and age-matched wild-type controls (F; purple compared to gray bars). Data are means ± SEM (n = 3 independent experiments or n = 3 animals; 12 images per group). Scale bar, 100 μm. *P < 0.05 for TSP1 challenge compared to vehicle control or null compared to age-matched wild-type mice by Student’s t test. (G and H) NADPH-driven O2•− (G; cytochrome c assay) and H2O2 (H; Amplex Red assay) production in HPAEC lysates. Data are means ± SEM (n = 4 biological replicates per treatment). *P < 0.05 compared to vehicle controls by Student’s t test. (I and J) En face cell-permeant O2•− scavenger (Tiron)–inhibitable dihydroethidium (DHE)–ROS, as measured by fluorescence microscopy (I), and NADPH-driven homogenate O2•− production, as measured by cytochrome c reduction (J). Data are means ± SEM (n = 3 to 6 mice per group). Scale bar, 50 μm. *P < 0.05 compared to wild-type controls by Student’s t test. a.u., arbitrary units.
Fig. 3
Fig. 3. TSP1 induces DDR-p53-p21cip
mediated senescence. Data for TSP1−/− samples are depicted in purple; data for cell experiments are in red; data in gray are the corresponding controls. (A) Abundance of Rb, total and phospho-Ser15 p53, and p16INK4A after 24 hours of TSP1 challenge in HPAECs, as measured by Western blot. Data are means ± SEM (n = 3 biological replicates per treatment); *P < 0.05 compared to vehicle by Student’s t test. (B) Time-dependent changes in p53 abundance in HPAECs stimulated with TSP1, as measured by Western blot. Graphical data are means ± SEM (n = 3 biological replicates per treatment), by repeated-measures analysis. (C and D) Activation of the p53 pathway, as assessed by nuclear localization of p53 (C), and p21cip abundance (D), as measured by immunofluorescence, compared to vehicle controls. Data are means ± SEM (n = 3 biological replicates per treatment; 12 to 20 images per sample). Scale bar, 40 μm. *P < 0.05 for TSP1 challenge compared to vehicle control by Student’s t test. DAPI, 4′,6-diamidino-2-phenylindole. (E) Effect of p53 knockdown by small interfering RNA (siRNA) on TSP1-induced senescence in HPAECs. Graphical data are means ± SEM (n = 3 biological replicates per treatment). Scale bar, 40 μm. *P < 0.05 for TSP1 challenge compared to vehicle control; #P < 0.05 for p53 siRNA-TSP1 compared to scrambled siRNA (SCR)–TSP1 by one-way analysis of variance (ANOVA). (F) mRNA expression of p53 and p21cip in middle-aged TSP1−/− animals. Data are means ± SEM (n = 3 individual animals for each group). *P < 0.05 compared to wild-type by Student’s t test. (G) Abundance of p21cip and total and phospho-p53 in middle-aged TSP1−/− lungs compared to wild-type, age-matched controls. Graphical data are means ± SEM (n = 6 animals per group). *P < 0.05 for TSP1−/−compared to wild-type by Student’s t test.
Fig. 4
Fig. 4. TSP1 induces Nox1-dependent O2•− production in HPAECs through its receptor CD47
Data for TSP1−/− samples are shown in purple; data for cell experiments are shown in red; data in gray are the corresponding controls. (A and B) NADPH-driven O2•− production, as measured by cytochrome c reduction assay in HPAECs exposed to TSP1 in the presence or absence of a specific CD47 blocking antibody (Ab) (A) or the CD47-activating peptide 7N3 (B). Data are means ± SEM (n = 3 biological replicates per treatment). *P < 0.05 for TSP1 challenge compared to vehicle control (veh) by one-way ANOVA and t test, respectively. (C) TSP1-induced O2•− production in HPAECs exposed to a specific SIRPα blocking antibody. Data are means ± SEM (n = 3 biological replicates per treatment). *P < 0.05 for TSP1 challenge compared to vehicle control by one-way ANOVA. (D) TSP1-induced O2•− production in HPAECs exposed to inhibitors of eNOS (L-NAME), mitochondrial complex I [rotenone (Rot)], or xanthine oxidase [oxypurinol (Oxy)]. Data are means ± SEM (n = 3 biological replicates per treatment). *P < 0.05 for TSP1 challenge compared to inhibitor vehicle control; #P < 0.05 for inhibitor compared to TSP1-vehicle by Student’s t test. (E) TSP1-induced O2•− production in HPAECs pretreated with the Nox1- and Nox2- specific inhibitory peptides, NoxA1ds (left) or Nox2ds-tat (right) or their respective scrambled controls (SCRAMB). Data are means ± SEM (n = 3 biological replicates per treatment). *P < 0.05 for TSP1 challenge compared to vehicle by one-way ANOVA. (F to H) Abundance in Nox family members in TSP1-challenged HPAECs, as assessed by Western blotting (F) and FACS (G). Graphical data are means ± SEM (n = 3 biological replicates per treatment). *P < 0.05 for TSP1 challenge compared to vehicle control by Student’s t test. For qRT-PCR analysis (H), *P < 0.05 indicates significance for TSP1 challenge compared to vehicle control by Mann-Whitney test. (I and J) Nox1 abundance in lungs of TSP1−/− mice and wild-type age-matched controls at the mRNA level as demonstrated by RT-PCR (I) and at the protein level as demonstrated by immunoblotting (J). Graphical data are means ± SEM (n = 3 to 6 animals per group). *P < 0.05 for TSP1−/− compared to wild-type control by Student’s t test.
Fig. 5
Fig. 5. Nox1 as a potential therapeutic target to inhibit matricellular-mediated endothelial senescence
Data for Nox1OE are shown in blue; data for Nox1/ samples are shown in orange; data for cell experiments are shown in red; data in gray are the corresponding controls. (A and B) Effect of human Nox1OE on SA-β-Gal staining and O2•− production. Graphical data are means ± SEM (n = 3 biological replicates per treatment). Scale bar, 40 μm. *P < 0.05 for Nox1 plasmid compared to empty plasmid control by Student’s t test. (C) NADPH-driven O2•− production, as measured by cytochrome c reduction assay in middle-aged wild-type and Nox1−/− mouse lungs. Left: Representative cytochrome c kinetic curve. Right: Quantification of O2•− production. Bar graphs are means ± SEM (n = 6 mice per group). *P < 0.05 compared to wild-type by Student’s t test. (D) mRNA expression of p53 and p21cip in wild-type and Nox1−/− mouse lungs. Data are the means ± SEM (n = 3 mice per group); *P < 0.05 compared to wild type by Student’s t test. (E to G) Effect of Nox1 inhibition (using NoxA1ds) on TSP1-induced cell cycle arrest in HPAECs, as measured by MTT assay (E), trypan blue exclusion assay (F), and cell cycle profile analysis (G). Graphical data are means ± SEM (n = 3 to 4 biological replicates per treatment). *P < 0.05 for TSP1 challenge compared to scrambled vehicle control (SCRAMB) by one-way ANOVA. (H) Activation of p53 (red), as assessed by nuclear localization (DAPI-labeled, blue) and p21cip immunofluorescence (green) in HPAECs challenged with TSP1 in the presence or absence of the Nox1 inhibitor NoxA1ds. Graphical data are means ± SEM (n = 3 biological replicates per treatment, 12 to 20 images per group). Scale bar, 50 μm. *P < 0.05 for TSP1 challenge compared to scrambled vehicle control by one-way ANOVA.
Fig. 6
Fig. 6. Potential clinical relevance of Nox1-mediated endothelial senescence in human pulmonary vascular tissue
Data points for human tissue are shown in green; data for cell experiments are shown in red; data in gray are the corresponding controls. Data for (A) to (E) are plotted as linear regression (n = 8 samples); equation, r2, and P values are indicated in the corresponding graph. (A and B) Correlation between NADPH-driven O2•− production, as measured by cytochrome c reduction (A), or H2O2 production, as measured by Amplex Red fluorescence (B), and age in human lung homogenates. (C and D) Abundance of Nox1 (C) and p53 and p21cip (D), as measured by Western blot of total homogenates of aging human lung. (E) Intimal immunofluorescence for Nox1 (top, green) and p21cip (bottom, red) in aged human lung sections. Scale bar, 50 μm. Graphs show linear regression analyses. (F) HPAEC senescence induced by TSP1 in the presence or absence of NoxA1ds, as measured by SA-β-Gal staining. Graphical data are means ± SEM (n = 3 biological replicates per treatment). Scale bar, 40 μm. *P < 0.05 for TSP1 challenge compared to scrambled vehicle control by Student’s t test.
Fig. 7
Fig. 7. A signaling model for TSP1-induced senescence
Upon binding to CD47, TSP1 activates the Nox1 complex, which generates robust and sustained accumulation of ROS. In turn, this triggers committed senescence through a pathway involving p53-p21cip–induced DNA damage response and decreased Rb phosphorylation. This pathway can be disrupted using the selective Nox1 inhibitor NoxA1ds.

References

    1. Christensen K, Doblhammer G, Rau R, Vaupel JW. Ageing populations: The challenges ahead. Lancet. 2009;374:1196–1208. - PMC - PubMed
    1. Tuder RM, Petrache I. Pathogenesis of chronic obstructive pulmonary disease. J Clin Invest. 2012;122:2749–2755. - PMC - PubMed
    1. Gellie A, Mills A, Levinson M, Stephenson G, Flynn E. Death: A foe to be conquered? Questioning the paradigm. Age Ageing. 2015;44:7–10. - PubMed
    1. Benetos A, Rossignol P, Cherubini A, Joly L, Grodzicki T, Rajkumar C, Strandberg TE, Petrovic M. Polypharmacy in the aging patient: Management of hypertension in octogenarians. JAMA. 2015;314:170–180. - PubMed
    1. Childs BG, Durik M, Baker DJ, van Deursen JM. Cellular senescence in aging and age-related disease: From mechanisms to therapy. Nat Med. 2015;21:1424–1435. - PMC - PubMed

MeSH terms