. 2018 Jan;16(1):32-46.
doi: 10.1158/1541-7786.MCR-17-0397. Epub 2017 Oct 17.

Differential Response of Glioma Stem Cells to Arsenic Trioxide Therapy Is Regulated by MNK1 and mRNA Translation

Affiliations

Differential Response of Glioma Stem Cells to Arsenic Trioxide Therapy Is Regulated by MNK1 and mRNA Translation

Jonathan B Bell et al. Mol Cancer Res. 2018 Jan.

Abstract

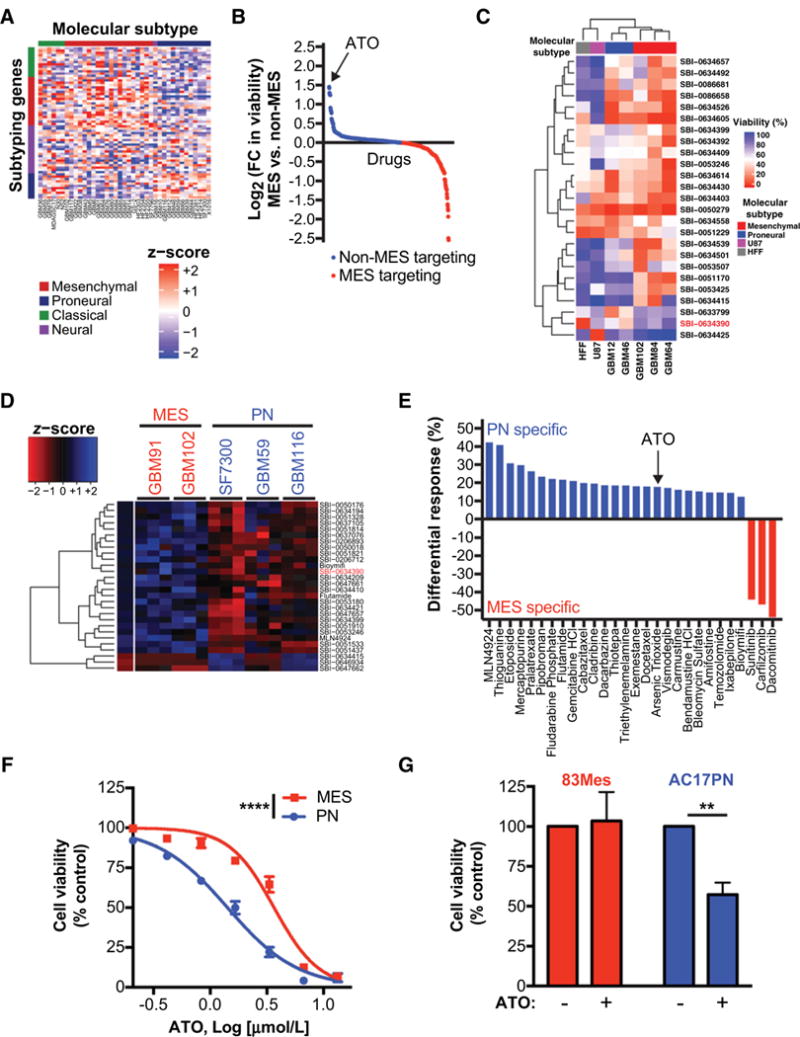
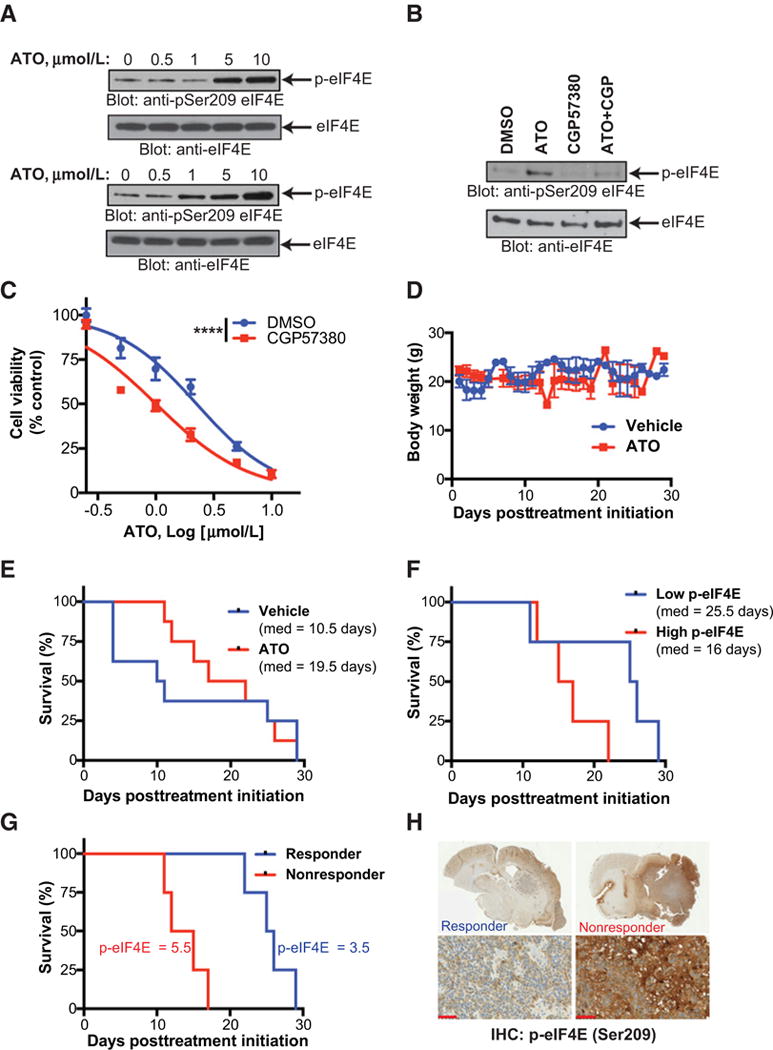
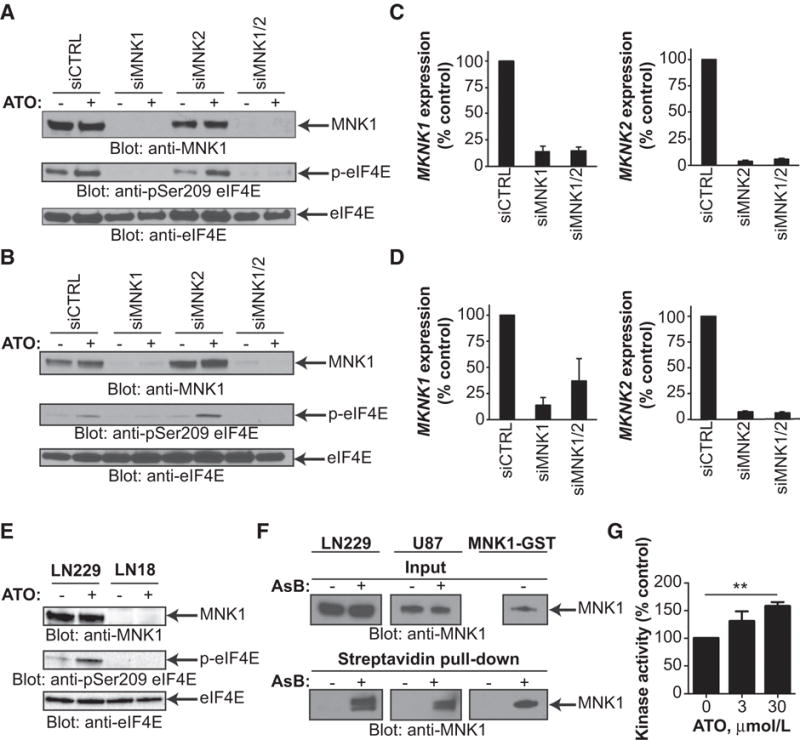
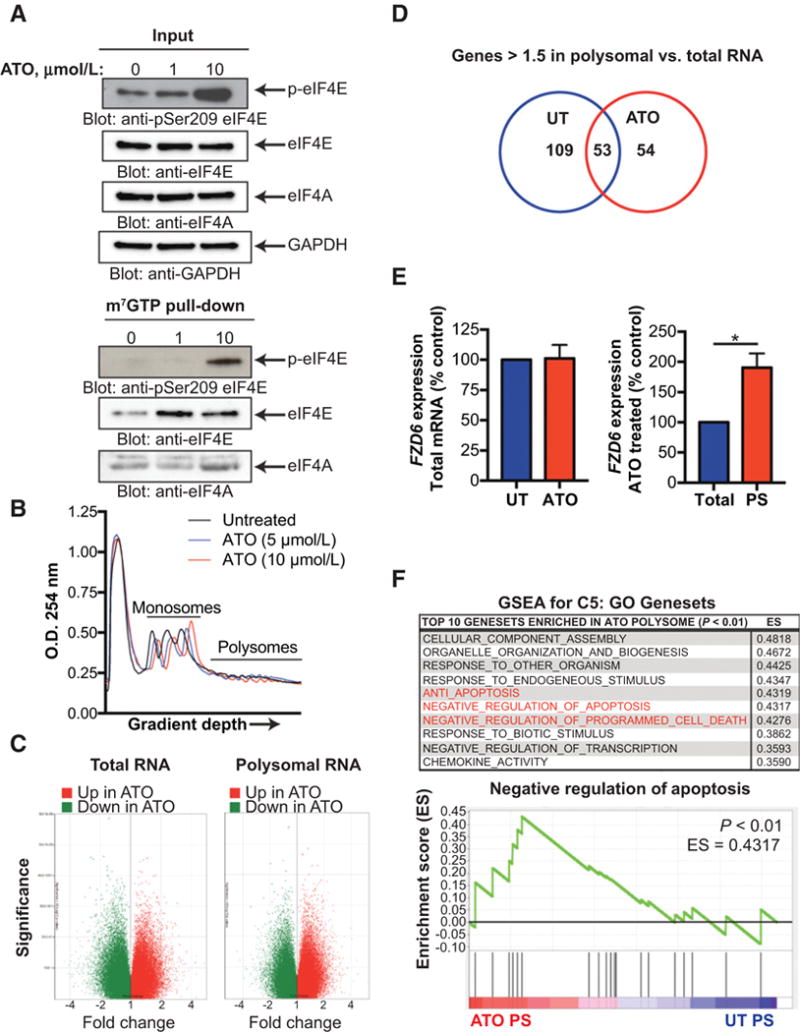
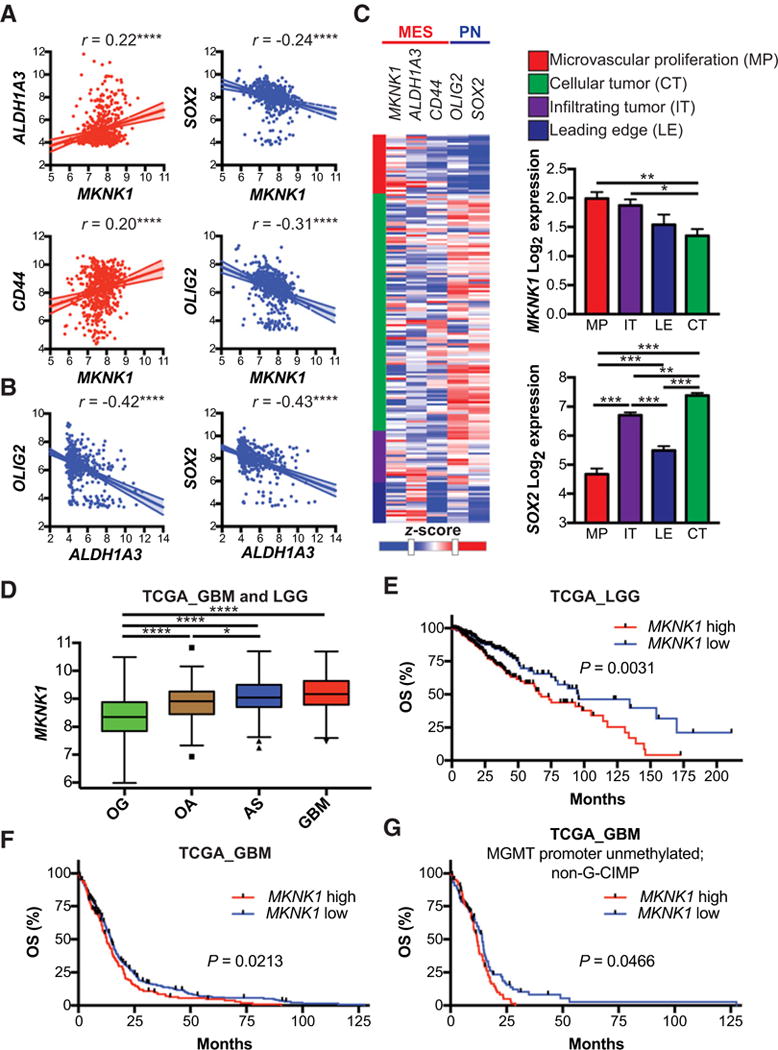
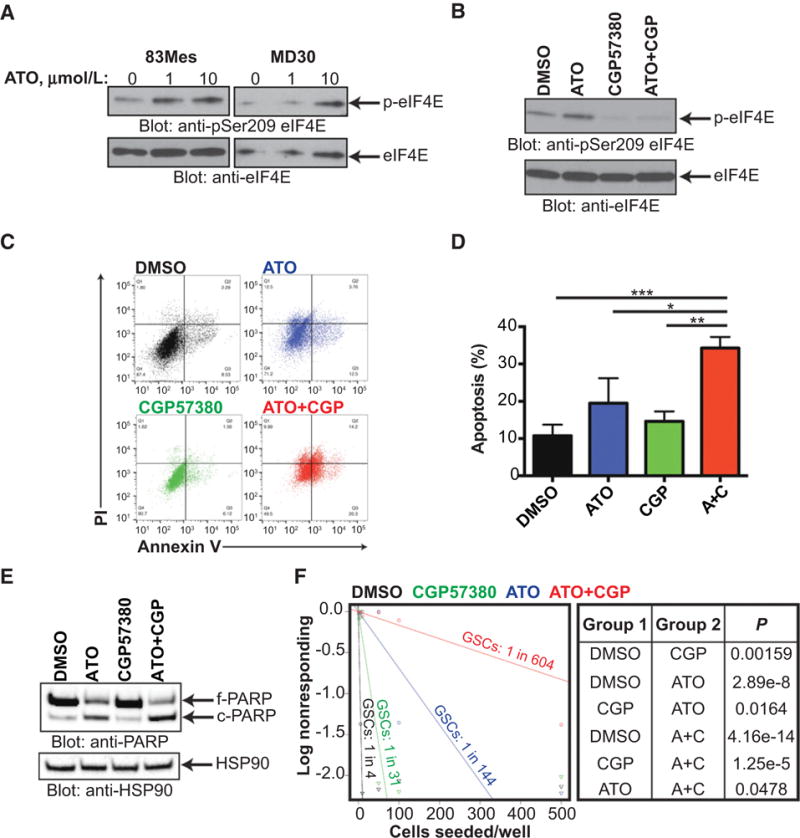
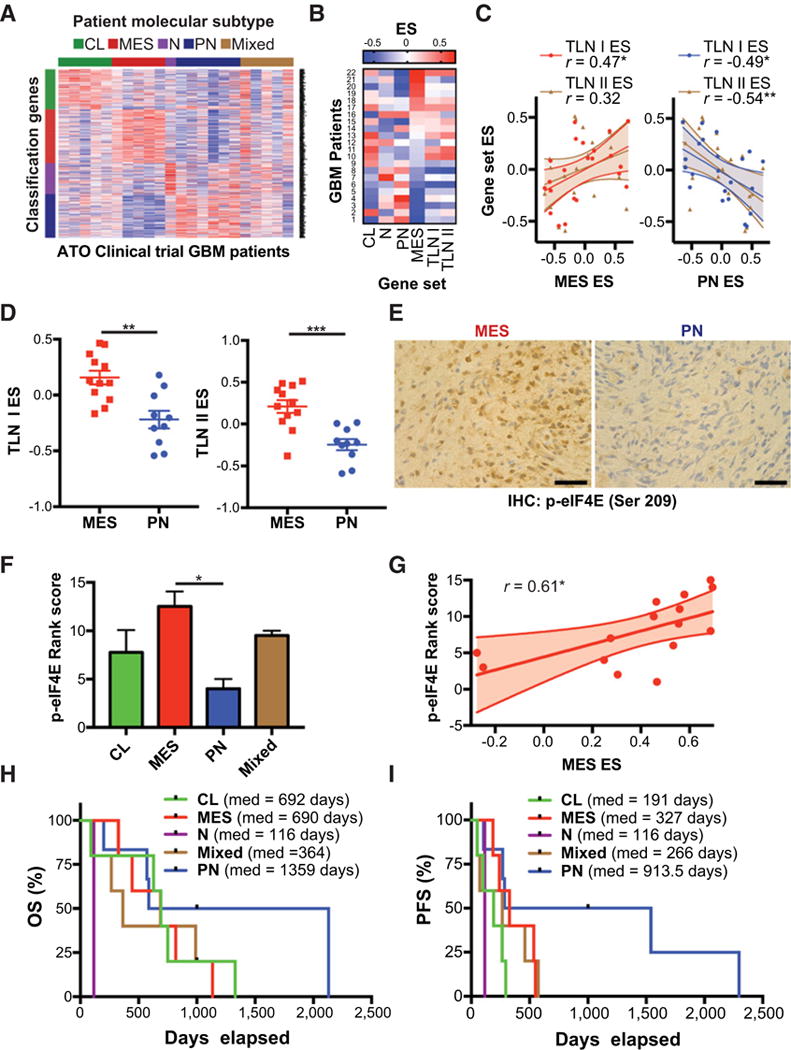
Mesenchymal (MES) and proneural (PN) are two distinct glioma stem cell (GSC) populations that drive therapeutic resistance in glioblastoma (GBM). We screened a panel of 650 small molecules against patient-derived GBM cells to discover compounds targeting specific GBM subtypes. Arsenic trioxide (ATO), an FDA-approved drug that crosses the blood-brain barrier, was identified as a potent PN-specific compound in the initial screen and follow-up validation studies. Furthermore, MES and PN GSCs exhibited differential sensitivity to ATO. As ATO has been shown to activate the MAPK-interacting kinase 1 (MNK1)-eukaryotic translation initiation factor 4E (eIF4E) pathway and subsequent mRNA translation in a negative regulatory feedback manner, the mechanistic role of ATO resistance in MES GBM was explored. In GBM cells, ATO-activated translation initiation cellular events via the MNK1-eIF4E signaling axis. Furthermore, resistance to ATO in intracranial PDX tumors correlated with high eIF4E phosphorylation. Polysomal fractionation and microarray analysis of GBM cells were performed to identify ATO's effect on mRNA translation and enrichment of anti-apoptotic mRNAs in the ATO-induced translatome was found. Additionally, it was determined that MNK inhibition sensitized MES GSCs to ATO in neurosphere and apoptosis assays. Finally, examination of the effect of ATO on patients from a phase I/II clinical trial of ATO revealed that PN GBM patients responded better to ATO than other subtypes as demonstrated by longer overall and progression-free survival.Implications: These findings raise the possibility of a unique therapeutic approach for GBM, involving MNK1 targeting to sensitize MES GSCs to drugs like arsenic trioxide. Mol Cancer Res; 16(1); 32-46. ©2017 AACR.


Conflict of interest statement

Disclosure of Potential Conflicts of Interest

P. Kumthekar is a medical advisory board member for Vivacitas; and is a consultant/advisory board member at Abbvie. J. Raizer is an Executive Medical Director at Celldex; reports receiving commercial research grants from Astra-Zeneca and Genentech; and is a consultant/advisory board member for Zio-Pharm. No potential conflicts of interest were disclosed by the other authors.

Figures

Figure 1
Figure 1
High-throughput screens identify differential ATO sensitivity in PN and MES GBM. A, RNA was extracted from orthotopically grown GBM PDX models. Transcriptomic profiling was performed using Agilent 44K array. Expression data was filtered for mouse contamination and molecular subtype analysis was performed using 66 subtype classification according to Verhaak et al. (22). B and C, Preliminary CellTiter-Glo viability screen was performed on short-term cultures of GBM PDX models, U87, and Human foreskin fibroblast (HFF) at 10 μmol/L. Only compounds with a statistically significant differential effect on cell viability are shown in the graph and heatmap. In this preliminary screen against 650 compounds, ATO (SBI-0634390; red) was identified as a small molecule with specificity towards non-MES GBM cells. D and E, ATO specificity was further validated by a secondary CellTiter-Glo viability screen, where selected 120 compounds were screened against short-term cultures of GBM PDX models at three different concentrations (0.1, 1, and 10 μmol/L). Only compounds with a statistically significant differential effect on cell viability are shown in the graph and heatmap. Averages for triplicates for each concentration are presented in the heatmap (D). Differential responses to compounds (E) show PN and MES specific compounds. F, Subtype-specific effects of ATO were further validated by performing dose-response experiments against selected MES and PN GBM ex vivo PDX models. Non-linear dose-response curve fit, F test,*****, P ≤ 0.0001. G, 83Mes and AC17PN GSCs were treated with ATO (1 μmol/L) for 5 days and cell viability was analyzed by WST-1 assay. Data represent means ± SEM of three independent experiments. Unpaired, two-tailed t test,**, P ≤ 0.01.
Figure 2
Figure 2
ATO activates MNK signaling in vitro and MNK activity is associated with poor response to ATO in vivo. A, U87 (top) and LN229 (bottom) cells were treated with increasing concentrations of ATO for 90 minutes. Whole cell lysates were subjected to immunoblotting with antibodies against phospho-eIF4E (Ser209) or eIF4E. B, Immunoblotting analysis as in (A). U87 cells were pretreated with CGP57380 (10 μmol/L) or DMSO for 1 hour followed by treatment with ATO (5 μmol/L) for 90 minutes. C, U87 cells were treated with increasing concentrations of ATO and CGP57380 (10 μmol/L) for 5 days and cell viability was analyzed by WST-1 assay. Data represent means ± SEM of three independent experiments. Nonlinear dose–response curve fit, F test, ****, P ≤ 0.0001. D and E, Nude mice were inoculated with a patient-derived xenograft via intracranial injection. After tumor formation, mice were randomized and treated with either vehicle control or ATO (5 mg/kg) three times per week. Body weight in vehicle control and ATO-treated mice is shown. Log-rank Mantel–Cox, P = 0.76. F, Brains were sectioned and stained with phospho-eIF4E (Ser209) antibody. Following staining, tumors were ranked blindly. Survival of mice with high (above the median) or low (below the median) phospho-eIF4E staining was compared. Log-rank Mantel–Cox, P = 0.10. G, Mice in the ATO treatment group with long survival (responders) or short survival (nonresponders) are shown. Log-rank Mantel–Cox, P = 0.007. H, Representative phospho-eIF4E staining from ATO responder and nonresponders is shown, scale bar = 50 μm.
Figure 3
Figure 3
MNK1 is required for ATO-induced eIF4E phosphorylation in GBM and arsenic binds to MNK1 and activates kinase activity. A and B, U87 (A) and LN229 (B) cells were transfected with control siRNA or siRNA targeting MNK1, MNK2, or combination. Cells were treated with or without ATO (2 μmol/L) for 90 minutes. Whole cell lysates were subjected to immunoblotting with antibodies against MNK1, phospho-eIF4E (Ser209), or eIF4E. C and D, Cells from A and B were collected and RNA was extracted. Expression of MKNK1 and MKNK2 genes was determined by qRT-PCR normalizing to GAPDH. Data represent means ± SEM of two independent experiments. E, LN229 (MNK1 expressing) or LN18 (MNK1 undetectable) cells were treated with or without ATO (5 μmol/L) for 90 minutes. Whole cell lysates were subjected to SDS-PAGE followed by transfer to PVDF membranes. Membranes were incubated with antibodies against phospho-eIF4E (Ser209), eIF4E, or MNK1. F, LN229, U87, or recombinant MNK1-GST protein were treated with DMSO or the biotinylated arsenic compound, As-Biotin (AsB), for 2 hours. Whole cell lysates or recombinant protein were incubated with streptavidin beads overnight. Streptavidin pull-down and input control were subjected to immunoblotting with an antibody against MNK1. G, Recombinant MNK1-GST protein was treated with increasing concentrations of ATO for 30 minutes in the presence of the MNK1 peptide substrate, EIF2S. Kinase activity was assessed using the ADP-Glo Kinase Assay. Data represent means ± SEM of three independent experiments. Unpaired, two-tailed t test, **, P ≤ 0.01.
Figure 4
Figure 4
Polysomal profiling reveals ATO-induced translatome in GBM. A, LN229 cells were treated with increasing concentrations of ATO for 6 hours. Whole cell extracts were incubated with m7GTP-Agarose beads overnight. m7GTP-Agarasoe pull-down and input control were subjected to SDS-PAGE followed by immunoblotting with antibodies against phospho-eIF4E (Ser209), eIF4E, eIF4A, or GAPDH. B, LN229 cells were treated with increasing concentrations of ATO for 6 hours. Following treatment, cells were lysed with hypotonic lysis buffer, separated by a sucrose gradient (10–50%), and the O.D. 254 nm was analyzed. Graph represents O.D. as a function of gradient depth. C and D, LN229 cells were treated as in B. Total and polysomal mRNA were isolated and transcript expression was analyzed using the Clariom D microarray. Coding genes up- or downregulated after ATO treatment in polysomal and total RNA are shown. Genes >1.5 times increased in polysomal RNA as compared to total RNA for untreated and ATO treated cells are shown in the Venn diagram. E, Total and polysomal mRNA (as in B) was isolated and pooled and relative FZD6 mRNA expression was determined by qRT-PCR using GAPDH for normalization. Data represent means ± SEM of three independent experiments. Unpaired, two-tailed t test,*, P ≤ 0.05. F, Gene expression of ATO polysomes and total polysomes was analyzed by GSEA. The top 10 C5: GO gene sets enriched in ATO polysomes as compared to untreated polysomes are listed. Gene sets involved in apoptosis or cell death are highlighted in red. Enrichment plot of the negative regulation of apoptosis (GO:0043066) gene set in untreated and ATO polysomes is shown. Nominal P < 0.01.
Figure 5
Figure 5
Expression of MES GSC markers correlate with MKNK1 and MKNK1 expression predicts poor survival in GBM patients. A and B, Multiple correlation analysis of MES and PN GSC markers in TCGA patients. Pearson’s correlation analysis,****, P ≤ 0.0001. C, Heatmap showing expression of MKNK1, MES GSC markers (ALDH1A3, CD44) and PN GSC markers (OLIG2, SOX2) in different tumor regions: microvascular proliferation (MP), infiltrating tumor (IT), leading edge (LE), and cellular tumor (CT). Bar graphs depict summarized data from heatmap. Comparisons between MKNK1 and SOX2 means in different tumor regions is shown with Tukey’s honest significant difference test,*, P ≤ 0.05; **, P ≤ 0.01;***, P ≤ 0.001. D, Expression of MKNK1 in GBM and low-grade gliomas: oligodendroglioma (OG), oligoastrocytoma (OA), and astrocytoma (AS). One-way ANOVA,*, P ≤ 0.05;****, ≤ 0.0001. E and F, Overall survival (OS) analysis of low-grade glioma (E), all GBM (F), and MGMT promoter unmethylated; non-G-CIMP GBM (G) patients with high and low expression of MKNK1 (MNK1). Log-rank (Mantel-Cox) test P-values are shown. Expression data downloaded from GlioVis (http://gliovis.bioinfo.cnio.es; ref. 57). Heatmap generated using the IVY Glioblastoma Project. ©2015 Allen Institute for Brain Science. Ivy Glioblastoma Atlas Project. Available from: glioblastoma.alleninstitute.org.
Figure 6
Figure 6
MNK inhibition sensitizes MES GSCs to ATO in neurosphere formation and apoptosis assays. A, 83Mes cells were treated with increasing concentrations of ATO for 90 minutes and whole cell lysates were subjected to immunoblotting with antibodies against phospho-eIF4E (Ser209) or eIF4E. B, 83Mes cells were pre-treated with CGP57380 (10 μmol/L) or DMSO for 1 hour followed by treatment with ATO (5 μmol/L) for 90 minutes and subjected to immunoblotting with antibodies against phospho-eIF4E (Ser209) or eIF4E. C, 83Mes cells were treated with DMSO, ATO (5 μmol/L), CGP57380 (10 μmol/L), or combination for 2 days. After treatment, apoptosis was assessed by co-staining cells with propidium iodide (PI) and Annexin V-FITC followed by flow cytometry analysis. Representative dot plots are shown. D, Annexin V positive cells from (C) were quantified to determine total apoptosis. Data represent means ± SEM of four independent experiments. Paired two tailed t test,*, P ≤ 0.05;**, P ≤ 0.01;***, P ≤ 0.001. E, 83Mes cells were treated as in (D) and whole cell lysates were subjected to immunoblotting with antibodies against PARP or HSP90. F, 83Mes cells were seeded into 96-well round-bottom plates at densities ranging from 1 to 500 cells per well in the presence of DMSO, ATO (5 μmol/L), CGP57380 (10 μmol/L), or combination. After 1 week incubation, neurospheres were stained with acridine orange and neurosphere formation was assessed and extreme limiting dilution analysis (ELDA) was performed (http://bioinf.wehi.edu.au/software/elda/; ref. 27). P-values from chi-square analysis are shown.
Figure 7
Figure 7
PN GBM phenotype associated with improved outcomes in ATO clinical trial. A, Tumor samples from 22 patients enrolled in a phase I/II trial of Trisenox (ATO) were analyzed by RNA-sequencing to determine molecular subtyping according to Verhaak et al. [22]. B and C, Gene set variation analysis (GSVA) of 22 patient samples. Heatmap shows GSVA enrichment scores for patients ranked according to MES ES. Pearson’s correlation analysis shows relationship between MES enrichment score (MES ES) or PN enrichment score (PN ES) and translation enrichment scores (TLN I ES, TLN II ES),*, P ≤ 0.05. D, Comparison of translation gene set enrichment scores in patients subtyped according to Carro et al. (41) (MES vs. PN). Unpaired, two-tailed t test **, P ≤ 0.01;***, P ≤ 0.001. E and F, Tumor samples were analyzed by phospho-eIF4E IHC and ranked per staining intensity. Representative phospho-eIF4E staining from MES and PN GBM patients are shown, scale bar = 50 μm. Mean staining rank score are shown for each subtype with available tumor with higher rank score corresponding with higher phospho-eIF4E intensity. One-way ANOVA,*, P ≤ 0.05. G, Correlation analysis shows relationship between MES ES and phospho-eIF4E staining rank score, *, P ≤ 0.05. H and I, Overall survival (OS) and PFS analyses for different molecular subtypes are shown.

Similar articles

Cited by

References

    1. Nakano I. Stem cell signature in glioblastoma: therapeutic development for a moving target. J Neurosurg. 2015;122:324–30. - PubMed
    1. Mao P, Joshi K, Li J, Kim SH, Li P, Santana-Santos L, et al. Mesenchymal glioma stem cells are maintained by activated glycolytic metabolism involving aldehyde dehydrogenase 1A3. Proc Natl Acad Sci U S A. 2013;110:8644–9. - PMC - PubMed
    1. Segerman A, Niklasson M, Haglund C, Bergstrom T, Jarvius M, Xie Y, et al. Clonal variation in drug and radiation response among glioma-initiating cells is linked to proneural-mesenchymal transition. Cell Rep. 2016;17:2994–3009. - PubMed
    1. Patel AP, Tirosh I, Trombetta JJ, Shalek AK, Gillespie SM, Wakimoto H, et al. Single-cell RNA-seq highlights intratumoral heterogeneity in primary glioblastoma. Science. 2014;344:1396–401. - PMC - PubMed
    1. Au WY, Tam S, Fong BM, Kwong YL. Determinants of cerebrospinal fluid arsenic concentration in patients with acute promyelocytic leukemia on oral arsenic trioxide therapy. Blood. 2008;112:3587–90. - PubMed

Publication types

MeSH terms

Substances