. 2017 Oct 17;8(5):e01343-17.
doi: 10.1128/mBio.01343-17.

Impact of Dietary Resistant Starch on the Human Gut Microbiome, Metaproteome, and Metabolome

Affiliations

Impact of Dietary Resistant Starch on the Human Gut Microbiome, Metaproteome, and Metabolome

Tanja V Maier et al. mBio. .

Abstract

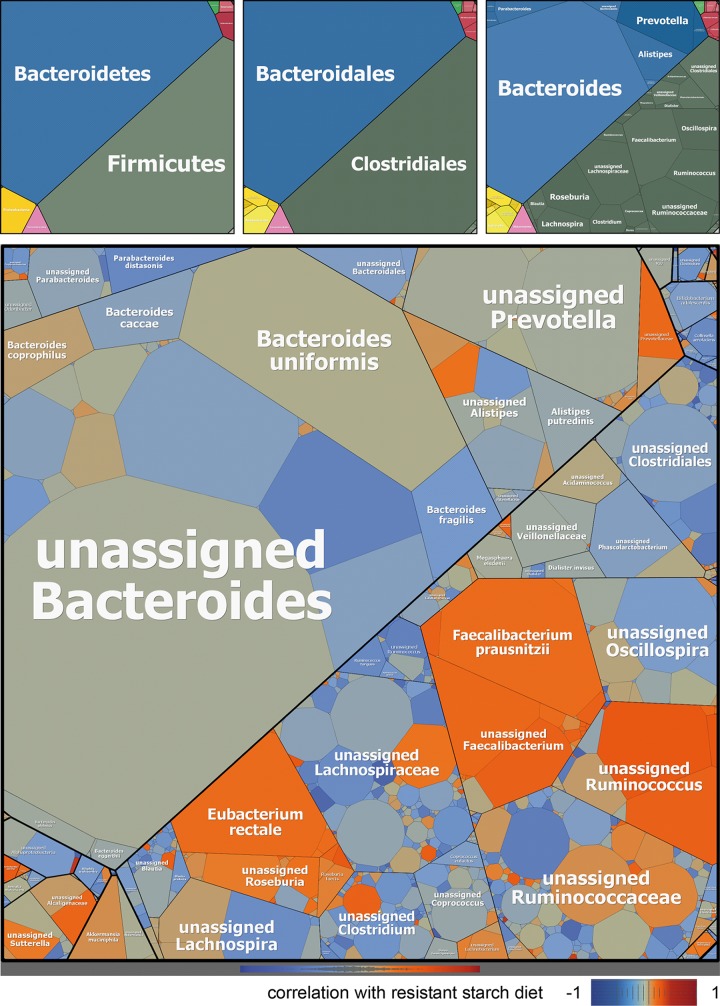
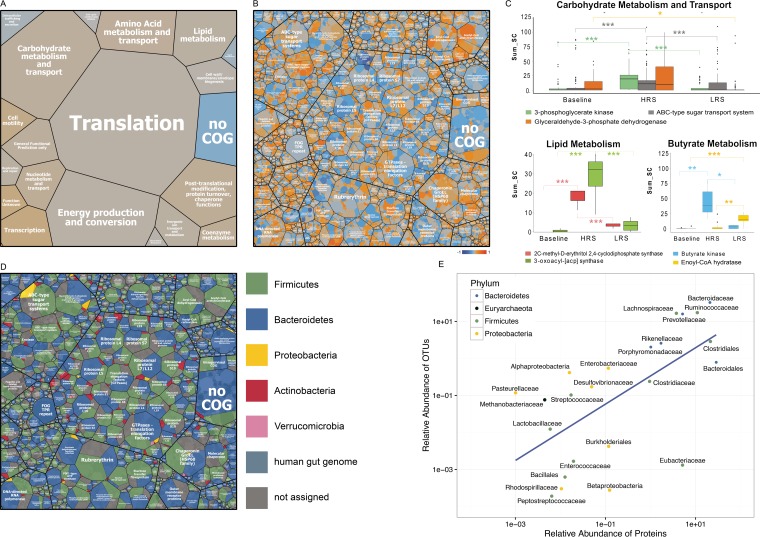
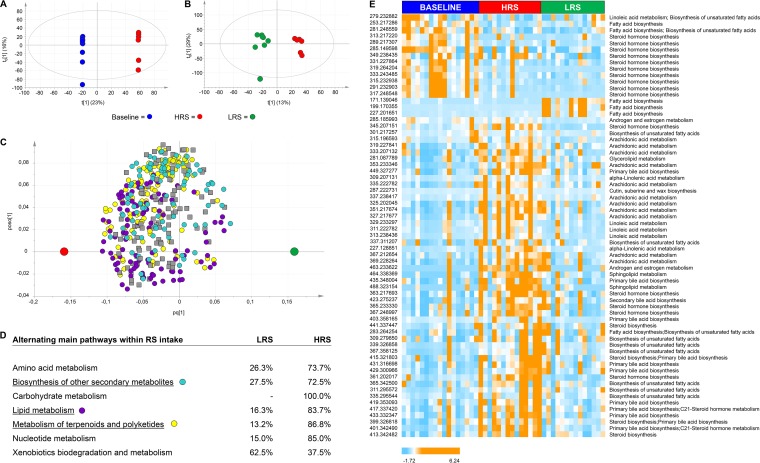
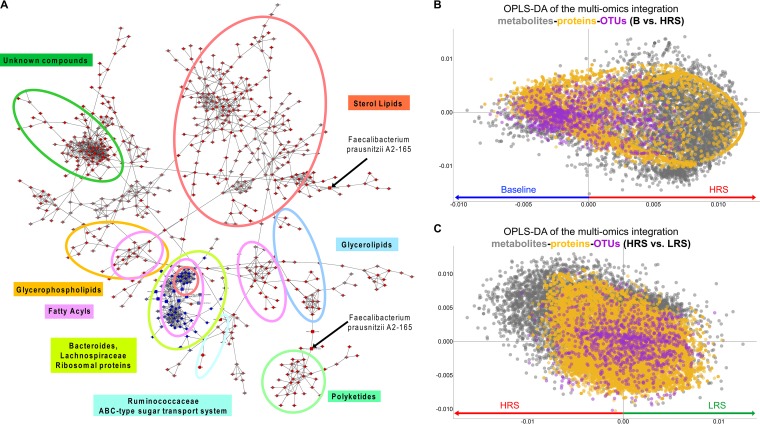
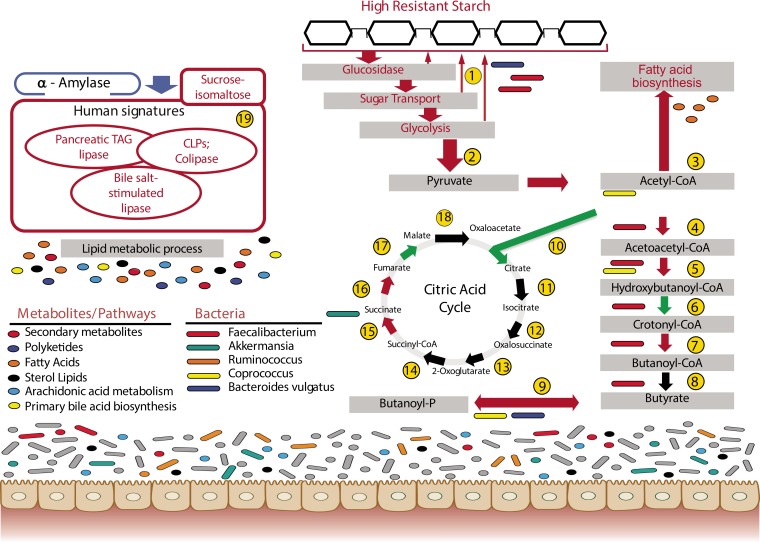
Diet can influence the composition of the human microbiome, and yet relatively few dietary ingredients have been systematically investigated with respect to their impact on the functional potential of the microbiome. Dietary resistant starch (RS) has been shown to have health benefits, but we lack a mechanistic understanding of the metabolic processes that occur in the gut during digestion of RS. Here, we collected samples during a dietary crossover study with diets containing large or small amounts of RS. We determined the impact of RS on the gut microbiome and metabolic pathways in the gut, using a combination of "omics" approaches, including 16S rRNA gene sequencing, metaproteomics, and metabolomics. This multiomics approach captured changes in the abundance of specific bacterial species, proteins, and metabolites after a diet high in resistant starch (HRS), providing key insights into the influence of dietary interventions on the gut microbiome. The combined data showed that a high-RS diet caused an increase in the ratio of Firmicutes to Bacteroidetes, including increases in relative abundances of some specific members of the Firmicutes and concurrent increases in enzymatic pathways and metabolites involved in lipid metabolism in the gut.IMPORTANCE This work was undertaken to obtain a mechanistic understanding of the complex interplay between diet and the microorganisms residing in the intestine. Although it is known that gut microbes play a key role in digestion of the food that we consume, the specific contributions of different microorganisms are not well understood. In addition, the metabolic pathways and resultant products of metabolism during digestion are highly complex. To address these knowledge gaps, we used a combination of molecular approaches to determine the identities of the microorganisms in the gut during digestion of dietary starch as well as the metabolic pathways that they carry out. Together, these data provide a more complete picture of the function of the gut microbiome in digestion, including links between an RS diet and lipid metabolism and novel linkages between specific gut microbes and their metabolites and proteins produced in the gut.

Keywords: gut microbiome; human microbiome; multiomics; resistant starch.


Figures

FIG 1
FIG 1
Map of the microbiome corresponding to dietary resistant starch (RS) levels. Average relative abundances of taxa are based on 16S rRNA gene sequences from all samples: the larger the cells, the greater the overall abundance of operational taxonomic units (OTUs) in that particular taxonomic category averaged across all samples in this study. Maps on top from left to right specify phylum, order, and genus. The map on the bottom visualizes averaged Pearson correlation coefficients from all samples that were calculated from relative OTU abundances versus the approximate amount of RS in each diet: 0 (baseline), 0.05 (LRS), and 1 (HRS).
FIG 2
FIG 2
Map of the metaproteome corresponding to dietary resistant starch (RS) levels and assignment of proteins to bacterial phyla. (A) Functional assignments (Clusters of Orthologous Groups [COGs]) of all bacterial proteins across all samples. Cell sizes correspond to averaged protein abundances. (B) Protein functions are shown at a more detailed level. For panels A and B, averaged Pearson correlation coefficients from all individuals were calculated from relative protein abundances versus the approximate amount of RS in each diet: 0 (baseline), 0.05 (LRS), and 1 (HRS). The color scale for the Pearson correlation coefficients is as follows: −1, dark blue, negatively correlated with resistant starch concentration; 0, gray; 1, orange, positively correlated with resistant starch concentration. (C) Examples of specific proteins that significantly differed according to diet (post hoc Kruskal-Nemenyi test; *, P < 0.05; **, P < 0.01; ***, P < 0.001). (D) Bacterial taxa that were assigned to the same proteins as shown in panel B were partitioned and color coded according to bacterial phyla. (E) Correlation of the most common OTUs and corresponding proteins, labeled at the family level and colored at phylum level.
FIG 3
FIG 3
Significant differences in fecal metabolite compositions between diets. (A) OPLS-DA score scatter plot comparing baseline diet (blue) versus HRS diet (red); Q²(cum) = 0.8 and R2Y(cum) = 1. (B) OPLS-DA score scatter plot comparing LRS diet (green) with HRS diet (red); Q²(cum) = 0.6 and R2Y(cum) = 0.9. (A and B) t[1] represents the first component; t0[1] expresses the variance orthogonal to the variable Y (class). (C) OPLS-DA loading scatter plot of metabolites assigned to biosynthesis of other secondary metabolites (cyan), lipid metabolism (purple), and metabolism of terpenoids and polyketides (yellow). (D) Alternating main pathways within different diets (HRS versus LRS); Q²(cum) = 0.6 and R2Y(cum) = 0.3. (E) Euclidean distance hierarchical clustering analysis visualizing the different intensity levels of compounds related to lipid metabolism related in specific diet classes.
FIG 4
FIG 4
Multiomics data integration for different diet categories. (A) Network following HRS diet. Similarities (edges) within and between species, proteins, and metabolites (circles, squares, and triangles, respectively) across participants and time points, including only nodes significantly higher (red) or lower (blue) in HRS than baseline (two-sided t test; P < 0.05). (B) OPLS-DA plot of all data (features: metabolites, 5,552; proteome, 57,397; OTUs, 1,107) for baseline (blue, negative x axis) versus HRS (red, positive x axis); P = 8.3 × 10⁻⁶ (CV-ANOVA); R2Y(cum) = 0.96; Q2(cum) = 0.88. (C) OPLS-DA plot for HRS (red, negative x axis) versus LRS (green, positive x axis); P = 0.026 (CV-ANOVA); R2Y(cum) = 0.883; Q2(cum) = 0.534.
FIG 5
FIG 5
Overview of detected enzymes, pathways, species, and metabolites that were significantly impacted by a resistant starch diet. Red arrows/frames, increased in HRS; blue frames, decreased in HRS; black arrows, not detected or not increased in HRS over baseline; green arrows/frames, increased in LRS. 1, starch and sucrose metabolism; 2, glycolysis from glucose to pyruvate; 3, 3-oxoacyl-(acyl carrier protein) synthase; 4, acetyl-CoA acetyltransferase; 5, 3-hydroxyacyl-CoA dehydrogenase; 6, enoyl-CoA hydratase; 7, enoyl-(acyl carrier protein) reductase (NADH); 8, acetate CoA-transferase; 9, butyrate kinase; 10, citrate synthase; 11, aconitate hydratase; 12 and 13, isocitrate dehydrogenase; 14, 2-ketoglutarate ferredoxin oxidoreductase; 15, succinyl-CoA synthetase; 16, succinate dehydrogenase/fumarate reductase; 17, fumarate hydratase; 18, malate dehydrogenase; 19, human enzymes.

Similar articles

Cited by

References

    1. Scott KP, Gratz SW, Sheridan PO, Flint HJ, Duncan SH. 2013. The influence of diet on the gut microbiota. Pharmacol Res 69:52–60. doi: 10.1016/j.phrs.2012.10.020. - DOI - PubMed
    1. Walker AW, Ince J, Duncan SH, Webster LM, Holtrop G, Ze X, Brown D, Stares MD, Scott P, Bergerat A, Louis P, McIntosh F, Johnstone AM, Lobley GE, Parkhill J, Flint HJ. 2011. Dominant and diet-responsive groups of bacteria within the human colonic microbiota. ISME J 5:220–230. doi: 10.1038/ismej.2010.118. - DOI - PMC - PubMed
    1. Flint HJ, Scott KP, Duncan SH, Louis P, Forano E. 2012. Microbial degradation of complex carbohydrates in the gut. Gut Microbes 3:289–306. doi: 10.4161/gmic.19897. - DOI - PMC - PubMed
    1. Upadhyaya B, McCormack L, Fardin-Kia AR, Juenemann R, Nichenametla S, Clapper J, Specker B, Dey M. 2016. Impact of dietary resistant starch type 4 on human gut microbiota and immunometabolic functions. Sci Rep 6:28797. doi: 10.1038/srep28797. - DOI - PMC - PubMed
    1. Martínez I, Kim J, Duffy PR, Schlegel VL, Walter J. 2010. Resistant starches types 2 and 4 have differential effects on the composition of the fecal microbiota in human subjects. PLoS One 5:e15046. doi: 10.1371/journal.pone.0015046. - DOI - PMC - PubMed

Publication types

MeSH terms