. 2017 Oct 31;114(44):E9338-E9345.
doi: 10.1073/pnas.1710358114. Epub 2017 Oct 17.

In vitro reconstitution of T cell receptor-mediated segregation of the CD45 phosphatase

Affiliations

In vitro reconstitution of T cell receptor-mediated segregation of the CD45 phosphatase

Catherine B Carbone et al. Proc Natl Acad Sci U S A. .

Abstract

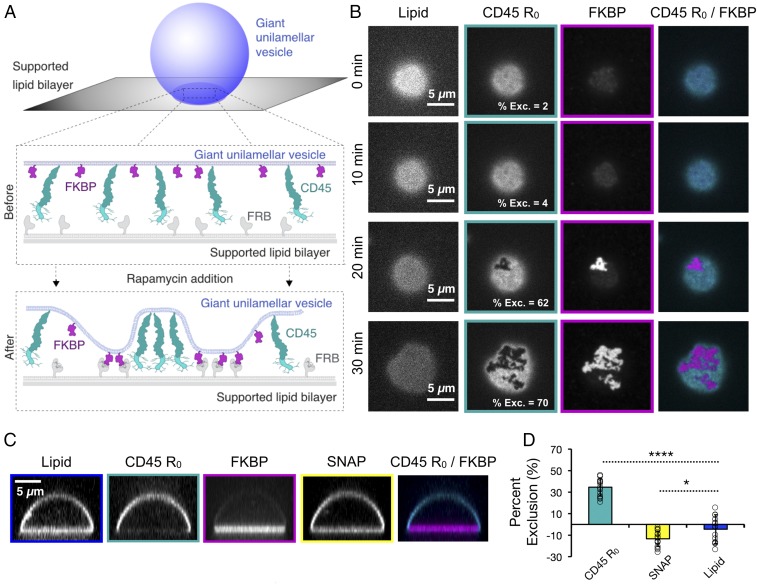
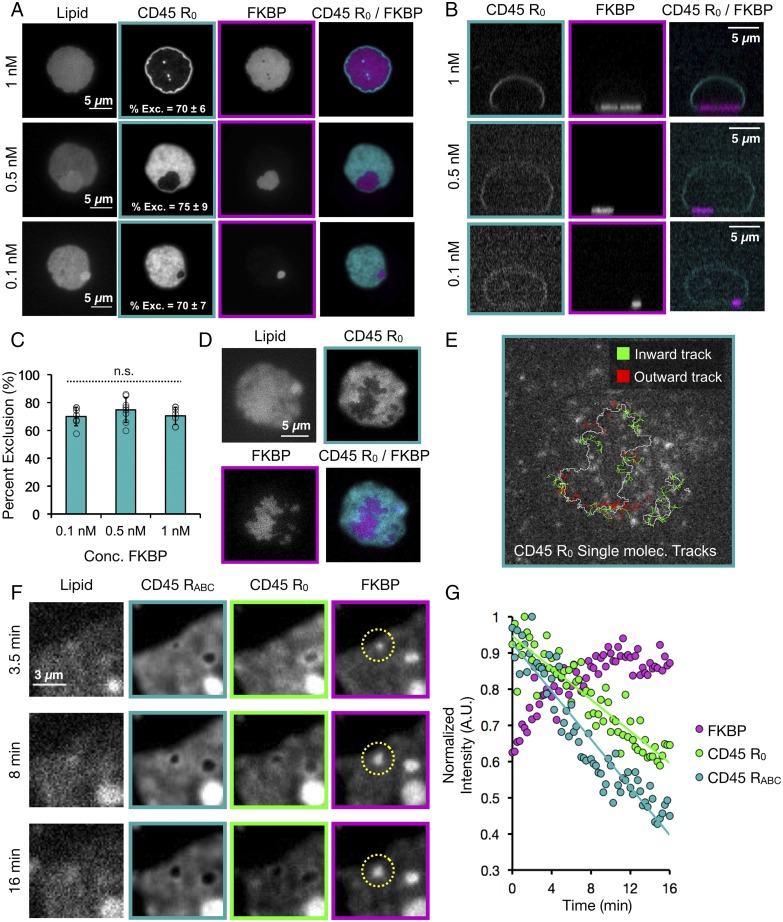
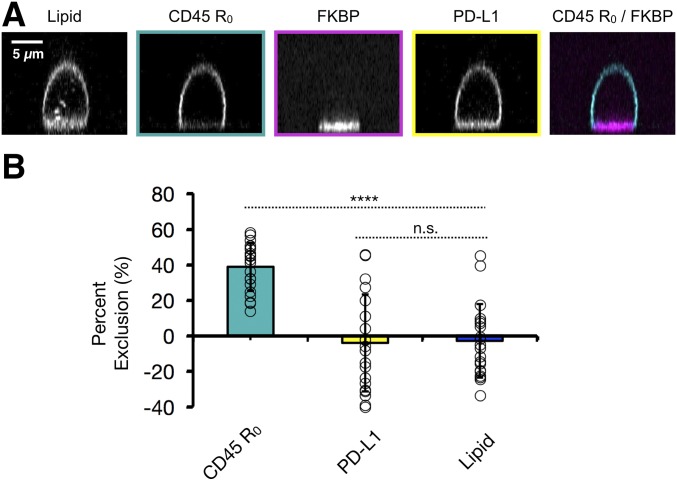
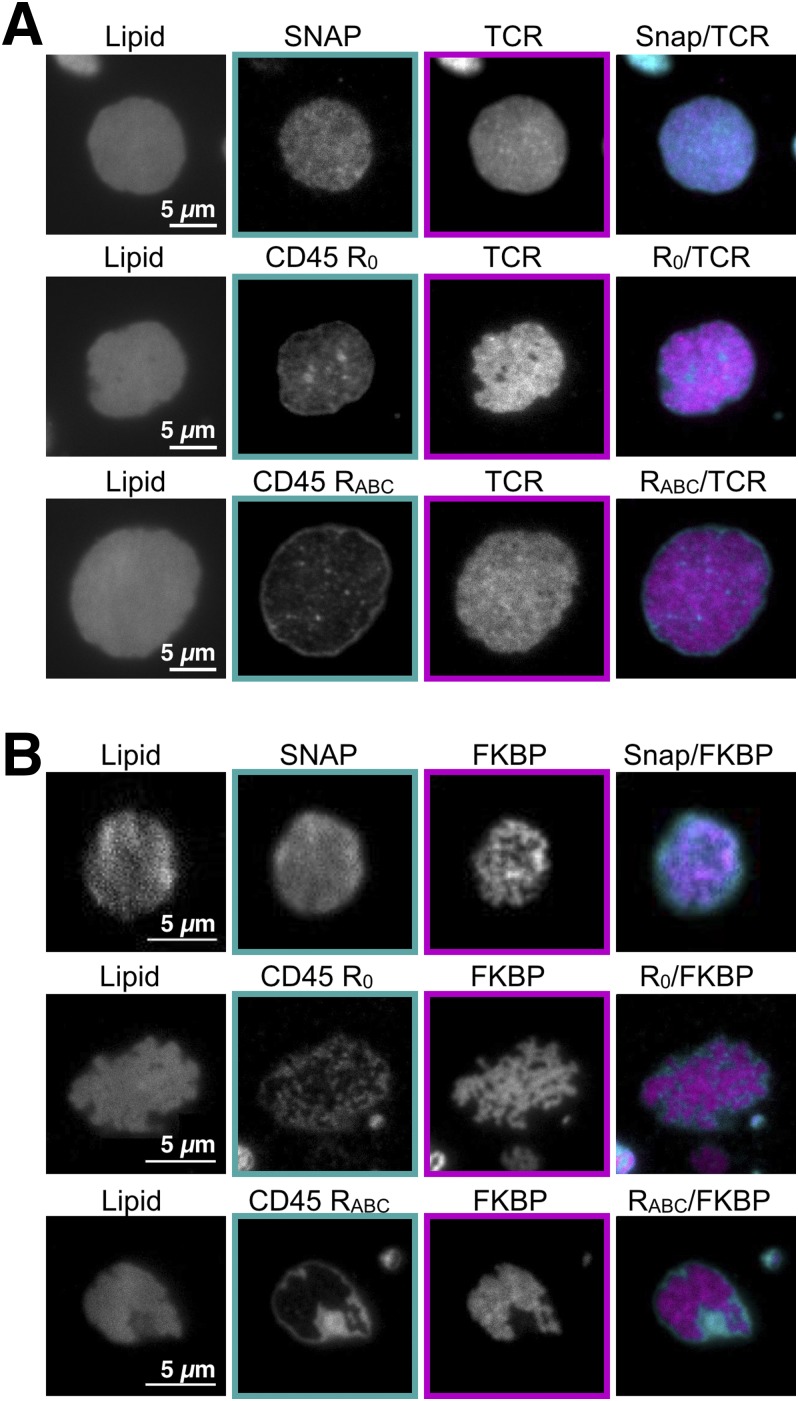
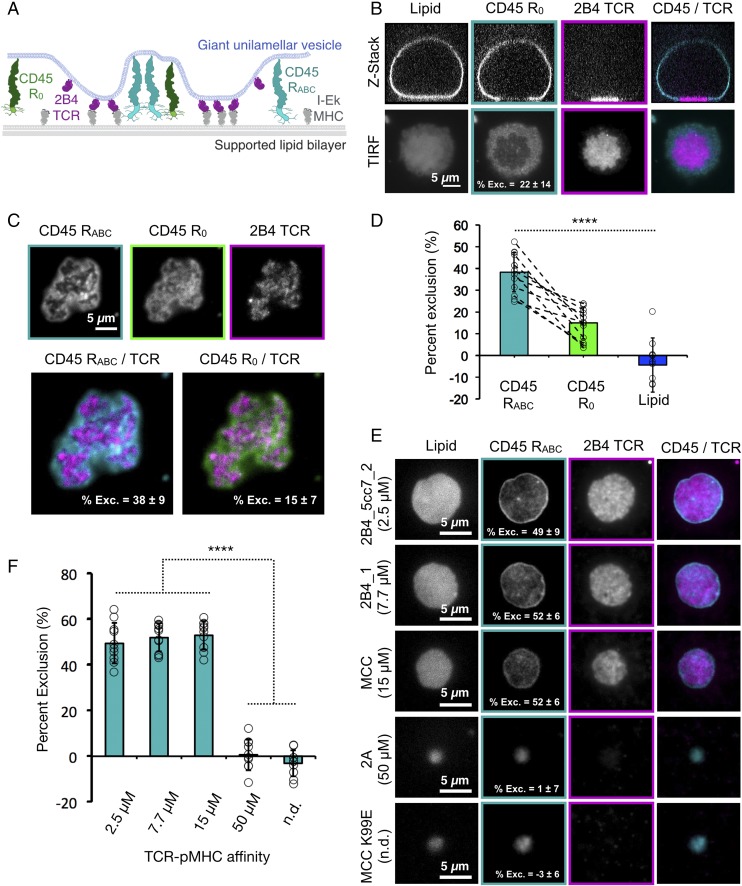
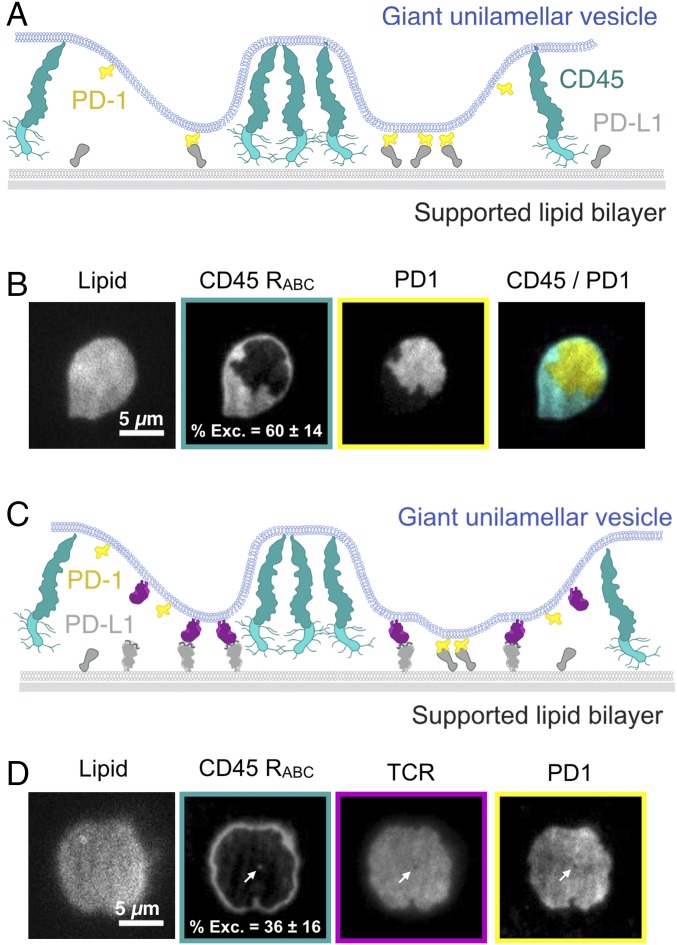
T cell signaling initiates upon the binding of peptide-loaded MHC (pMHC) on an antigen-presenting cell to the T cell receptor (TCR) on a T cell. TCR phosphorylation in response to pMHC binding is accompanied by segregation of the transmembrane phosphatase CD45 away from TCR-pMHC complexes. The kinetic segregation hypothesis proposes that CD45 exclusion shifts the local kinase-phosphatase balance to favor TCR phosphorylation. Spatial partitioning may arise from the size difference between the large CD45 extracellular domain and the smaller TCR-pMHC complex, although parsing potential contributions of extracellular protein size, actin activity, and lipid domains is difficult in living cells. Here, we reconstitute segregation of CD45 from bound receptor-ligand pairs using purified proteins on model membranes. Using a model receptor-ligand pair (FRB-FKBP), we first test physical and computational predictions for protein organization at membrane interfaces. We then show that the TCR-pMHC interaction causes partial exclusion of CD45. Comparing two developmentally regulated isoforms of CD45, the larger RABC variant is excluded more rapidly and efficiently (∼50%) than the smaller R0 isoform (∼20%), suggesting that CD45 isotypes could regulate signaling thresholds in different T cell subtypes. Similar to the sensitivity of T cell signaling, TCR-pMHC interactions with Kds of ≤15 µM were needed to exclude CD45. We further show that the coreceptor PD-1 with its ligand PD-L1, immunotherapy targets that inhibit T cell signaling, also exclude CD45. These results demonstrate that the binding energies of physiological receptor-ligand pairs on the T cell are sufficient to create spatial organization at membrane-membrane interfaces.

Keywords: CD45; PD-1; TCR; kinetic segregation; signaling.


Conflict of interest statement

The authors declare no conflict of interest.

Figures

Fig. 1.
Fig. 1.
Receptor–ligand binding induces CD45 segregation at membrane interfaces. (A) Schematic of rapamycin-induced receptor–ligand (FKBP–FRB) binding and CD45 R0 segregation between a GUV and an SLB. (B) TIRF microscopy of a GUV–SLB interface at the indicated times after rapamycin addition, showing the concentration of FKBP into microdomains that exclude CD45 R0. The percent of CD45 R0 exclusion is indicated for each image shown. (C) Spinning-disk z-sections of GUVs after membrane-apposed interfaces have reached equilibrium, showing localization of FKBP to the membrane interface, localization of CD45 R0 away from the interface, and uniform distribution of SNAP. (D) Quantification of experiment shown in C; data are shown as mean ± SD (n = 17 GUVs pooled from two experiments). *P < 0.05; ****P < 0.0001; t test.
Fig. 2.
Fig. 2.
Characterization of partitioned GUV–SLB membrane–membrane interfaces. (A) Titration of FKBP concentration (indicated at the left of the images) with a constant CD45 R0 concentration imaged by TIRF microscopy. The percent of CD45 R0 exclusion is indicated as mean ± SD with n = 7 or 8 GUVs per condition pooled from three experiments. (B) Spinning-disk z-sections of GUVs shown in A. (C) Graphical representation of data shown in A; n.s., not significant (D) TIRF microscopy of a GUV–SLB interface showing the overall localization of CD45 R0 and FKBP. (E) Single-molecule imaging of CD45 R0 for the GUV shown in D. The border of the FKBP-enriched zone is indicated by a white line. Only tracks crossing the exclusion boundary are shown. CD45 R0 single-molecule tracks originating outside the FKBP-enriched zone are shown as green lines, and tracks originating inside the FKBP-enriched zone are shown as red lines. (F) TIRF microscopy of a GUV–SLB interface at 30-s time points after rapamycin addition showing the concentration of FKBP into microdomains that exclude CD45 R0 and CD45 RABC. The rate of CD45 RABC exclusion is 2.8 ± 0.9 times faster than rate of CD45 R0 exclusion; n = 7 GUVs from two experiments. (G) Quantification of exclusion for the representative GUV shown in F.
Fig. S1.
Fig. S1.
PD-L1 is not excluded from FKBP-bound membrane interfaces. (A) Spinning-disk z-sections of GUVs after membrane-apposed interfaces have reached equilibrium, showing localization of FKBP to the membrane interface, localization of CD45 R0 away from the interface, and uniform distribution of PD-L1. (B) Quantification of the experiment shown in A. Data are shown as the mean ± SD; n = 20 GUVs pooled from two experiments; n.s., not significant. ****P < 0.0001; t test.
Fig. S2.
Fig. S2.
FKBP molecules in partitioned domains do not readily exchange. (A) Images for FKBP-enriched interfaces before and after photobleaching (the dashed white line indicates the bleached site). (Scale bar, 5 μm.) (B) Kymograph corresponding to A. Data shown are representative of three independent experiments.
Fig. S3.
Fig. S3.
TCR–pMHC and FRB–FKBP exclude CD45 R0 and CD45 RABC but not SNAP. (A) TIRF microscopy of a GUV–SLB interface at equilibrium showing the concentration of TCR into microdomains. (Top) SNAP is homogenously distributed. (Middle) CD45 R0 is weakly excluded. (Bottom) CD45 RABC is strongly excluded. (B) TIRF microscopy of a GUV–SLB interface at equilibrium showing the concentration of FKBP into microdomains. SNAP is homogenously distributed. CD45 R0 and CD45 RABC are excluded.
Fig. 3.
Fig. 3.
Membrane topology is influenced by local protein composition. (A) Schematic of SAIM showing reflection and interference of excitation light that produces structured illumination patterns used to deduce fluorophore height; adapted from ref. . (B) Epifluorescence microscopy showing localization of lipid, CD45 R0, and FKBP on GUV analyzed by SAIM imaging. The percent of CD45 R0 exclusion is indicated for the image shown. (C) SAIM reconstruction of a GUV membrane derived from lipid fluorescence showing an increase in membrane height at CD45 R0 clusters. The average change in membrane height is depicted as mean ± SD; n = 4–6 clusters from each of four GUVs imaged during two separate experiments. (D) 3D model of the data shown in C. The z-scale is exaggerated to clearly depict membrane deformations. (E) Epifluorescence microscopy showing localization of lipid, SNAP, and FKBP on a GUV analyzed by SAIM imaging. (F) SAIM reconstruction of a GUV membrane derived from lipid fluorescence. (G) 3D model of the data shown in F. The z-scale is exaggerated to clearly depict membrane deformations.
Fig. 4.
Fig. 4.
TCR–pMHC binding induces CD45 segregation at GUV–SLB interfaces. (A) Schematic of 2B4 TCR–IEk MHC binding between a GUV and an SLB and segregating away from two CD45 isoforms (R0 and RABC). (B, Upper) Spinning-disk z-sections of GUVs after membrane-apposed interfaces have reached equilibrium, showing localization of 2B4 TCR to the membrane interface and the exclusion of CD45 R0 away from the interface. (Lower) TIRF images of the GUV–SLB interface for the GUV shown in the upper panel. The percent of CD45 R0 exclusion for the image shown is indicated. (C, Upper) Segregation of CD45 R0 and CD45 RABC on the same GUV membrane away from 2B4 TCR, shown by TIRF microscopy of the membrane interface. (Lower) The percent of CD45 isoforms exclusion is indicated as mean ± SD, with n = 13 GUVs from two experiments. (D) Graphical representation of the data shown in C. (E) Dependence of CD45 RABC exclusion as a function of TCR–pMHC affinity using peptides with different Kds as indicated at the left of the images. Membrane interfaces were imaged by TIRF microscopy. The percent of CD45 RABC exclusion is indicated as mean ± SD; n = 10 GUVs per condition from two experiments. (F) Graphical representation of the data shown in E; n.d., not detectible. ****P < 0.0001; t test.
Fig. 5.
Fig. 5.
The inhibitory coreceptor PD-1 excludes CD45 and colocalizes with TCR. (A) Schematic of PD-1–PD-L1 binding between a GUV and an SLB, with segregation away from CD45 RABC. (B) TIRF microscopy showing the concentration of PD-1 into microdomains that exclude CD45 RABC. The percent of CD45 RABC exclusion is indicated as mean ± SD; n = 14 GUVs from two experiments. (C) Schematic of TCR–pMHC and PD-1–PD-L1 induced segregation of CD45 RABC. (D) TIRF microscopy showing the concentration of TCR and PD-1 into a domain that excludes CD45 RABC. The percent of CD45 RABC exclusion is indicated as mean ± SD; n = 14 GUVs from two experiments. White arrows indicate a small CD45 RABC-enriched zone that is depleted for TCR and PD-1.
Fig. S4.
Fig. S4.
PD-1 is a target for CD45 dephosphorylation. (A) Schematic of the LUV reconstitution system for assaying the sensitivity PD-1 to CD45. DGS-NTA-Ni–containing LUVs were attached with purified, polyhistidine-tagged cytosolic domains of receptors (CD3ζ: 290 molecules/µm2; PD-1: 870 molecules/µm2), the adaptor LAT (870 molecules/µm2), the kinase Lck (290 molecules/ µm2), and the phosphatase CD45 (29 molecules/µm2). Purified cytosolic factors (Gads: 0.3 µM; SLP76: 0.3 µM) were added to the solution to create a more physiological setting. Preaddition of ATP triggered net phosphorylation of both CD3ζ and PD-1 by Lck, despite the presence of CD45, owing to the 10-fold excess of Lck over CD45. (B) A phosphotyrosine Western blot showing the time course of CD3ζ and PD-1 dephosphorylation by CD45 after the addition of the ATP scavenger Apyrase, which rapidly terminated the Lck kinase activity to isolate the CD45 activity. Pro, proline; PTPase, protein tyrosine phosphatase.

Similar articles

Cited by

References

    1. Carbone CB, et al. June 7, 2017. In vitro reconstitution of T cell receptor-mediated segregation of the CD45 phosphatase. bioRxiv, 10.1101/097600.
    1. Brownlie RJ, Zamoyska R. T cell receptor signalling networks: Branched, diversified and bounded. Nat Rev Immunol. 2013;13:257–269. - PubMed
    1. Davis SJ, van der Merwe PA. The kinetic-segregation model: TCR triggering and beyond. Nat Immunol. 2006;7:803–809. - PubMed
    1. Woollett GR, Williams AF, Shotton DM. Visualisation by low-angle shadowing of the leucocyte-common antigen. A major cell surface glycoprotein of lymphocytes. EMBO J. 1985;4:2827–2830. - PMC - PubMed
    1. McCall MN, Shotton DM, Barclay AN. Expression of soluble isoforms of rat CD45. Analysis by electron microscopy and use in epitope mapping of anti-CD45R monoclonal antibodies. Immunology. 1992;76:310–317. - PMC - PubMed

Publication types