. 2017 Oct 31;114(44):E9290-E9299.
doi: 10.1073/pnas.1712511114. Epub 2017 Oct 17.

Control of growth and gut maturation by HoxD genes and the associated lncRNA Haglr

Affiliations

Control of growth and gut maturation by HoxD genes and the associated lncRNA Haglr

Jozsef Zakany et al. Proc Natl Acad Sci U S A. .

Abstract

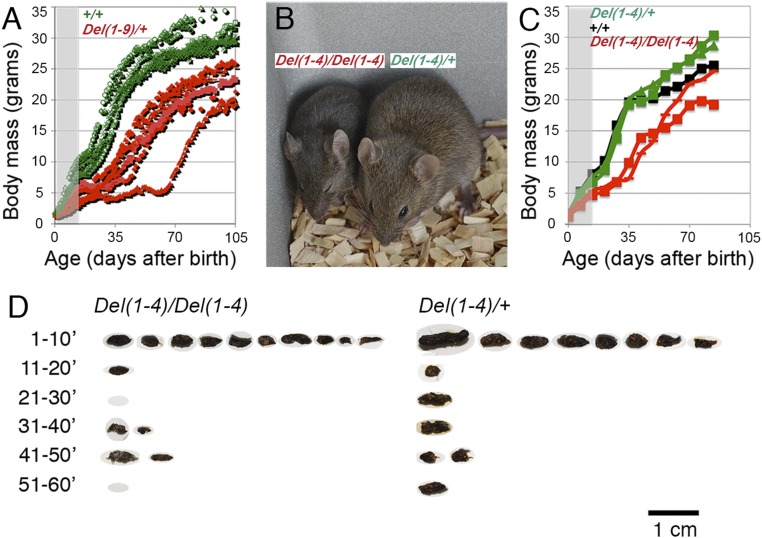
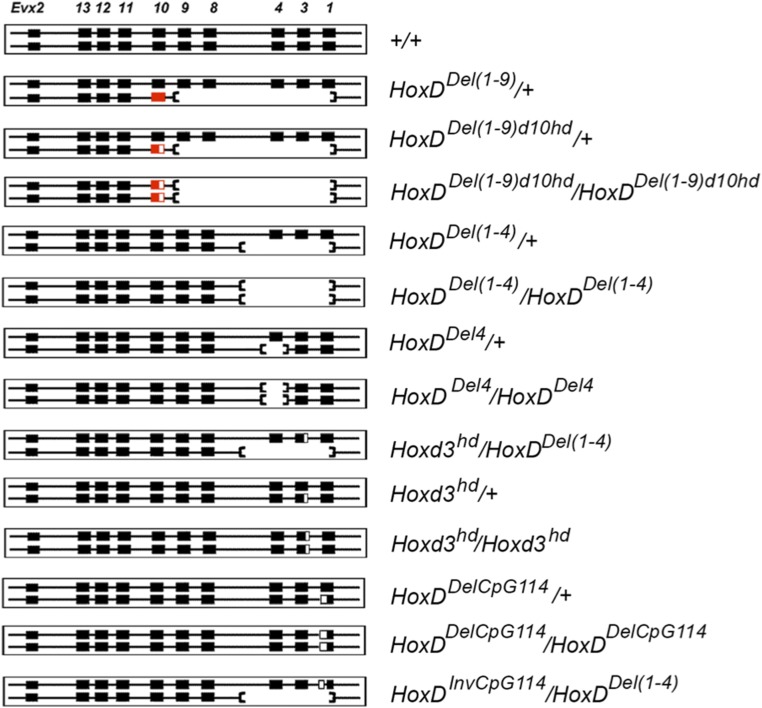
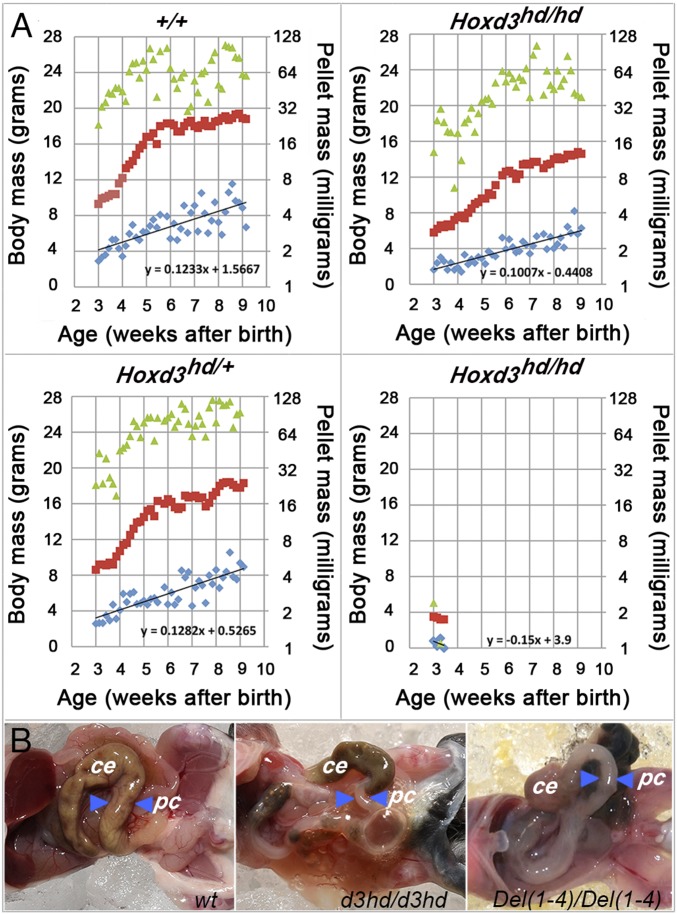
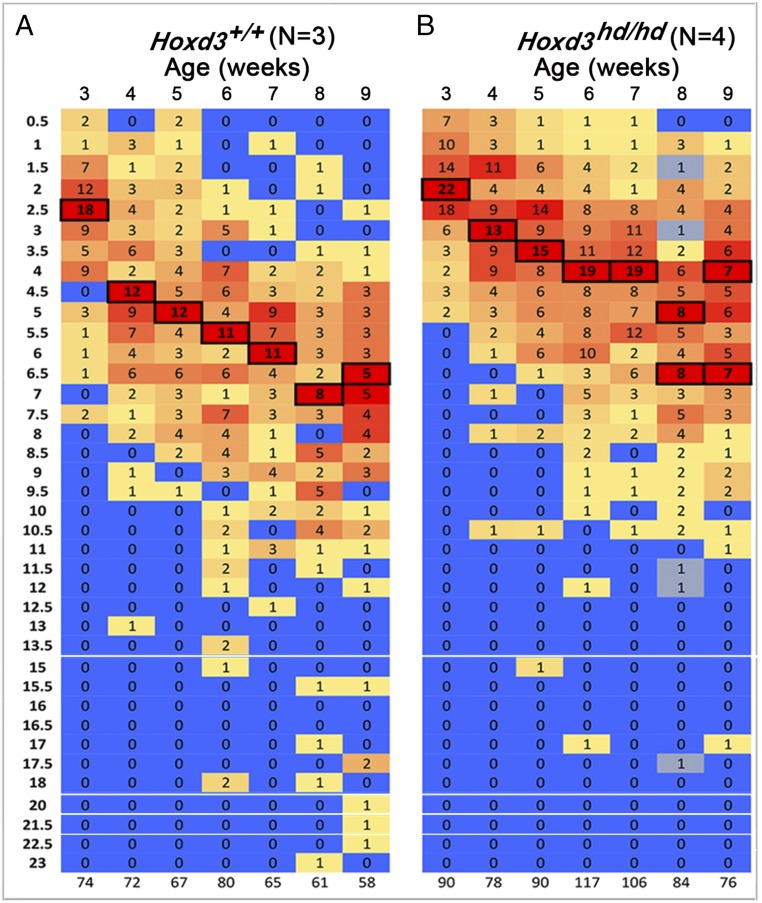
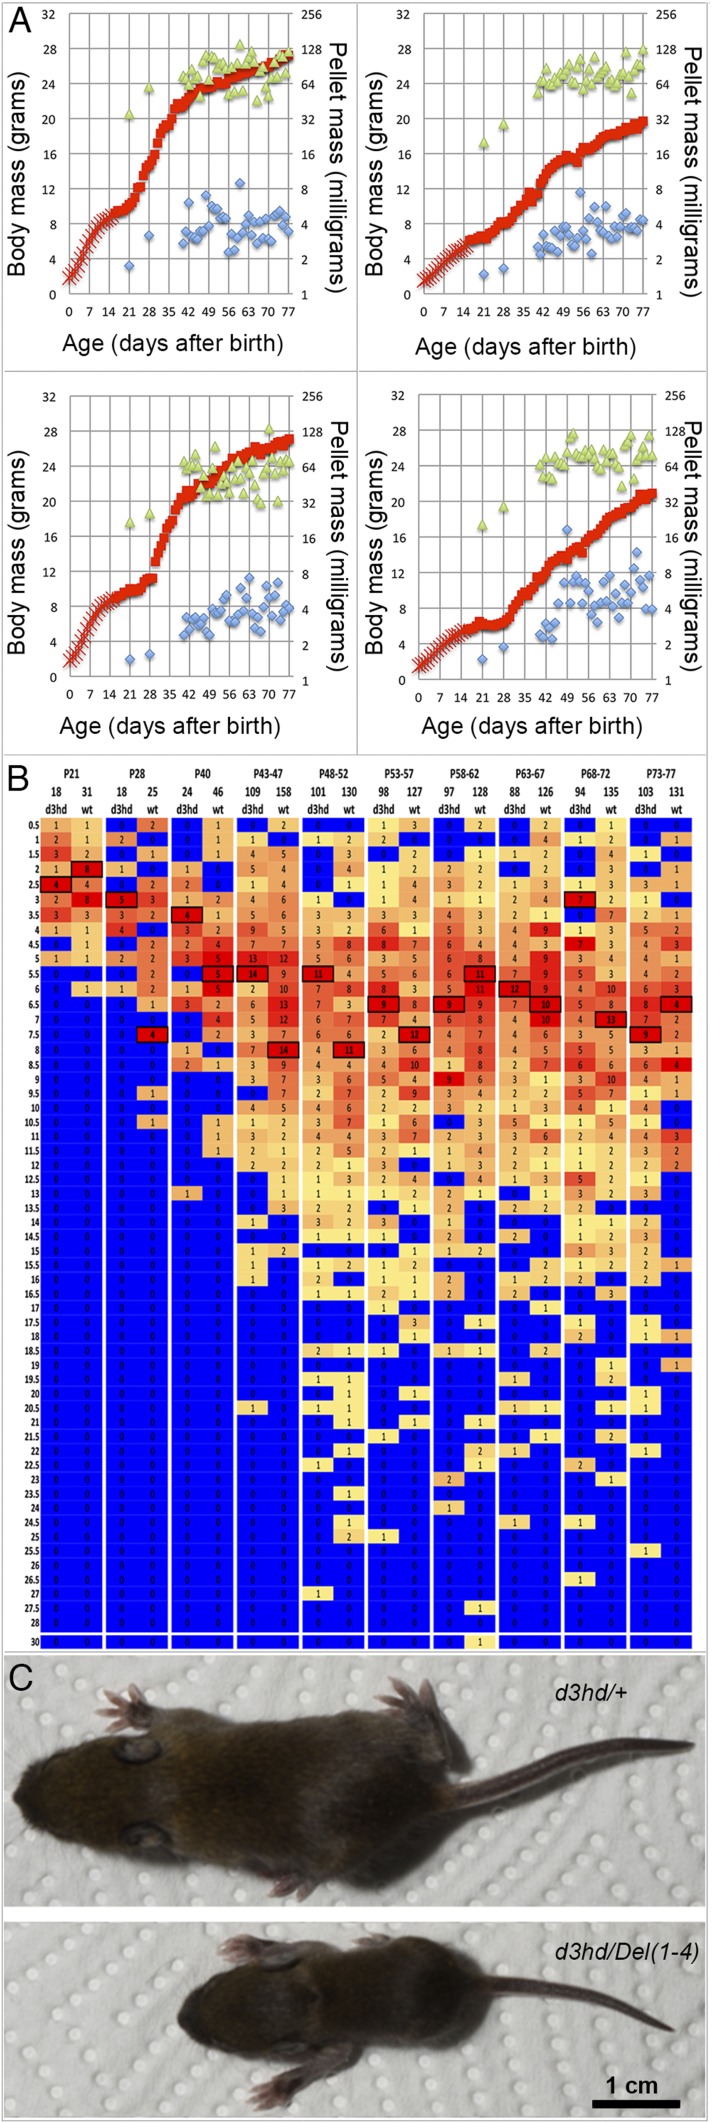
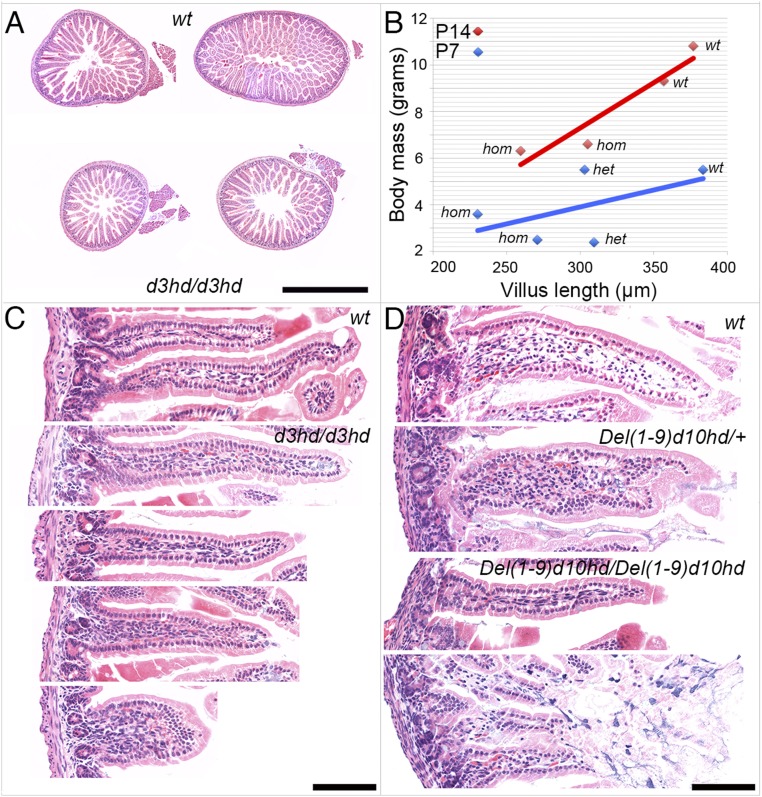
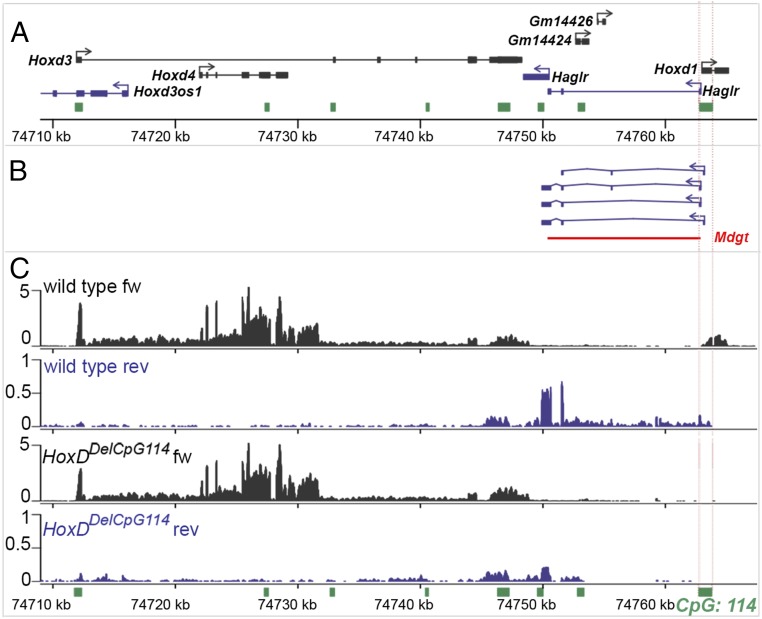
During embryonic development, Hox genes participate in the building of a functional digestive system in metazoans, and genetic conditions involving these genes lead to important, sometimes lethal, growth retardation. Recently, this phenotype was obtained after deletion of Haglr, the Hoxd antisense growth-associated long noncoding RNA (lncRNA) located between Hoxd1 and Hoxd3 In this study, we have analyzed the function of Hoxd genes in delayed growth trajectories by looking at several nested targeted deficiencies of the mouse HoxD cluster. Mutant pups were severely stunted during the suckling period, but many recovered after weaning. After comparing seven distinct HoxD alleles, including CRISPR/Cas9 deletions involving Haglr, we identified Hoxd3 as the critical component for the gut to maintain milk-digestive competence. This essential function could be abrogated by the dominant-negative effect of HOXD10 as shown by a genetic rescue approach, thus further illustrating the importance of posterior prevalence in Hox gene function. A role for the lncRNA Haglr in the control of postnatal growth could not be corroborated.

Keywords: CRISPR-cas9; Hox regulation; digestive system; growth control; lncRNA.


Conflict of interest statement

The authors declare no conflict of interest.

Figures

Fig. 1.
Fig. 1.
Stunted growth, survival, and vital signs in mouse stocks carrying HoxD cluster deficiencies. (A) Growth trajectories of Del(1–9)-heterozygous (red) and sibling wild-type controls (green) expressed as a scatter diagram of individual daily body mass values. The gray zone on the left indicates that genotypes (determined at P14–P16) are still unknown at these time points, and colors are thus extrapolated from subsequent values. (B) A representative Del(1–4)-homozygous specimen (Left) and a heterozygous sibling on P21. (C) Growth trajectories of Del(1–4)-homozygous (red), -heterozygous (green), and wild-type control (black) siblings expressed as scatter diagrams of individual body mass values obtained on their day of birth and weekly thereafter. The gray zone is as in A. (D) Photographs of droppings released during six consecutive 10-min periods after isolation on P35 by a homozygous and a heterozygous Del(1–4) mutant. Individual dry pellet masses collected during daily 30-min periods of such defecation-reflex episodes were taken as ejected dropping mass, a noninvasive measure of gut function (SI Materials and Methods).
Fig. S1.
Fig. S1.
Schematics of the various HoxD-mutant alleles used in this study. On the left are represented the various alleles of the HoxD clusters with the wild-type haplotype at the top. Hoxd1 is on the far right, and Evx2 on the far left, while the other Hoxd genes are indicated by the paralog group. The scheme does not represent relative distances. Coding genes are depicted as single boxes without showing introns. The sequence of the genes reflects the sequence of the homeodomain-containing exons, without reference to alternative promoters. Black boxes indicate the presence of intact Hoxd genes, and red boxes indicate that, in the Del(1–9) allele, Hoxd10 expression was gained outside its normal spatial domain. Half-empty red boxes indicate that the Hoxd10 gene was inactivated by CRISPR/cas9 genome editing. Empty black boxes indicate either that the Hoxd3 homeodomain was deleted or that the CpG114 island was deleted or inverted by CRISPR/cas9 genome editing. Deficiencies are marked by an interruption of the horizontal line and by the absence of gene symbols. The corresponding genotypes are given on the right. Only the superscripts in the names of these alleles were used in Table 1 entries and in the body of the text for brevity.
Fig. 2.
Fig. 2.
Stunted growth, survival, vital signs, and gut malformation in Hoxd3hd-homozygous mice. (A) Daily body mass (red), total dropping mass (green), and average dropping mass (blue) are plotted for wild-type (Upper Left) and heterozygous (Lower Left) mice and two homozygous siblings (Right). All four were females. The animal on the Bottom Right was killed at P23 due to severe stunting and wasting after weaning. Linear fitted lines show the dampened slope of average pellet mass for both homozygous animals. (B) Dissections of one representative individual of the three indicated genotypes showing the posterior midgut. Blue arrowheads point to the same segment of the proximal colon in each panel. The specimen on the Middle and on the Right were representative of severely wasted animals, usually killed during the fourth week after birth. ce, cecum; pc, proximal colon.
Fig. 3.
Fig. 3.
Frequency distributions of dropping weights pooled from three wild-type controls (A) and four homozygous mutants (B). Age in weeks at the time of collection is indicated above, and the total counts of pellets collected during the last two consecutive days are shown below. The size bins set to 0.5-mg increments are indicated on the left. The heat maps reflect the relative frequency of pellet counts in a given lot; the most frequent values are boxed for better visibility.
Fig. 4.
Fig. 4.
Correlation analysis of body mass and dropping mass measures. Values from five wild-type controls (blue) and four homozygous Hoxd3hd mutants (red) at three characteristic periods of wild-type controls’ postnatal growth were pooled. Values were included from three different litters in which both controls and homozygous siblings occurred as members of the same litter. (A) Plots of body weight as a function of average pellet weight. (B) Plots of body weight as a function of total ejected pellet weight. (C) Plots of total ejected pellet weight as function of average pellet weight. Pellets released during single daily 30-min defecation-reflex episodes were included. In each plot, the R2 values are depicted for wild-type (blue) and homozygous (red) animals to estimate the percentage of the variance due to variation in the respective parameter. R2 values of 0.010 or below were not statistically significant; R2 at 0.13 was statistically significant (P < 0.005); all other higher R2 values were statistically significant (P < 0.0005 or far below).
Fig. S2.
Fig. S2.
Growth retardation in F0 mice after inactivation of Hoxd3 by CRISPR/Cas9. (A) Daily body weight (red), total weight of dropping (green), and average weight (blue) are plotted for two normal siblings (Left) and two Hoxd3hd mutants (Right). All four were males issued from pronuclear injections of the Hoxd3 homeodomain-targeting plasmid vectors. (B) Frequency distributions of individual dropping masses pooled from the pairs of wild-type control and mutant individuals illustrated in A. Age at the time of collections is indicated above the heat map, total counts by wild-type and mutant genotypes are indicated as pairs below the heat map, the size bins set to 0.5-mg increments are indicated on the left. Heat maps reflect the relative frequency of pellet counts in a given lot; the most frequent values are boxed for better visibility. (C) Photograph of two P12 siblings from a litter born to a Hoxd3hd founder animal and a Del(1–4)-heterozygous male. Genotypes indicated for each specimen. A single picture was cut into two pieces for the ease of figure presentation (the scale is the same for both mice).
Fig. 5.
Fig. 5.
Reduced small intestine diameter and epithelial dysgenesis in Hoxd3hd and HoxDDel(1–9)d10hd milk-fed pups. (A) Two wild-type controls (Upper) and two Hoxd3hd-homozygous siblings (Lower) are shown. (B) The longest villi from at least six available sections from each individual were selected and photographed, and their longest axis was measured. In the diagram the body weight was plotted as a function of the average longest villus length. The Hoxd3hd stock at P14 is shown as red diamonds and a red line. The two diamonds on the right represent wild-type (wt) mice, and the two on the left represent homozygous (hom) siblings. A similar analysis was carried out with Del(1–9)d10hd at 7 d after birth and is depicted as blue diamonds and a blue line. The two values at the left represent homozygous animals (hom), the two in the middle represent heterozygous animals (het), and the one on the right is a wild-type control (wt). (C) H&E-stained paraffin sections of gut villi from wild-type control and two pairs of sections from two Hoxd3hd-homozygous specimens showing representative morphologies. (D) High-power photomicrographs of H&E sections of wild-type and heterozygous specimens and from two Del(1–9)d10hd-homozygous animals showing representative morphologies. (Scale bar, 1 mm in A and 100 µm in C and D.)
Fig. 6.
Fig. 6.
Targeted deletion and inversion of the CpG114 island that contains the bidirectional Hoxd1/Haglr promoter. (A) Map of the Hoxd3-Hoxd1 genomic locus showing annotated transcripts in the Ensembl database and eight CpG islands (green). The CpG114 is shown between two vertical dotted red lines and includes the first exons of both Hoxd1 and the Haglr lncRNA. Nucleotide positions below are on the mm10 genome assembly. (B) Splice variants of the Haglr transcripts, which were added to the Ensembl transcript annotation list in quantifying FPKM values in RNA-seq analyses. (C) BED graphs of uniquely mapped reads to the Hoxd3Hoxd1 genomic region on chromosome 2 from E9.5 mouse ribo-depleted RNA samples derived from two wild-type controls and two Del(CpG114)-homozygous embryos. Forward (black) and reverse (purple) strands from two biological replicates are combined.

Similar articles

Cited by

References

    1. Spitz F, et al. Large scale transgenic and cluster deletion analysis of the HoxD complex separate an ancestral regulatory module from evolutionary innovations. Genes Dev. 2001;15:2209–2214. - PMC - PubMed
    1. Zakany J, Duboule D. A genetic basis for altered sexual behavior in mutant female mice. Curr Biol. 2012;22:1676–1680. - PubMed
    1. Sauvageau M, et al. Multiple knockout mouse models reveal lincRNAs are required for life and brain development. Elife. 2013;2:e01749. - PMC - PubMed
    1. Guo T, et al. An evolving NGF-Hoxd1 signaling pathway mediates development of divergent neural circuits in vertebrates. Nat Neurosci. 2011;14:31–36. - PMC - PubMed
    1. Zákány J, Kmita M, Alarcon P, de la Pompa JL, Duboule D. Localized and transient transcription of Hox genes suggests a link between patterning and the segmentation clock. Cell. 2001;106:207–217. - PubMed

Publication types