. 2017 Oct 17;8(1):979.
doi: 10.1038/s41467-017-01057-7.

Three-dimensional context rather than NLS amino acid sequence determines importin α subtype specificity for RCC1

Affiliations

Three-dimensional context rather than NLS amino acid sequence determines importin α subtype specificity for RCC1

Rajeshwer S Sankhala et al. Nat Commun. .

Abstract

Active nuclear import of Ran exchange factor RCC1 is mediated by importin α3. This pathway is essential to generate a gradient of RanGTP on chromatin that directs nucleocytoplasmic transport, mitotic spindle assembly and nuclear envelope formation. Here we identify the mechanisms of importin α3 selectivity for RCC1. We find this isoform binds RCC1 with one order of magnitude higher affinity than the generic importin α1, although the two isoforms share an identical NLS-binding groove. Importin α3 uses its greater conformational flexibility to wedge the RCC1 β-propeller flanking the NLS against its lateral surface, preventing steric clashes with its Armadillo-core. Removing the β-propeller, or inserting a linker between NLS and β-propeller, disrupts specificity for importin α3, demonstrating the structural context rather than NLS sequence determines selectivity for isoform 3. We propose importin α3 evolved to recognize topologically complex NLSs that lie next to bulky domains or are masked by quaternary structures.Importin α3 facilitates the nuclear transport of the Ran guanine nucleotide exchange factor RCC1. Here the authors reveal the molecular basis for the selectivity of RCC1 for importin α3 vs the generic importin α1 and discuss the evolution of importin α isoforms.


Conflict of interest statement

The authors declare no competing financial interests.

Figures

Fig. 1
Fig. 1
Calorimetric analysis of the interaction of human RCC1 with importin α isoforms. Titration of 300 μM RCC1 (in syringe) in a cell containing 100 μM a ΔIBB-importin α3 or b ΔIBB-importin α1. Top panel: raw injection heats. Bottom panel: integrated, buffer-subtracted binding enthalpy plotted as a function of the RCC1:importin α molar ratio. Bottom panel insert: overall variation of enthalpy (∆H), entropy (TS), and Gibbs (∆G) energy associated with each binding titration
Fig. 2
Fig. 2
Structure of human importin α3 bound to RCC1. a A representative structure of the human importin α3:RCC1 complex with RCC1 (ribbon diagram) and importin α3 (solvent surface) colored in green and gray, respectively. RCC1 hinge residues (23–27) are colored in red. b Eight-fold non-crystallographic symmetry averaged 2Fo − Fc electron density map of the RCC1 NLS displayed at 1σ above background. The density (in blue) is overlaid to residues 4–24 of the final refined model (in green). c SAXS analysis of the importin α3:RCC1 complex. Experimental scattering data (shown in black) obtained by merging scattering data at 3.5, 5.0, and 7.5 mg ml−1 (top panel) and corresponding distance distribution function P(r) (bottom panel). Scattering profile and P(r) function calculated from the average of the eight importin α3:RCC1 complexes observed crystallographically are shown in red. d. Ab initio SAXS reconstruction of the importin α3:RCC1 complex calculated from merged scattering intensities at 3.5, 5.0, and 7.5 mg ml−1. Overlaid to the SAXS envelope is a composite of all complexes in the triclinic unit cell
Fig. 3
Fig. 3
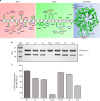
Importin α3:RCC1 binding interface. a Schematic diagram of interactions between RCC1 and importin α3. R9 and K21 at positions P2′ and P2, respectively, are shown as red letters. b Pull-down analysis of the interaction of GST-ΔIBB-importin α3 immobilized on glutathione beads with RCC1. Loading controls are in Supplementary Fig. 3a c Quantification of pull-downs shown as mean ± SD for three independent experiments. No interaction is observed between free RCC1 and glutathione beads (Supplementary Fig. 3d)
Fig. 4
Fig. 4
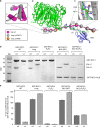
Structural flexibility in importin α3 promotes RCC1 recognition. a Structural superimposition of importin α3:RCC1 (pdb: 5TBK), importin α3:PB2 (pdb: 4UAE), and importin α1:nucleoplasmin NLS (pdb: 1EJY). Importin αs are shown as beads-on-a-string (each bead representing an Arm repeat) while PB2 and RCC1 are displayed as ribbons; the nucleoplasmin NLS is omitted for clarity. b Zoom-in panel showing a superimposition of Arm 1 in importin α3 bound to RCC1 (gray) and importin α1 (magenta). c Zoom-in panel showing the local environment of the RCC1 S11 and PB2 S742, which are both subjected to phosphorylation. d Pull-down analysis of the interaction of importin α3 and α1 with the full-length GST-RCC1, GST-RCC1-Long, GST-RCC1-P2/P2′ or just the RCC1-NLS (e.g., GST-RCC1-NLS (WT) and GST-RCC1-NLS (P2/P2′)). The gel shows identical fractions eluted from glutathione beads. Loading controls are in Supplementary Fig. 3b. e Quantification of pull-downs in d shown as mean ± SD for three independent experiments. No interaction was observed between free importin α1/3 and glutathione beads (Supplementary Fig. 3e)
Fig. 5
Fig. 5
RCC1 N-terminal tail exists in a conformational ensemble. SAXS analysis of human RCC1. a Experimental scattering data at 2.5 mg ml−1 (top panel) and P(r) function for observed SAXS data (bottom panel) are shown in black and data calculated from an ensemble model of eight RCC1s observed crystallographically and docked inside the SAXS envelope are shown in red. b Ab initio SAXS reconstruction of human RCC1 calculated from experimental scattering data at 2.5 mg ml−1. Overlaid to the SAXS envelope are the eight conformers of RCC1 observed crystallographically in complex with importin α3
Fig. 6
Fig. 6
The structure of yeast RCC1 in complex with Kap60. a Crystal structure of Kap60 (light cyan) bound to yRCC1 (yellow). b A representative Fo − Fc electron density difference map of yRCC1 N-terminal tail (in blue) is displayed at 2σ above background and is overlaid to the final refined model (residues 2–6 and 16–23) colored in yellow. c Average SEC-SAXS data calculated from frames 710 to 750 (top panel) and corresponding P(r) function (bottom panel) are shown in black. Scattering data and P(r) function calculated from the crystal structure of the Kap60:yRCC1 complex are shown in red. d Ab initio SAXS reconstructions of the Kap60:yRCC1 complex calculated from experimental scattering values obtained from SEC-SAXS (frames 710–750). The crystallographic structure of the complex is overlaid to the SAXS envelope
Fig. 7
Fig. 7
Kap60:yRCC1 binding interface. a Schematic diagram of the interactions between the yRCC1 N-terminal tail and Kap60. R4 and K20 at positions P2′ and P2, respectively, are shown as red letters. b Superimposition of the bipartite NLSs and C-terminal regions of yeast and human RCC1 colored in yellow and green, respectively. c Crystal structure of Kap60 (light cyan) bound to yRCC1 (yellow) illustrating contacts between the C-terminal α-helix and Kap60 Arm 1. d Pull-down analysis of the interaction of GST-ΔIBB-Kap60 immobilized on glutathione beads with yRCC1. Loading controls are in Supplementary Fig. 3c. e Pull-downs are shown as mean ± SD for three independent experiments. No interaction was observed between free yRCC1 and glutathione beads (Supplementary Fig. 3d)
Fig. 8
Fig. 8
Differential recognition of NLS cargos by importin αs. Recognition of a human RCC1 (green) by importin α3 (gray), b yeast RCC1 (yellow) by Kap60 (light cyan), c CAP80 (orange) by importin α1 (magenta) (PDB ID 3FEY). For clarity, residues 385–790 of the CAP80 are not shown. NLSs and flanking residues that make contacts with importin αs are shown in black; residues at P2 and P2′ are shown as sticks

Similar articles

Cited by

References

    1. Macara IG. Transport into and out of the nucleus. Microbiol. Mol. Biol. Rev. 2001;65:570–594. doi: 10.1128/MMBR.65.4.570-594.2001. - DOI - PMC - PubMed
    1. Bednenko J, Cingolani G, Gerace L. Nucleocytoplasmic transport: navigating the channel. Traffic. 2003;4:127–135. doi: 10.1034/j.1600-0854.2003.00109.x. - DOI - PubMed
    1. Stewart M. Molecular mechanism of the nuclear protein import cycle. Nat. Rev. Mol. Cell Biol. 2007;8:195–208. doi: 10.1038/nrm2114. - DOI - PubMed
    1. Kalab P, Heald R. The RanGTP gradient - a GPS for the mitotic spindle. J. Cell Sci. 2008;121:1577–1586. doi: 10.1242/jcs.005959. - DOI - PMC - PubMed
    1. Mosammaparast N, Pemberton LF. Karyopherins: from nuclear-transport mediators to nuclear-function regulators. Trends Cell Biol. 2004;14:547–556. doi: 10.1016/j.tcb.2004.09.004. - DOI - PubMed

Publication types

MeSH terms