. 2017 Oct 17;8(1):875.
doi: 10.1038/s41467-017-00901-0.

The microbiota continuum along the female reproductive tract and its relation to uterine-related diseases

Affiliations

The microbiota continuum along the female reproductive tract and its relation to uterine-related diseases

Chen Chen et al. Nat Commun. .

Abstract

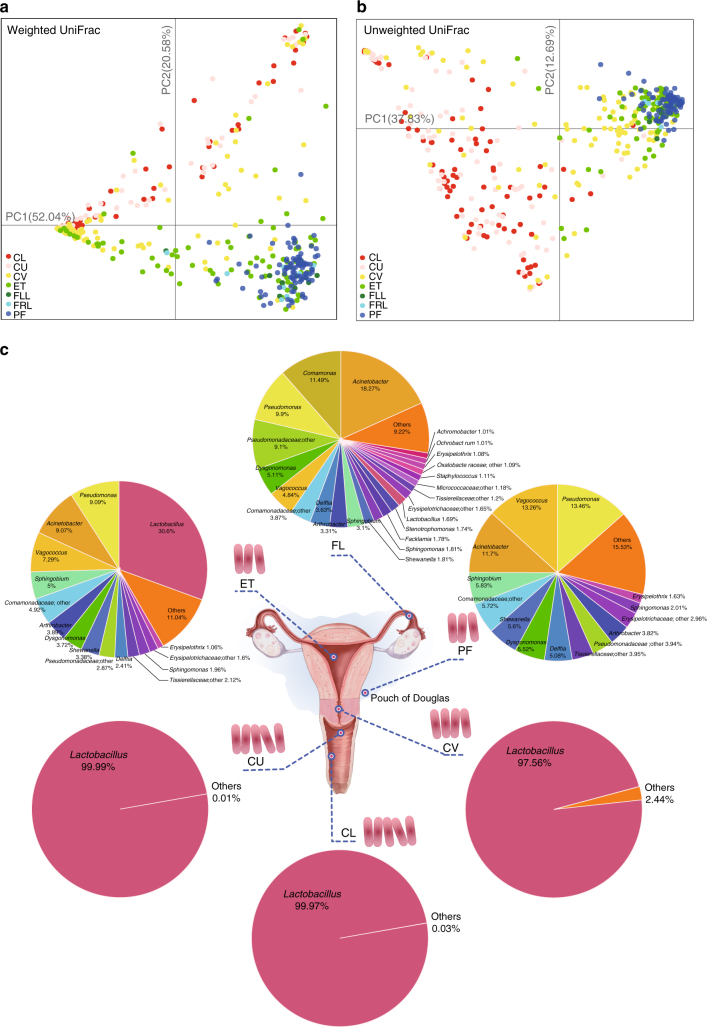
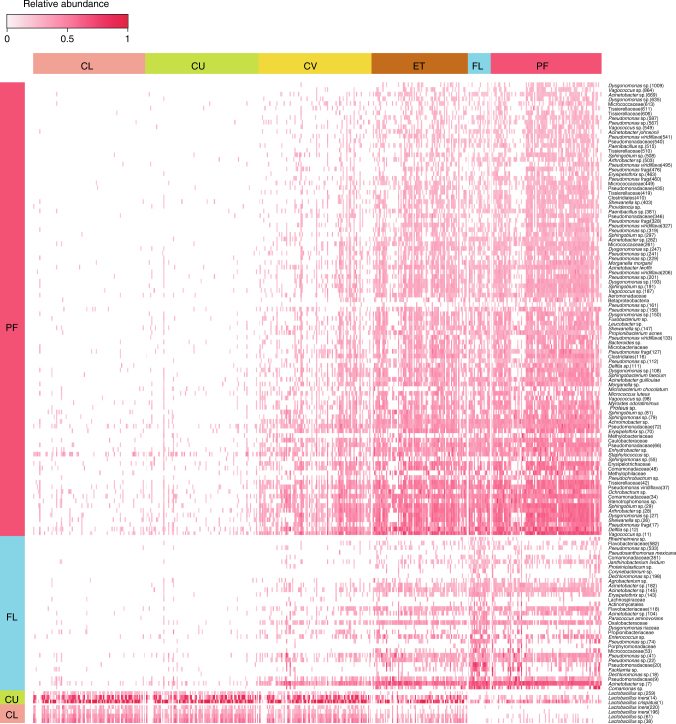
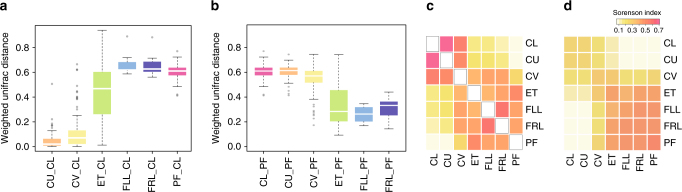
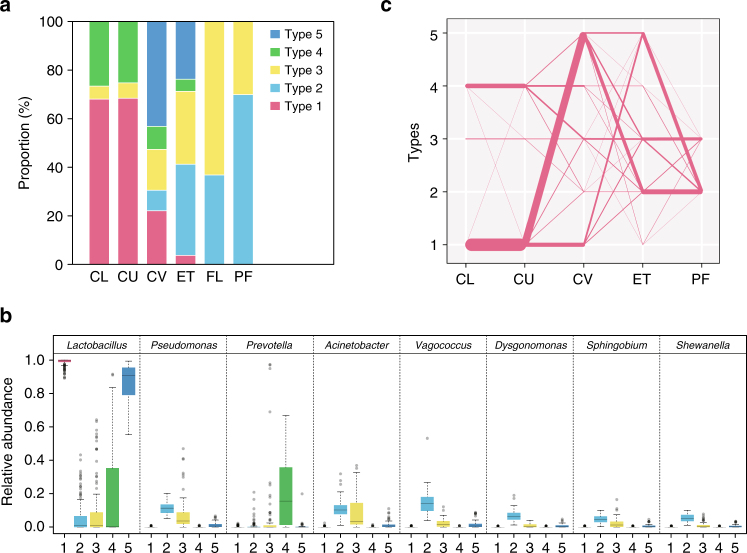
Reports on bacteria detected in maternal fluids during pregnancy are typically associated with adverse consequences, and whether the female reproductive tract harbours distinct microbial communities beyond the vagina has been a matter of debate. Here we systematically sample the microbiota within the female reproductive tract in 110 women of reproductive age, and examine the nature of colonisation by 16S rRNA gene amplicon sequencing and cultivation. We find distinct microbial communities in cervical canal, uterus, fallopian tubes and peritoneal fluid, differing from that of the vagina. The results reflect a microbiota continuum along the female reproductive tract, indicative of a non-sterile environment. We also identify microbial taxa and potential functions that correlate with the menstrual cycle or are over-represented in subjects with adenomyosis or infertility due to endometriosis. The study provides insight into the nature of the vagino-uterine microbiome, and suggests that surveying the vaginal or cervical microbiota might be useful for detection of common diseases in the upper reproductive tract.Whether the female reproductive tract harbours distinct microbiomes beyond the vagina has been a matter of debate. Here, the authors show a subject-specific continuity in microbial communities at six sites along the female reproductive tract, indicative of a non-sterile environment.


Conflict of interest statement

The authors declare no competing financial interests.

Figures

Fig. 1
Fig. 1
Composition of the vagino-uterine microbiota. a, b PCoA on the samples based on weighted (a) and unweighted (b) UniFrac distances. Samples were taken from CL, CU and CV before operation, and from ET, FLL, FRL and PF during operation. Each dot represents one sample. c Pie chart for the microbial genera at each body site according to the median relative abundance. Genera that took up <1% of the microbiota were labelled together as ‘others’. A pink rod represents about 102 copies/sample, according to the qPCR results in Supplementary Fig. 5e. Samples derive from the study cohort of 95 reproductive-age women (n = 94 CL, 95 CU, 95 CV, 80 ET, 93 PF, 9 FLL and 10 FRL, Supplementary Data 1)
Fig. 2
Fig. 2
Signature species for each body site. Heatmap for the relative abundances of signature OTUs from each body site (P < 0.05, multi-level pattern analysis, and IndVal >0.5). Each bar represents one sample (n = 94 CL, 95 CU, 95 CV, 80 ET, 93 PF, 9 FLL and 10 FRL, Supplementary Data 1)
Fig. 3
Fig. 3
Similarity of the vagino-uterine microbiota within and between individuals. a, b Weighted UniFrac distance of the microbiota at each body site relative to the CL (a) and PF (b) in the same individual. Boxes denote the interquartile range (IQR) between the first and third quartiles (25th and 75th percentiles, respectively), and the line inside the boxes denote the median. The whiskers denote the lowest and highest values within 1.5 times the IQR from the first and third quartiles, respectively. Circles represent data points beyond the whiskers. c Intra-individual Sorenson indices between different body sites. d Inter-individual Sorenson indices between different body sites. Samples derive from the study cohort of 95 reproductive-age women (n = 94 CL, 95 CU, 95 CV, 80 ET, 93 PF, 9 FLL and 10 FRL, Supplementary Data 1)
Fig. 4
Fig. 4
Community types of the vagino-uterine microbiota. a Distribution of samples among the five community types at each body site (n = 94 CL, 95 CU, 95 CV, 80 ET, 93 PF, 9 FLL and 10 FRL, Supplementary Data 1). b Relative abundances of the top 8 most abundant genera in the 5 community types. The boxes denote the interquartile range (IQR) between the first and third quartiles (25th and 75th percentiles, respectively), and the line inside the boxes denote the median. The whiskers denote the lowest and highest values within 1.5 times the IQR from the first and third quartiles, respectively. Circles represent data points beyond the whiskers. c Community types connected between neighbouring sites according to individual subjects. Due to the small sample size, results for the fallopian tubes were plotted in a separate graph (Supplementary Fig. 7c). The width of each line indicates the number of subjects (n = 1–95)
Fig. 5
Fig. 5
Microbiota-based classification of infertility due to endometriosis. a, b, c, d, e Distribution of 5 trials of 10-fold cross-validation error in random forest classification of fertile versus infertile samples as the number of OTUs increases (a, CL; b, CU; c, CV; d, ET; e, PF). The model was trained using relative abundance of the OTUs (present in at least 10% of the samples) in the samples (n = 16 without endometriosis (fertile), 32 with endometriosis (infertile)). Subjects with endometriosis who had given birth, and infertile subjects due to reasons other than endometriosis, e.g. salpingemphraxis, were not analysed (Supplementary Data 1). The red curve indicates an average of the five trials (pink lines). The grey line marks the number of OTUs in the optimal set. (f, g, h, i, j) Receiver operating curve (ROC) for the cross-validated sample set (f, CL; g, CU; h, CV; i, ET; j, PF). The area under receiver operating curve (AUC) is 0.8272, 0.5919, 0.8493, 0.8304 and 0.8613, respectively. The 95% confidence intervals (CI) are shown as shaded areas. The diagonal lines mark an AUC of 0.5 (i.e. random classification).
Fig. 6
Fig. 6
Associations between inferred microbial functions and menstrual phases. Microbial KEGG pathways enriched in the proliferative or the secretory phases (orange versus blue, reporter score >1.96 or <−1.96) and present in all the body sites were plotted as a heatmap. The pathways were arranged by unsupervised hierarchical clustering. Samples derive from the study cohort of 95 reproductive-age women (n = 94 CL, 95 CU, 95 CV, 80 ET, 93 PF, 9 FLL and 10 FRL, Supplementary Data 1)

Similar articles

Cited by

References

    1. Brunelli R, et al. Globular structure of human ovulatory cervical mucus. FASEB J. 2007;21:3872–3876. doi: 10.1096/fj.07-8189com. - DOI - PubMed
    1. Ma B, Forney LJ, Ravel J. Vaginal microbiome: rethinking health and disease. Annu. Rev. Microbiol. 2012;66:371–389. doi: 10.1146/annurev-micro-092611-150157. - DOI - PMC - PubMed
    1. Ravel J, et al. Vaginal microbiome of reproductive-age women. Proc. Natl Acad. Sci. USA. 2010;108:4680–4687. doi: 10.1073/pnas.1002611107. - DOI - PMC - PubMed
    1. Gajer P, et al. Temporal dynamics of the human vaginal microbiota. Sci. Transl. Med. 2012;4:132ra52–132ra52. doi: 10.1126/scitranslmed.3003605. - DOI - PMC - PubMed
    1. Ding T, Schloss PD. Dynamics and associations of microbial community types across the human body. Nature. 2014;509:357–360. doi: 10.1038/nature13178. - DOI - PMC - PubMed

Publication types

Substances