. 2017 Oct 17;8(1):990.
doi: 10.1038/s41467-017-01217-9.

Molecular analysis of high-grade serous ovarian carcinoma with and without associated serous tubal intra-epithelial carcinoma

Affiliations

Molecular analysis of high-grade serous ovarian carcinoma with and without associated serous tubal intra-epithelial carcinoma

Jennifer Ducie et al. Nat Commun. .

Abstract

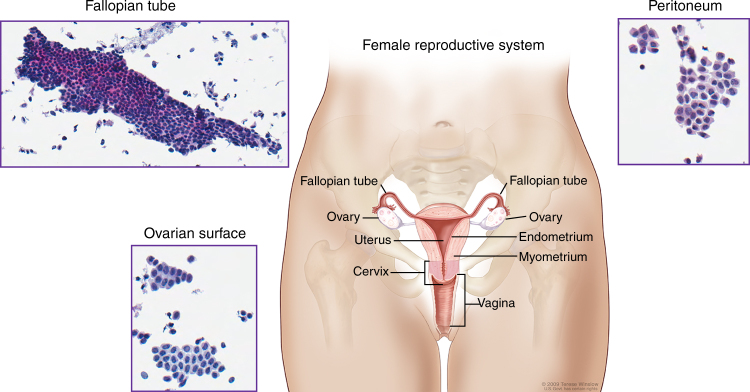
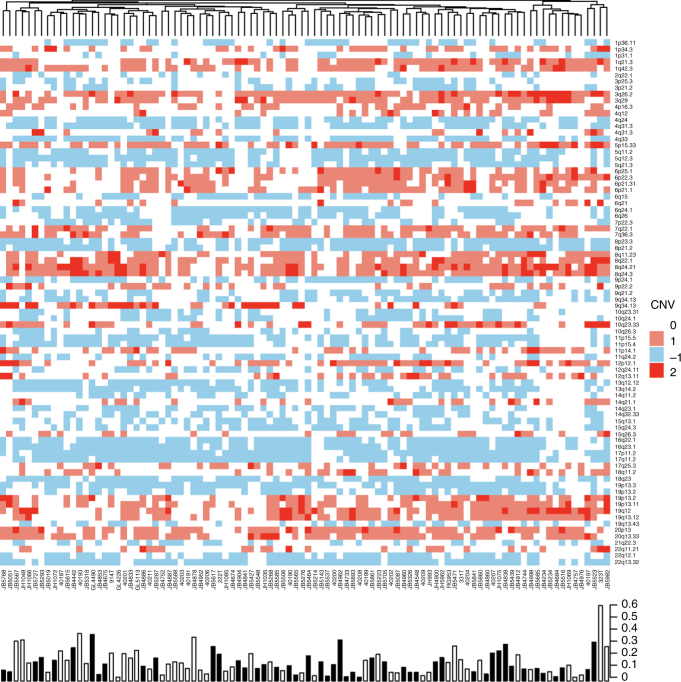
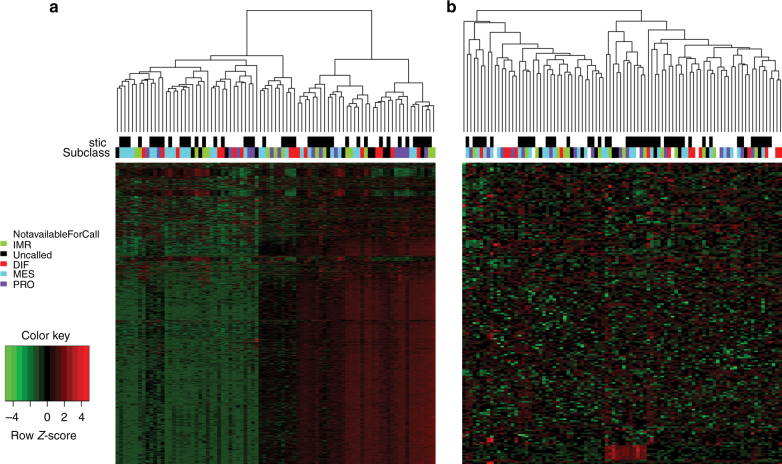
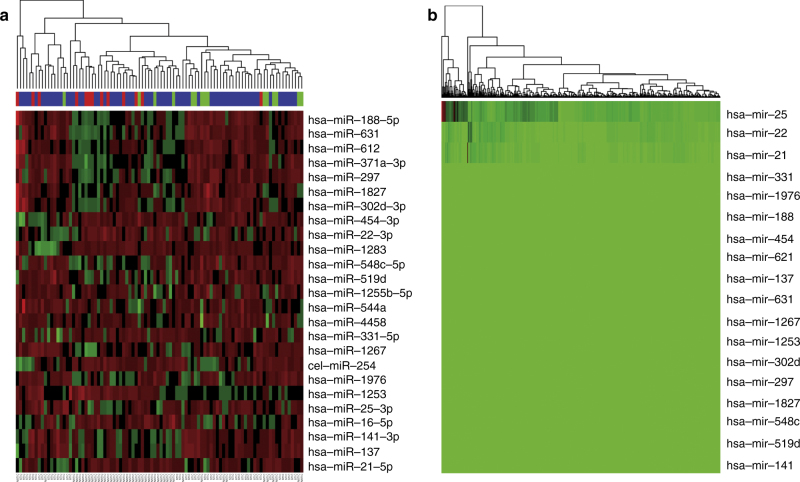
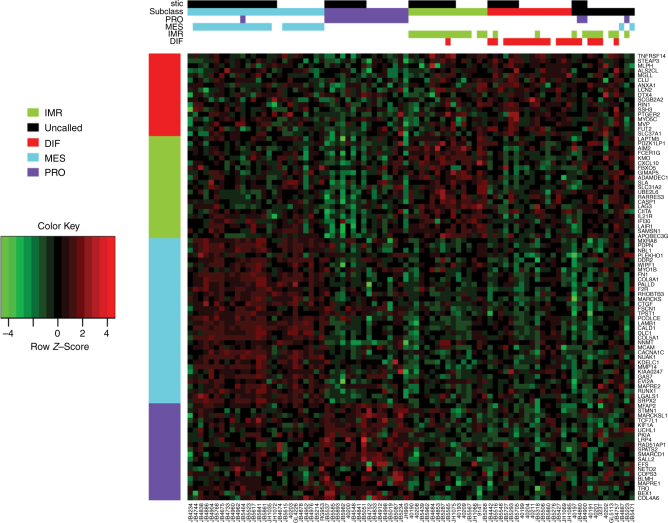
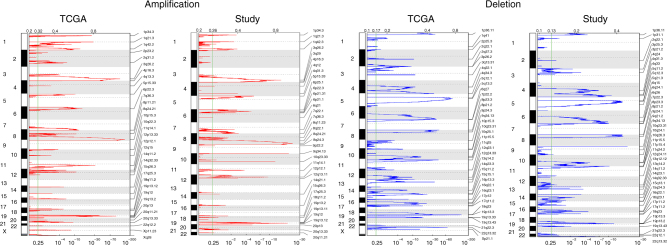
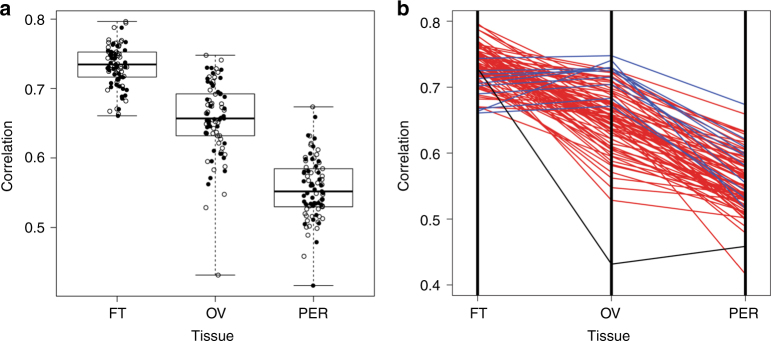
Many high-grade serous carcinomas (HGSCs) of the pelvis are thought to originate in the distal portion of the fallopian tube. Serous tubal intra-epithelial carcinoma (STIC) lesions are the putative precursor to HGSC and identifiable in ~ 50% of advanced stage cases. To better understand the molecular etiology of HGSCs, we report a multi-center integrated genomic analysis of advanced stage tumors with and without STIC lesions and normal tissues. The most significant focal DNA SCNAs were shared between cases with and without STIC lesions. The RNA sequence and the miRNA data did not identify any clear separation between cases with and without STIC lesions. HGSCs had molecular profiles more similar to normal fallopian tube epithelium than ovarian surface epithelium or peritoneum. The data suggest that the molecular features of HGSCs with and without associated STIC lesions are mostly shared, indicating a common biologic origin, likely to be the distal fallopian tube among all cases.High-grade serous carcinomas (HGSCs) are associated with precursor lesions (STICs) in the fallopian epithelium in only half of the cases. Here the authors report the molecular analysis of HGSCs with and without associated STICs and show similar profiles supporting a common origin for all HGSCs.


Conflict of interest statement

The authors declare no competing financial interests.

Figures

Fig. 1
Fig. 1
Normal tissue anatomic sites. Pelvic anatomy with insets showing cytologic images of tissue brushings used to obtain pools of normal tissues for molecular profiling. Fallopian tube cytology is predominantly consistent with an epithelial lineage and ovarian surface and peritoneal cytology have mesothelial histology. For the National Cancer Institute© (2009) Terese Winslow LLC, U.S. Govt. has certain rights. This image is not included under the creative commons licence for this article
Fig. 2
Fig. 2
Significant copy number alterations as identified by GISTIC. The proportion of genome significantly altered (homozygous deletion or 2+ fold amplification) is depicted in a bar plot along the bottom. The presence of a STIC lesion is indicated by a black bar in the bar plot
Fig. 3
Fig. 3
Unsupervised clustering of the most variable genes. Unsupervised clustering analysis of the most variable mRNA (a) and microRNA (b) transcripts from 85 analyzed tumors with STIC lesion and TCGA subclass indicated in header rows. Samples are in columns and genes in rows
Fig. 4
Fig. 4
Differentially expressed microRNA. a Unsupervised clustering of the 24 microRNAs that were differentially expressed between cases with and without STIC lesions at a corrected P value < 0.01. b The previously published TCGA data showing that all but three of these genes have low expression based on microRNA sequence abundance
Fig. 5
Fig. 5
TCGA features of study samples using a gene expression subtype signature. Gene expression using a 100 gene subtype signature and ordered by assigned subtype. Group membership is assigned by color in the top rows for subtypes with > 0.2 correlation. For samples with more than one robust correlation, the highest correlation was assigned if it was at least 1.5 × higher than the next highest subtype correlation. Samples to the far right were not assigned to any particular subtype. STIC status is shown in the top row
Fig. 6
Fig. 6
TCGA features of study samples using focal copy number alterations. Focal copy number alterations in study samples compared to the TCGA data
Fig. 7
Fig. 7
Correlation between gene expression of tumor samples and normal tissues. The mRNA expression profile for each tumor sample was correlated to prototype profiles derived from normal fallopian tube (FT), ovarian surface epithelium (OV) and peritoneal (PER) tissue, respectively, using genes most differentially expressed across normal tissue types. a Correlation coefficients for tumor samples compared to each normal tissue type indicated by the presence (solid circles) or absence (open circles) of STIC lesions. Boxplot center lines represent medians, box limits are the inter-quartile range from 25 and 75%, whiskers represent the extent of tumors out to 1.5 times the inter-quartile range. b Plot of correlation coefficients for each sample across normal tissue types. Each line corresponds to an individual tumor sample. Seventy-five of eighty-five tumor samples (88%) were most closely correlated with the normal fallopian tube phenotype (red lines). The remaining 10 (blue lines) more closely resembled the normal ovarian tissue. Normal peritoneum tissue had the lowest correlation with all but one sample (black line)

References

    1. Kurman RJ, Shih IeM. The dualistic model of ovarian carcinogenesis: Revisited, revised, and expanded. Am. J. Pathol. 2016;186:733–747. doi: 10.1016/j.ajpath.2015.11.011. - DOI - PMC - PubMed
    1. Eckert MA, et al. Genomics of ovarian cancer progression reveals diverse metastatic trajectories including intraepithelial metastasis to the fallopian tube. Cancer Discov. 2016;6:1342–1351. doi: 10.1158/2159-8290.CD-16-0607. - DOI - PMC - PubMed
    1. Kuhn E, et al. TP53 mutations in serous tubal intraepithelial carcinoma and concurrent pelvic high-grade serous carcinoma--evidence supporting the clonal relationship of the two lesions. J. Pathol. 2012;226:421–426. doi: 10.1002/path.3023. - DOI - PMC - PubMed
    1. Kindelberger DW, et al. Intraepithelial carcinoma of the fimbria and pelvic serous carcinoma: Evidence for a causal relationship. Am. J. Surg. Pathol. 2007;31:161–169. doi: 10.1097/01.pas.0000213335.40358.47. - DOI - PubMed
    1. Salvador S, et al. Chromosomal instability in fallopian tube precursor lesions of serous carcinoma and frequent monoclonality of synchronous ovarian and fallopian tube mucosal serous carcinoma. Gynecol. Oncol. 2008;110:408–417. doi: 10.1016/j.ygyno.2008.05.010. - DOI - PubMed

Publication types

MeSH terms