. 2017 Oct 17;7(1):13334.
doi: 10.1038/s41598-017-13477-y.

A Novel Technique for Accelerated Culture of Murine Mesenchymal Stem Cells that Allows for Sustained Multipotency

Affiliations

A Novel Technique for Accelerated Culture of Murine Mesenchymal Stem Cells that Allows for Sustained Multipotency

Courtney M Caroti et al. Sci Rep. .

Abstract

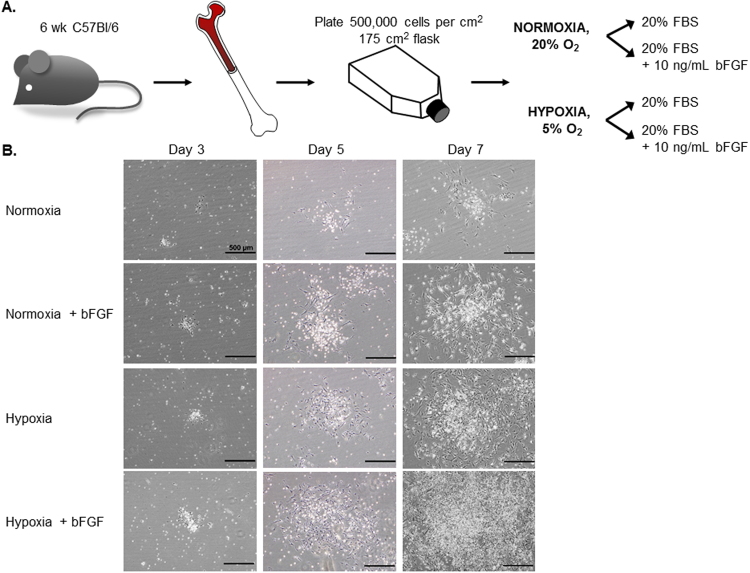
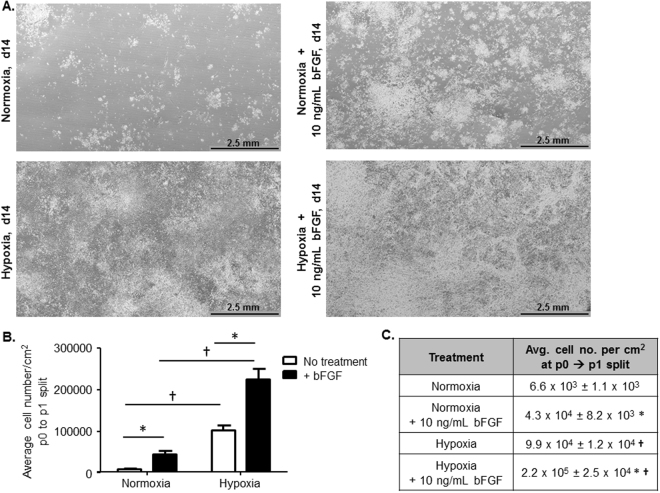
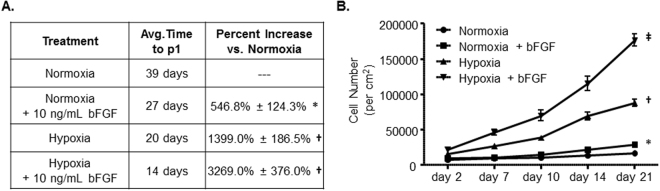
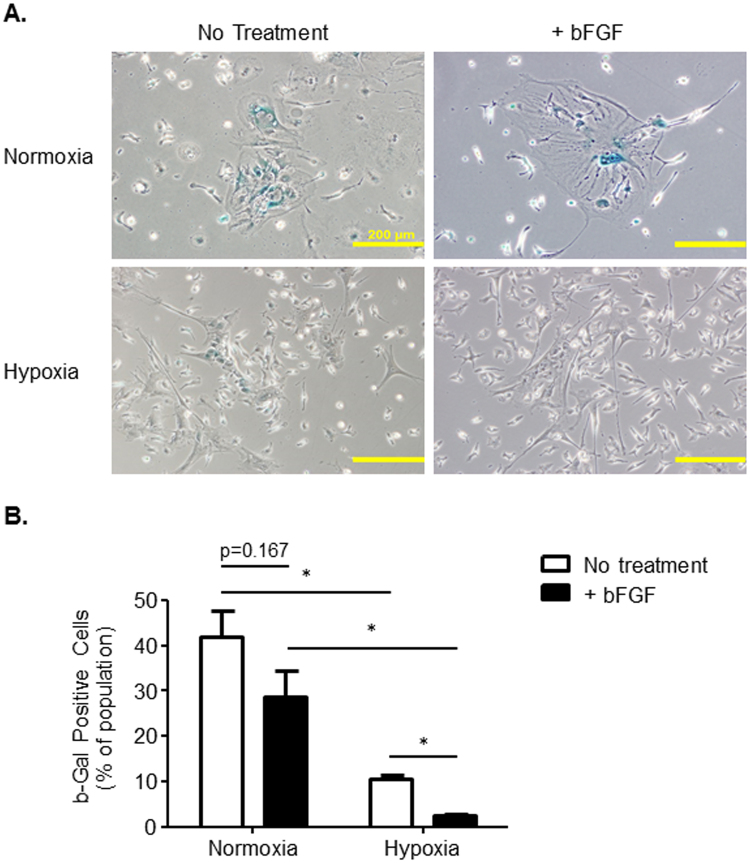
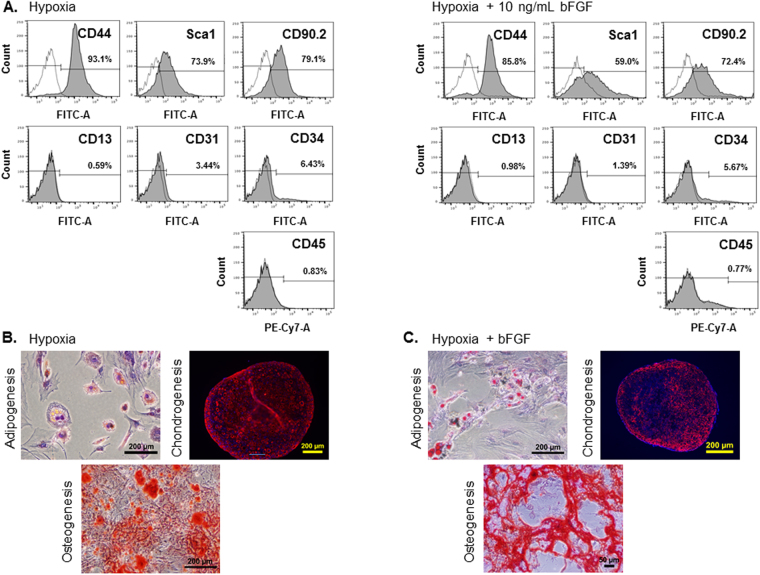
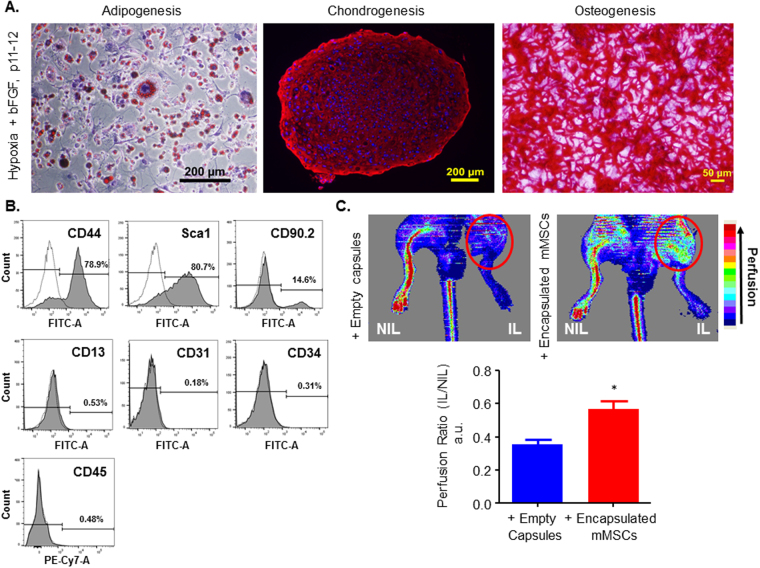
Bone marrow derived mesenchymal stem cells (MSCs) are regularly utilized for translational therapeutic strategies including cell therapy, tissue engineering, and regenerative medicine and are frequently used in preclinical mouse models for both mechanistic studies and screening of new cell based therapies. Current methods to culture murine MSCs (mMSCs) select for rapidly dividing colonies and require long-term expansion. These methods thus require months of culture to generate sufficient cell numbers for feasibility studies in a lab setting and the cell populations often have reduced proliferation and differentiation potential, or have become immortalized cells. Here we describe a simple and reproducible method to generate mMSCs by utilizing hypoxia and basic fibroblast growth factor supplementation. Cells produced using these conditions were generated 2.8 times faster than under traditional methods and the mMSCs showed decreased senescence and maintained their multipotency and differentiation potential until passage 11 and beyond. Our method for mMSC isolation and expansion will significantly improve the utility of this critical cell source in pre-clinical studies for the investigation of MSC mechanisms, therapies, and cell manufacturing strategies.


Conflict of interest statement

The authors declare that they have no competing interests.

Figures

Figure 1
Figure 1
MSC Culture Condition Development. (A) Schematic illustrating the workflow and conditions used to optimize the culture of mMSC. The fresh isolated bone marrow cells were divided into 4 groups: normoxic (20% O2) or hypoxic (5% O2) conditions +/−10 ng/mL of bFGF supplement. (B) The representative phase contrast images were acquired (10x) at different time points during the p0 to p1 growth phase: d3, d5, and d7 post-plating. (d14 images found in Fig. 2A). Scale bars = 500 μm.
Figure 2
Figure 2
Increasing Cell Number per cm2 Under Different MSC Culture Conditions. (A) 30 continuous phase contrast images were acquired and stitched together to demonstrate MSC colony size and density in each of the culture conditions. Scale bar = 2.5 mm. (B) Average cell number/cm2 was calculated when each of the culture conditions reached similar points of surface area coverage that were appropriate for passaging (n = 5–8 independent cell lines; *p < 0.001 vs. no treatment (white bars) and p < 0.0001 vs. normoxia). (C) Table reports the average cell number/cm2 with S.E.M. for n = 5–8 independent cell lines; *p < 0.001 vs. no treatment and p < 0.0001 vs. normoxia; data presented as mean ± S.E.M.
Figure 3
Figure 3
Increased MSC Proliferation Rates and Decreased Time to Passage 1. (A) The average number of days to reach similar levels of surface area coverage and for passaging from p0 to p1 and the average percent (%) increase in cell number/cm2 across the different culture conditions compared to classic normoxia conditions. n = 5–8; *p = 0.002 vs. normoxia, p < 0.0001 vs. normoxia. (B) Proliferation assay for each culture condition. n = 5–8; *p < 0.001 normoxia vs. normoxia+bFGF at d14 and d21; p < 0.001 vs. normoxia and normoxia+bFGF; p < 0.001 vs. normoxia and normoxia+bFGF, p < 0.005 vs. hypoxia; data presented as mean ± S.E.M.
Figure 4
Figure 4
Oxygen Tension and bFGF Supplementation Differentially Effect Senescence. (A) Representative phase contrast images (10x) of β-Gal staining for 4 different groups of cells. Scale bars = 200 μm. (B) % of β-Gal positive cells within a culture population. Image J software was used to quantify and analyze the stitched images and count the number of β-Gal positive cells and the total number of cells. n = 3; *p < 0.01; data presented as mean ± S.E.M.
Figure 5
Figure 5
Immunophenotyping MSCs by FACS Analysis and Verification of Multipotency by Differentiation. (A) p3–4 of mMSCs detected positive for the MSC markers CD44, Sca1 and CD90.2, and negative for the CD34, CD45, CD13, and CD31. (B and C) To validate multipotency, hypoxia and hypoxia+bFGF MSCs were induced to differentiate into adipocytes, chondrocytes, or osteoblasts. After differentiation, cells were stained as follows to confirm successful differentiation: (1) adipocytes were stained with Oil Red O, scale bars = 200 μm; (2) chondrocytes were stained with an antibody for Collagen II, scale bars = 200 μm and (3) osteoblasts were stained with Alizarin Red for calcium, scale bar = 200 μm (5B) and 50 μm (5C). Representative images for each cell type and differentiation condition are shown.
Figure 6
Figure 6
Culture conditions modulate MSC extra- and intra-cellular signaling. (A) Quantification of 32 cytokines in culture media and 8 phospho-proteins in cell lysates from MSCs cultured under four growth conditions for 7 days (multiplexed immunoassay, Millipore). All data were normalized to total protein in cell lysates and z-scored along each column. n = 3–4 independent cultures. (B) Multivariate discriminant partial least squares regression (D-PLSR) analysis segregated growth conditions based on either cytokine expression or phosphorylation of intracellular signaling proteins. Each analysis separated hypoxia+bFGF conditions to the right, normoxia toward the lower left and hypoxia toward the upper left. (C) The cytokine analysis separated samples along LV1 in terms of a linear combination of cytokines that correlate (positive values) or inversely correlate (negative values) with the hypoxia+bFGF condition. Error bars on each cytokine were generated by Monte Carlo sub-sampling the data set 1000 times, randomly removing 20% of the samples in each iteration and re-generating the LV1 profile each time (mean ± SD). (D) The phospho-protein analysis separates samples along LV1 in terms of a linear combination of phospho-proteins (mean ± SD, 1000 Monte Carlo iterations, 20% sample removal).
Figure 7
Figure 7
Sustained MSC Multipotentcy and in vivo Efficacy at Late Passages. (A) To verify that the MSCs retain multipotency at later passages (p11 and beyond), cells were stimulated to undergo tri-lineage differentiation and were evaluated. Adipogenesis and Chondrogenesis scale bars = 200 μm; Osteogenesis scale bar = 50 μm. (B) FACS histograms of p12 mMSCs grown in hypoxia+bFGF show that cells retain MSC specific surface marker expression and are positive for CD44, Sca1 and are negative for CD34, CD45, CD13, and CD31. At higher passages, however, cells have lost CD90.2 surface expression. (C) To test if late passage murine MSCs can promote and rescue neovascularization in a murine model of hindlimb ischemia, mMSCs (p11) were encapsulated in alginate and delivered to the ischemic hind limb (IL) by subcutaneous implantation. Laser Doppler perfusion imaging was performed at day 14 on animals that received either empty capsules or encapsulated mMSCs. Representative heat maps are presented to indicate perfusion levels. Perfusion levels were quantified for n = 3 animals per group and presented as a ratio of the perfusion level in the ischemic limb (IL) to the contralateral control non-ischemic limb (NIL). n = 3; *p = 0.02 vs. empty; data presented as mean ± S.E.M.

References

    1. Caplan AI. Review: mesenchymal stem cells: cell-based reconstructive therapy in orthopedics. Tissue Eng. 2005;11:1198–1211. doi: 10.1089/ten.2005.11.1198. - DOI - PubMed
    1. Baddoo M, et al. Characterization of mesenchymal stem cells isolated from murine bone marrow by negative selection. J Cell Biochem. 2003;89:1235–1249. doi: 10.1002/jcb.10594. - DOI - PubMed
    1. Phinney DG. Isolation of mesenchymal stem cells from murine bone marrow by immunodepletion. Methods Mol Biol. 2008;449:171–186. - PubMed
    1. Phinney DG, Kopen G, Isaacson RL, Prockop DJ. Plastic adherent stromal cells from the bone marrow of commonly used strains of inbred mice: variations in yield, growth, and differentiation. J Cell Biochem. 1999;72:570–585. doi: 10.1002/(SICI)1097-4644(19990315)72:4<570::AID-JCB12>3.0.CO;2-W. - DOI - PubMed
    1. Rosca AM, Burlacu A. Isolation of a mouse bone marrow population enriched in stem and progenitor cells by centrifugation on a Percoll gradient. Biotechnol Appl Biochem. 2010;55:199–208. doi: 10.1042/BA20090356. - DOI - PubMed

Publication types

LinkOut - more resources