

Dynamic and Modularized MicroRNA Regulation and Its Implication in Human Cancers
- PMID: 29042600
- PMCID: PMC5645395
- DOI: 10.1038/s41598-017-13470-5
Dynamic and Modularized MicroRNA Regulation and Its Implication in Human Cancers
Abstract
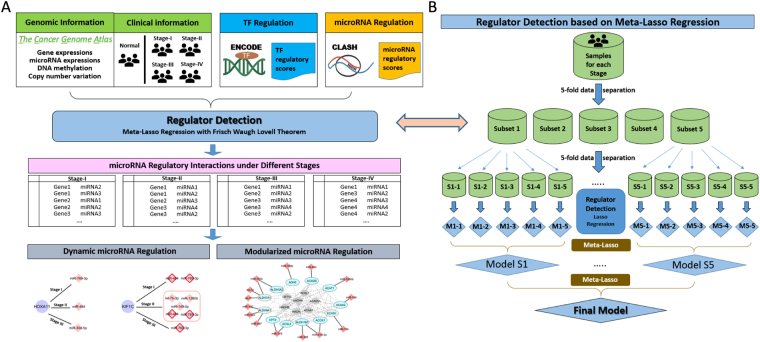
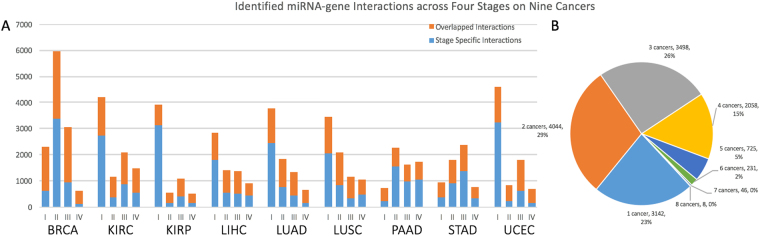
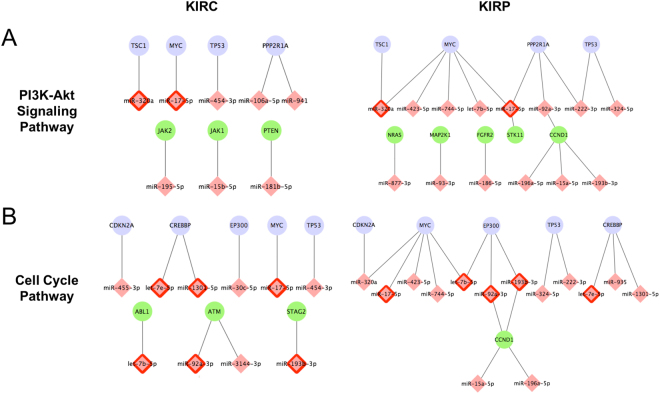
MicroRNA is responsible for the fine-tuning of fundamental cellular activities and human disease development. The altered availability of microRNAs, target mRNAs, and other types of endogenous RNAs competing for microRNA interactions reflects the dynamic and conditional property of microRNA-mediated gene regulation that remains under-investigated. Here we propose a new integrative method to study this dynamic process by considering both competing and cooperative mechanisms and identifying functional modules where different microRNAs co-regulate the same functional process. Specifically, a new pipeline was built based on a meta-Lasso regression model and the proof-of-concept study was performed using a large-scale genomic dataset from ~4,200 patients with 9 cancer types. In the analysis, 10,726 microRNA-mRNA interactions were identified to be associated with a specific stage and/or type of cancer, which demonstrated the dynamic and conditional miRNA regulation during cancer progression. On the other hands, we detected 4,134 regulatory modules that exhibit high fidelity of microRNA function through selective microRNA-mRNA binding and modulation. For example, miR-18a-3p, -320a, -193b-3p, and -92b-3p co-regulate the glycolysis/gluconeogenesis and focal adhesion in cancers of kidney, liver, lung, and uterus. Furthermore, several new insights into dynamic microRNA regulation in cancers have been discovered in this study.
Conflict of interest statement
The authors declare that they have no competing interests.
Figures


Similar articles
-
Elucidation of molecular links between obesity and cancer through microRNA regulation.BMC Med Genomics. 2020 Oct 30;13(1):161. doi: 10.1186/s12920-020-00797-8. BMC Med Genomics. 2020. PMID: 33121472 Free PMC article.
-
An in silico analysis of dynamic changes in microRNA expression profiles in stepwise development of nasopharyngeal carcinoma.BMC Med Genomics. 2012 Jan 19;5:3. doi: 10.1186/1755-8794-5-3. BMC Med Genomics. 2012. PMID: 22260379 Free PMC article.
-
Genome-scale MicroRNA target prediction through clustering with Dirichlet process mixture model.BMC Genomics. 2018 Sep 24;19(Suppl 7):658. doi: 10.1186/s12864-018-5029-7. BMC Genomics. 2018. PMID: 30255782 Free PMC article.
-
Systematic review of computational methods for identifying miRNA-mediated RNA-RNA crosstalk.Brief Bioinform. 2019 Jul 19;20(4):1193-1204. doi: 10.1093/bib/bbx137. Brief Bioinform. 2019. PMID: 29077860
-
An Overview of the Computational Models Dealing with the Regulatory ceRNA Mechanism and ceRNA Deregulation in Cancer.Methods Mol Biol. 2021;2324:149-164. doi: 10.1007/978-1-0716-1503-4_10. Methods Mol Biol. 2021. PMID: 34165714 Review.
Cited by
-
MiR-223-3p in Cancer Development and Cancer Drug Resistance: Same Coin, Different Faces.Int J Mol Sci. 2024 Jul 26;25(15):8191. doi: 10.3390/ijms25158191. Int J Mol Sci. 2024. PMID: 39125761 Free PMC article. Review.
-
Non-Coding RNAs: Foes or Friends for Targeting Tumor Microenvironment.Noncoding RNA. 2023 Aug 28;9(5):52. doi: 10.3390/ncrna9050052. Noncoding RNA. 2023. PMID: 37736898 Free PMC article. Review.
-
Sample-to-answer salivary miRNA testing: New frontiers in point-of-care diagnostic technologies.Wiley Interdiscip Rev Nanomed Nanobiotechnol. 2024 May-Jun;16(3):e1969. doi: 10.1002/wnan.1969. Wiley Interdiscip Rev Nanomed Nanobiotechnol. 2024. PMID: 38783564 Free PMC article. Review.
-
A Systematic Review of Circulatory microRNAs in Major Depressive Disorder: Potential Biomarkers for Disease Prognosis.Int J Mol Sci. 2022 Jan 24;23(3):1294. doi: 10.3390/ijms23031294. Int J Mol Sci. 2022. PMID: 35163214 Free PMC article.
-
pH dependence of C•A, G•A and A•A mismatches in the stem of precursor microRNA-31.Biophys Chem. 2022 Apr;283:106763. doi: 10.1016/j.bpc.2022.106763. Epub 2022 Jan 22. Biophys Chem. 2022. PMID: 35114594 Free PMC article.
References
Publication types
MeSH terms
Substances
Grants and funding
LinkOut - more resources
Full Text Sources
Other Literature Sources
