

Reduced nitric oxide levels during drought stress promote drought tolerance in barley and is associated with elevated polyamine biosynthesis
- PMID: 29042616
- PMCID: PMC5645388
- DOI: 10.1038/s41598-017-13458-1
Reduced nitric oxide levels during drought stress promote drought tolerance in barley and is associated with elevated polyamine biosynthesis
Abstract
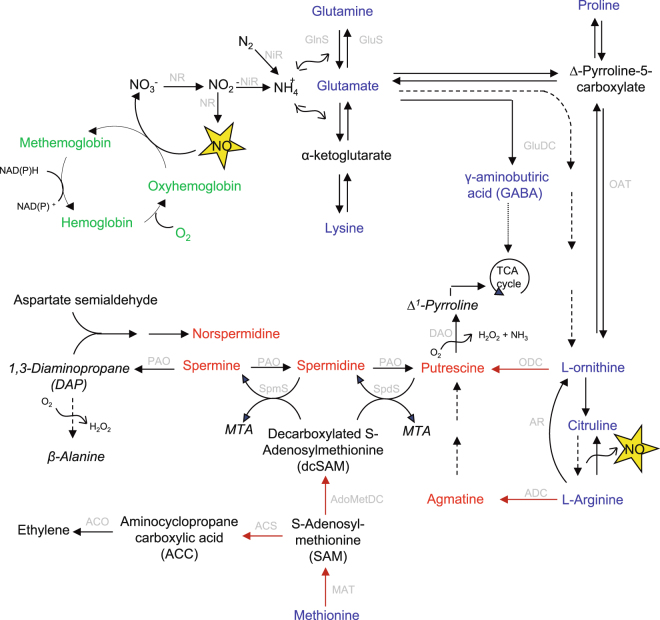
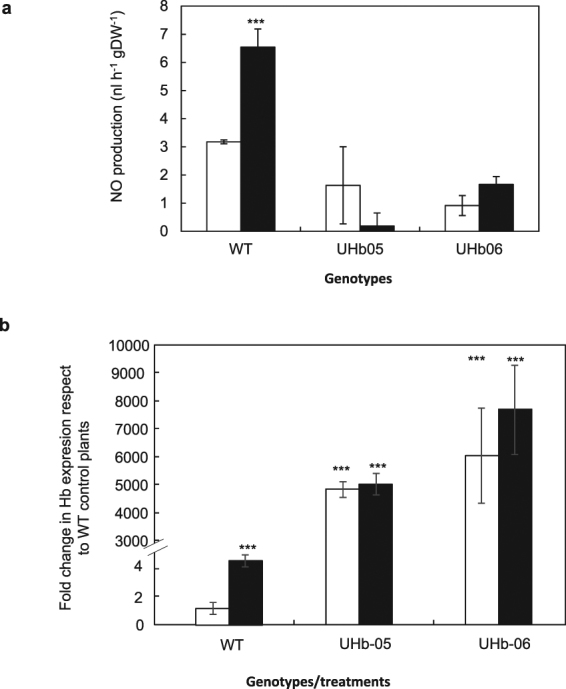
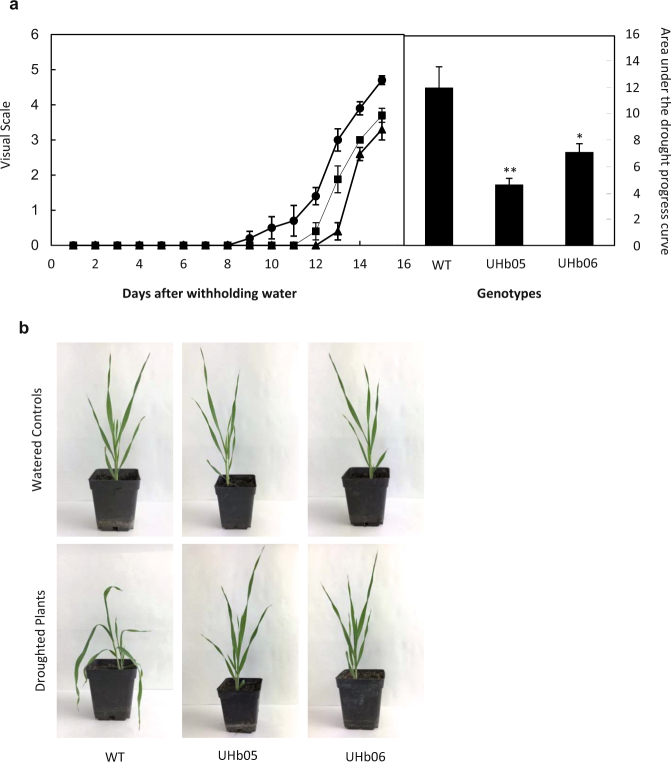
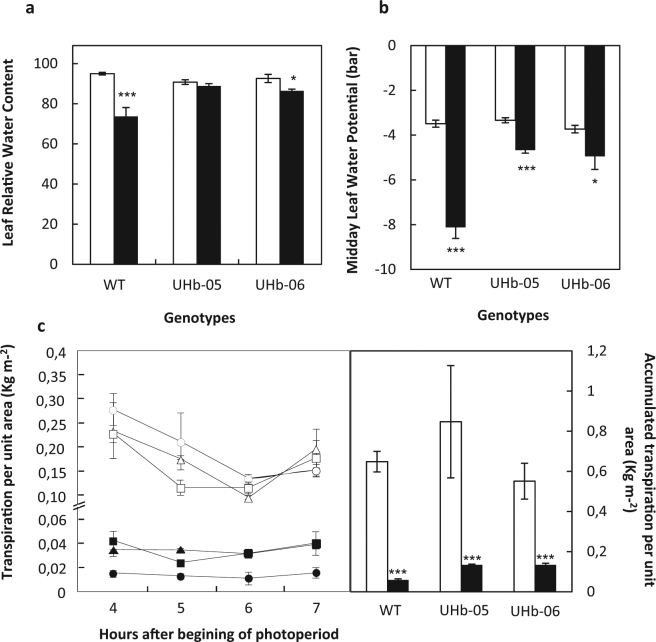
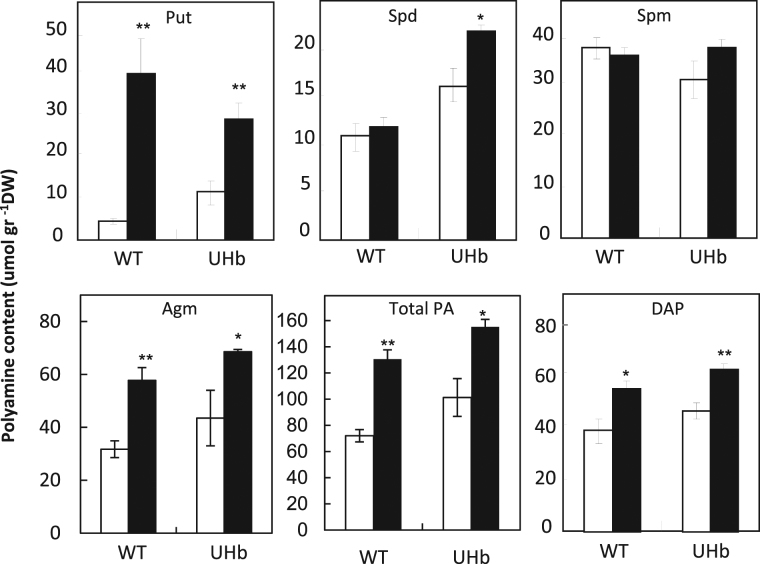
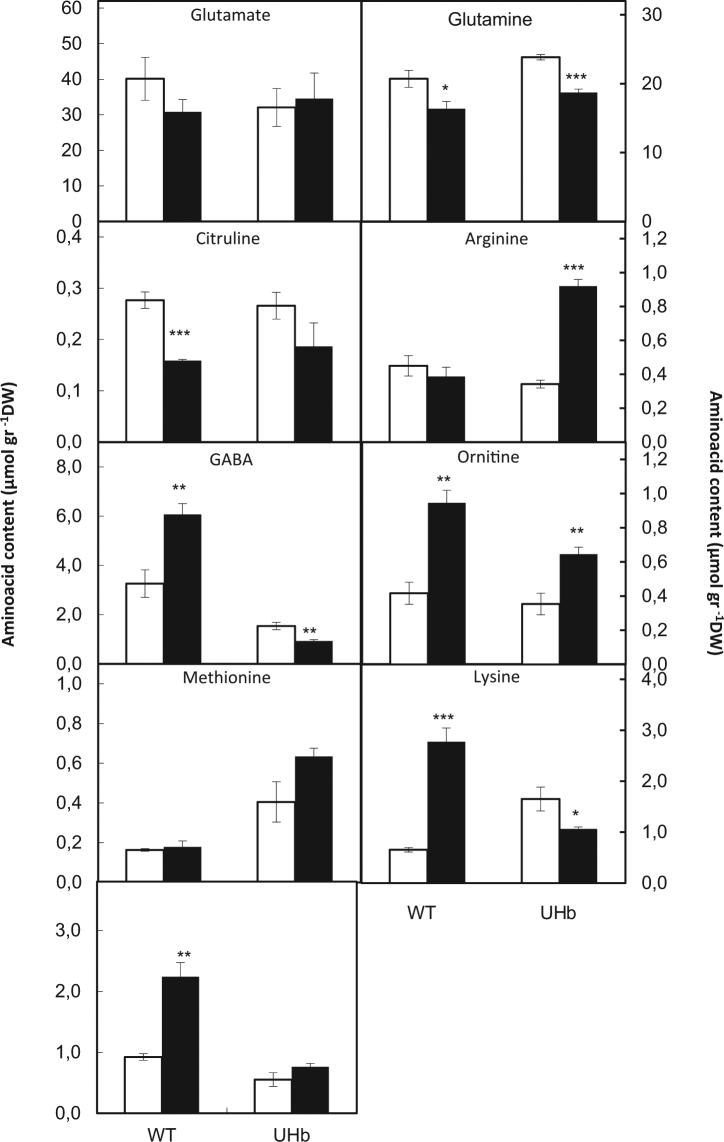
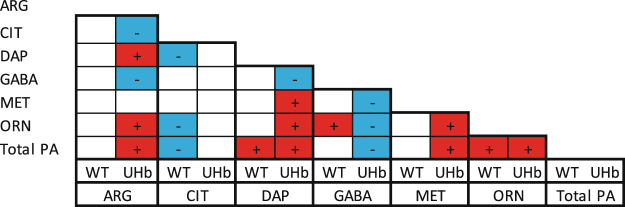
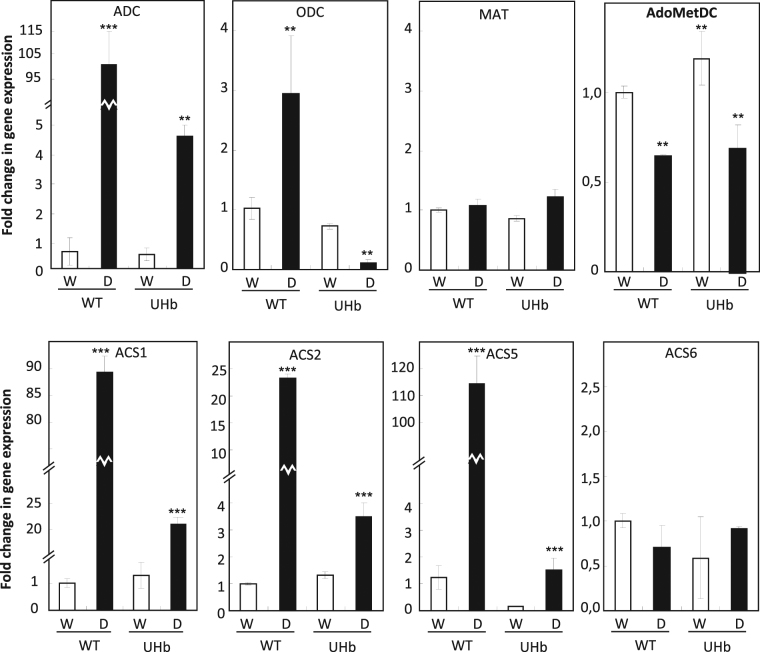
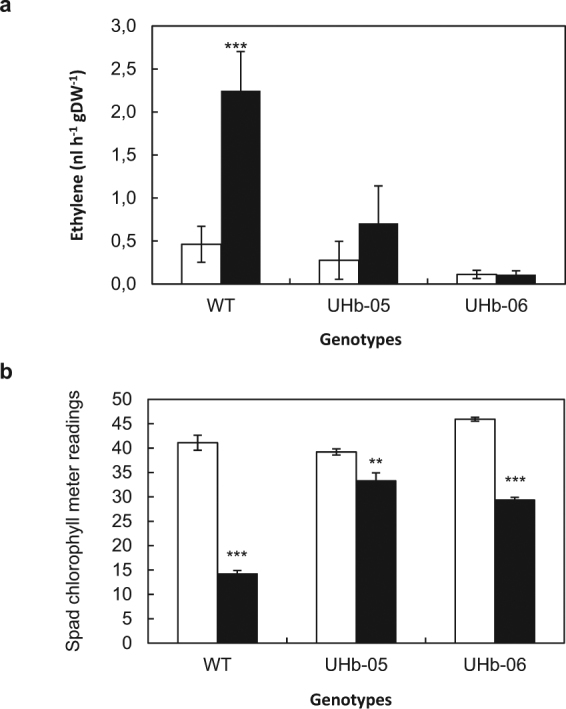
Nitric oxide (NO) is a key messenger in plant stress responses but its exact role in drought response remains unclear. To investigate the role of NO in drought response we employed transgenic barley plants (UHb) overexpressing the barley non-symbiotic hemoglobin gene HvHb1 that oxidizes NO to NO3-. Reduced NO production under drought conditions in UHb plants was associated with increased drought tolerance. Since NO biosynthesis has been related to polyamine metabolism, we investigated whether the observed drought-related NO changes could involve polyamine pathway. UHb plants showed increases in total polyamines and in particular polyamines such as spermidine. These increases correlated with the accumulation of the amino acid precursors of polyamines and with the expression of specific polyamine biosynthesis genes. This suggests a potential interplay between NO and polyamine biosynthesis during drought response. Since ethylene has been linked to NO signaling and it is also related to polyamine metabolism, we explored this connection. In vivo ethylene measurement showed that UHb plants significantly decrease ethylene production and expression of aminocyclopropane-1-carboxylic acid synthase gene, the first committed step in ethylene biosynthesis compared with wild type. These data suggest a NO-ethylene influenced regulatory node in polyamine biosynthesis linked to drought tolerance/susceptibility in barley.
Conflict of interest statement
The authors declare that they have no competing interests.
Figures
Similar articles
-
Abscisic acid, H2O2 and nitric oxide interactions mediated cold-induced S-adenosylmethionine synthetase in Medicago sativa subsp. falcata that confers cold tolerance through up-regulating polyamine oxidation.Plant Biotechnol J. 2014 Jun;12(5):601-12. doi: 10.1111/pbi.12166. Epub 2014 Feb 12. Plant Biotechnol J. 2014. PMID: 24517136
-
Dissecting rice polyamine metabolism under controlled long-term drought stress.PLoS One. 2013;8(4):e60325. doi: 10.1371/journal.pone.0060325. Epub 2013 Apr 8. PLoS One. 2013. PMID: 23577102 Free PMC article.
-
Expression of S-adenosyl methionine decarboxylase gene for polyamine accumulation in Egyptian cotton Giza 88 and Giza 90.GM Crops. 2010 Jul-Sep;1(4):257-66. doi: 10.4161/gmcr.1.4.13779. GM Crops. 2010. PMID: 21844681
-
Improvement of plant abiotic stress tolerance through modulation of the polyamine pathway.J Integr Plant Biol. 2014 Feb;56(2):114-21. doi: 10.1111/jipb.12128. Epub 2014 Jan 8. J Integr Plant Biol. 2014. PMID: 24401132 Review.
-
Spermine: Its Emerging Role in Regulating Drought Stress Responses in Plants.Cells. 2021 Jan 28;10(2):261. doi: 10.3390/cells10020261. Cells. 2021. PMID: 33525668 Free PMC article. Review.
Cited by
-
Putrescine: A Key Metabolite Involved in Plant Development, Tolerance and Resistance Responses to Stress.Int J Mol Sci. 2022 Mar 10;23(6):2971. doi: 10.3390/ijms23062971. Int J Mol Sci. 2022. PMID: 35328394 Free PMC article. Review.
-
Involvement of putrescine in osmotic stress-induced ABA signaling in leaves of wheat seedlings.J Biosci. 2019 Dec;44(6):136. J Biosci. 2019. PMID: 31894117
-
Phytoglobin overexpression promotes barley growth in the presence of enhanced level of atmospheric nitric oxide.J Exp Bot. 2019 Aug 29;70(17):4521-4537. doi: 10.1093/jxb/erz249. J Exp Bot. 2019. PMID: 31245808 Free PMC article.
-
A novel function of N-signaling in plants with special reference to Trichoderma interaction influencing plant growth, nitrogen use efficiency, and cross talk with plant hormones.3 Biotech. 2019 Mar;9(3):109. doi: 10.1007/s13205-019-1638-3. Epub 2019 Feb 28. 3 Biotech. 2019. PMID: 30863693 Free PMC article.
-
Identification of nitric oxide (NO)-responsive genes under hypoxia in tomato (Solanum lycopersicum L.) root.Sci Rep. 2020 Oct 5;10(1):16509. doi: 10.1038/s41598-020-73613-z. Sci Rep. 2020. PMID: 33020554 Free PMC article.
References
-
- Farooq M, Wahid A, Kobayashi N, Fujita D, Basra SMA. Plant drought stress: effects, mechanisms and management. Agron. Sustain. Dev. 2009;29:185–212. doi: 10.1051/agro:2008021. - DOI
Publication types
MeSH terms
Substances
LinkOut - more resources
Full Text Sources
Other Literature Sources
