

Worsening calcification propensity precedes all-cause and cardiovascular mortality in haemodialyzed patients
- PMID: 29042624
- PMCID: PMC5645333
- DOI: 10.1038/s41598-017-12859-6
Worsening calcification propensity precedes all-cause and cardiovascular mortality in haemodialyzed patients
Abstract
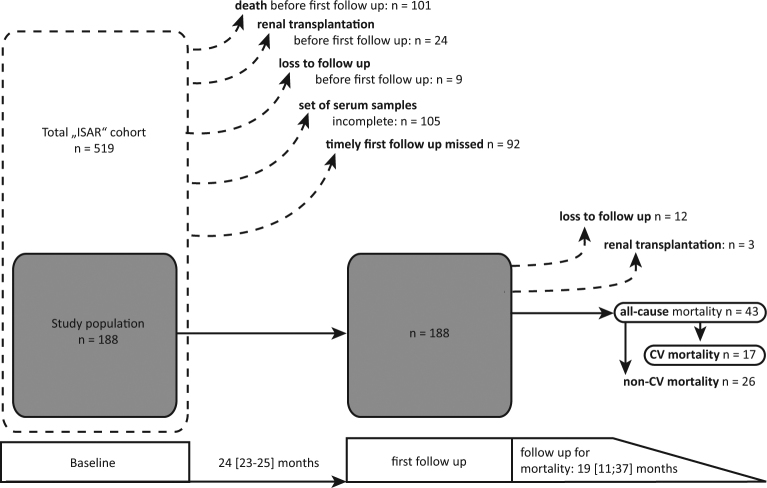
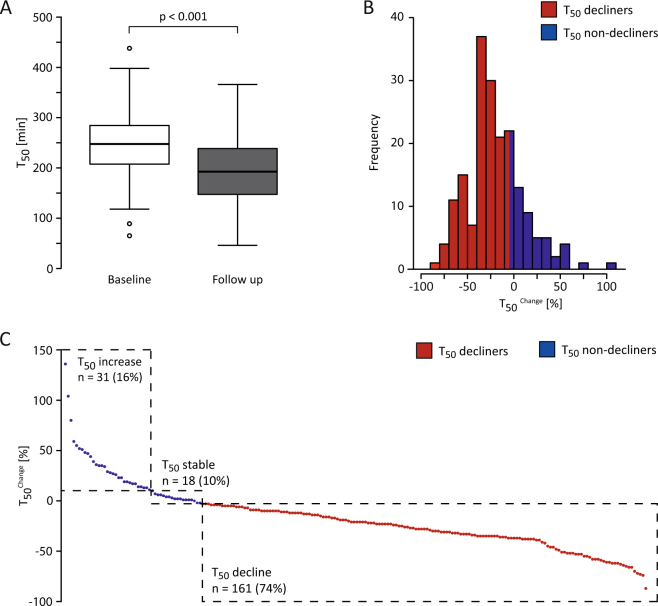
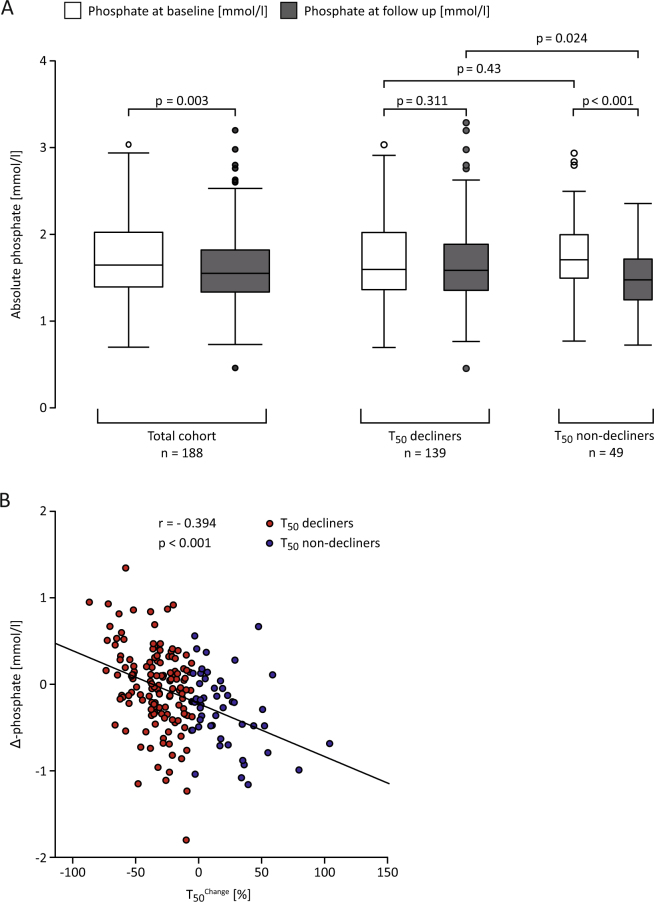
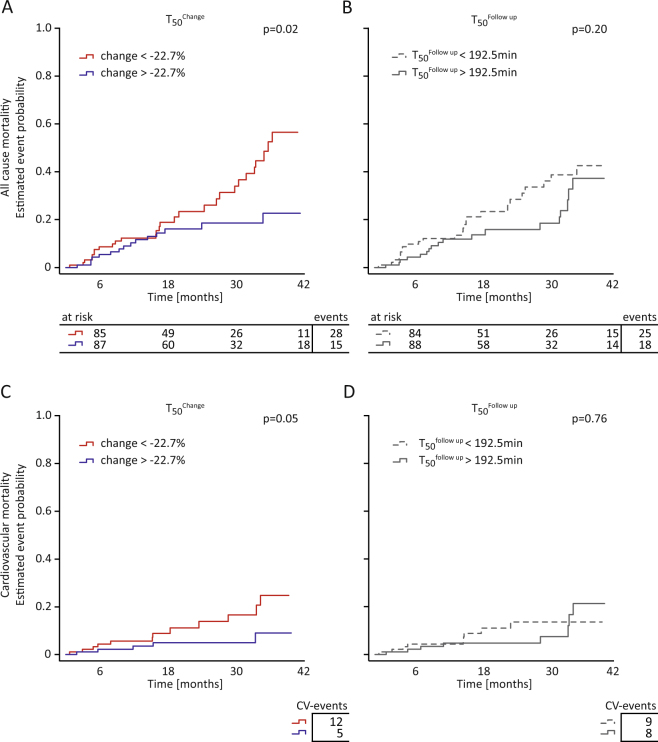
A novel in-vitro test (T50-test) assesses ex-vivo serum calcification propensity which predicts mortality in HD patients. The association of longitudinal changes of T50 with all-cause and cardiovascular mortality has not been investigated. We assessed T50 in paired sera collected at baseline and at 24 months in 188 prevalent European HD patients from the ISAR cohort, most of whom were Caucasians. Patients were followed for another 19 [interquartile range: 11-37] months. Serum T50 exhibited a significant decline between baseline and 24 months (246 ± 64 to 190 ± 68 minutes; p < 0.001). With serum Δ-phosphate showing the strongest independent association with declining T50 (r = -0.39; p < 0.001) in multivariable linear regression. The rate of decline of T50 over 24 months was a significant predictor of all-cause (HR = 1.51 per 1SD decline, 95% CI: 1.04 to 2.2; p = 0.03) and cardiovascular mortality (HR = 2.15; 95% CI: 1.15 to 3.97; p = 0.02) in Kaplan Meier and multivariable Cox-regression analysis, while cross-sectional T50 at inclusion and 24 months were not. Worsening serum calcification propensity was an independent predictor of mortality in this small cohort of prevalent HD patients. Prospective larger scaled studies are needed to assess the value of calcification propensity as a longitudinal parameter for risk stratification and monitoring of therapeutic interventions.
Conflict of interest statement
A.P. is an employee and stock holder of Calciscon. G.L., D.S. and C.S. receive Investigator-Initiated Research grant support from Baxter completely unrelated to this project. G.L. was supported by a research scholarship of the Else Kröner-Fresenius-Stiftung for physician scientists.
Figures
Similar articles
-
Serum Calcification Propensity and the Risk of Cardiovascular and All-Cause Mortality in the General Population: The PREVEND Study.Arterioscler Thromb Vasc Biol. 2020 Aug;40(8):1942-1951. doi: 10.1161/ATVBAHA.120.314187. Epub 2020 Jun 4. Arterioscler Thromb Vasc Biol. 2020. PMID: 32493170
-
Acetate-free, citrate-acidified bicarbonate dialysis improves serum calcification propensity-a preliminary study.Nephrol Dial Transplant. 2018 Nov 1;33(11):2043-2051. doi: 10.1093/ndt/gfy134. Nephrol Dial Transplant. 2018. PMID: 29860419
-
Blood Calcification Propensity, Cardiovascular Events, and Survival in Patients Receiving Hemodialysis in the EVOLVE Trial.Clin J Am Soc Nephrol. 2017 Feb 7;12(2):315-322. doi: 10.2215/CJN.04720416. Epub 2016 Dec 9. Clin J Am Soc Nephrol. 2017. PMID: 27940458 Free PMC article. Clinical Trial.
-
Novel assessments of systemic calcification propensity.Curr Opin Nephrol Hypertens. 2016 Jul;25(4):278-84. doi: 10.1097/MNH.0000000000000237. Curr Opin Nephrol Hypertens. 2016. PMID: 27228365 Review.
-
Calciprotein Particles and Serum Calcification Propensity: Hallmarks of Vascular Calcifications in Patients with Chronic Kidney Disease.J Clin Med. 2020 Apr 29;9(5):1287. doi: 10.3390/jcm9051287. J Clin Med. 2020. PMID: 32365608 Free PMC article. Review.
Cited by
-
Serum Calcification Propensity T50 Is Associated with Soluble Thrombomodulin in Patients on Hemodialysis.J Clin Med. 2024 Jun 14;13(12):3491. doi: 10.3390/jcm13123491. J Clin Med. 2024. PMID: 38930020 Free PMC article.
-
Serum Calcification Propensity in Children on Chronic Hemodialysis.Kidney Int Rep. 2020 Jul 2;5(9):1528-1531. doi: 10.1016/j.ekir.2020.06.022. eCollection 2020 Sep. Kidney Int Rep. 2020. PMID: 32954079 Free PMC article. No abstract available.
-
Propensity for Calcification in Serum Associates With 2-Year Cardiovascular Mortality in Ischemic Heart Failure With Reduced Ejection Fraction.Front Med (Lausanne). 2021 Jun 18;8:672348. doi: 10.3389/fmed.2021.672348. eCollection 2021. Front Med (Lausanne). 2021. PMID: 34222283 Free PMC article.
-
Calciprotein Particles: Balancing Mineral Homeostasis and Vascular Pathology.Arterioscler Thromb Vasc Biol. 2021 May 5;41(5):1607-1624. doi: 10.1161/ATVBAHA.120.315697. Epub 2021 Mar 11. Arterioscler Thromb Vasc Biol. 2021. PMID: 33691479 Free PMC article. Review.
-
The Role of Mitochondrial Dysfunction in CKD-Related Vascular Calcification: From Mechanisms to Therapeutics.Kidney Int Rep. 2024 May 14;9(9):2596-2607. doi: 10.1016/j.ekir.2024.05.005. eCollection 2024 Sep. Kidney Int Rep. 2024. PMID: 39291213 Free PMC article. Review.
References
-
- Foley RN, Parfrey PS, Sarnak MJ. Epidemiology of cardiovascular disease in chronic renal disease. J. Am. Soc. Nephrol. 1998;9:S16–23. - PubMed
MeSH terms
Substances
LinkOut - more resources
Full Text Sources
Other Literature Sources
Medical
