. 2017 Oct 17;7(1):13362.
doi: 10.1038/s41598-017-13835-w.

HIV-1 viral protein R (Vpr) induces fatty liver in mice via LXRα and PPARα dysregulation: implications for HIV-specific pathogenesis of NAFLD

Affiliations

HIV-1 viral protein R (Vpr) induces fatty liver in mice via LXRα and PPARα dysregulation: implications for HIV-specific pathogenesis of NAFLD

Neeti Agarwal et al. Sci Rep. .

Abstract

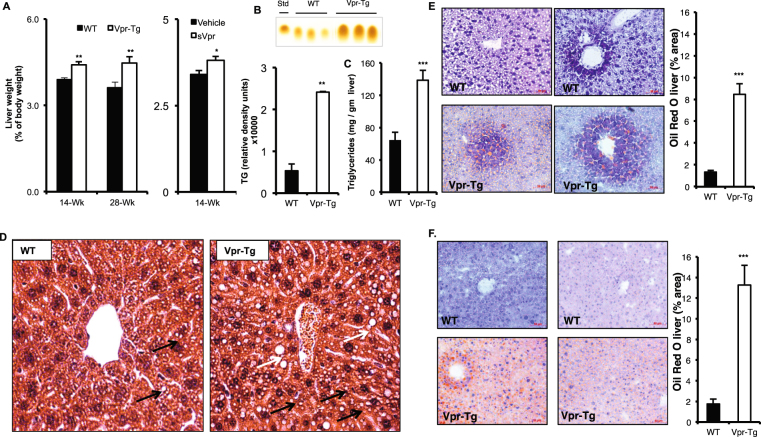
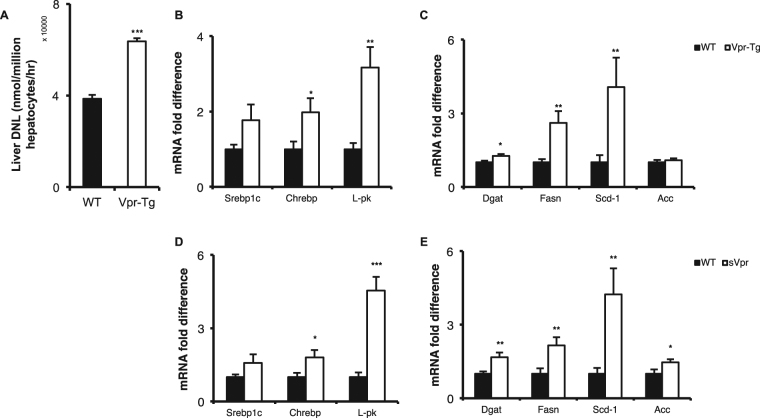
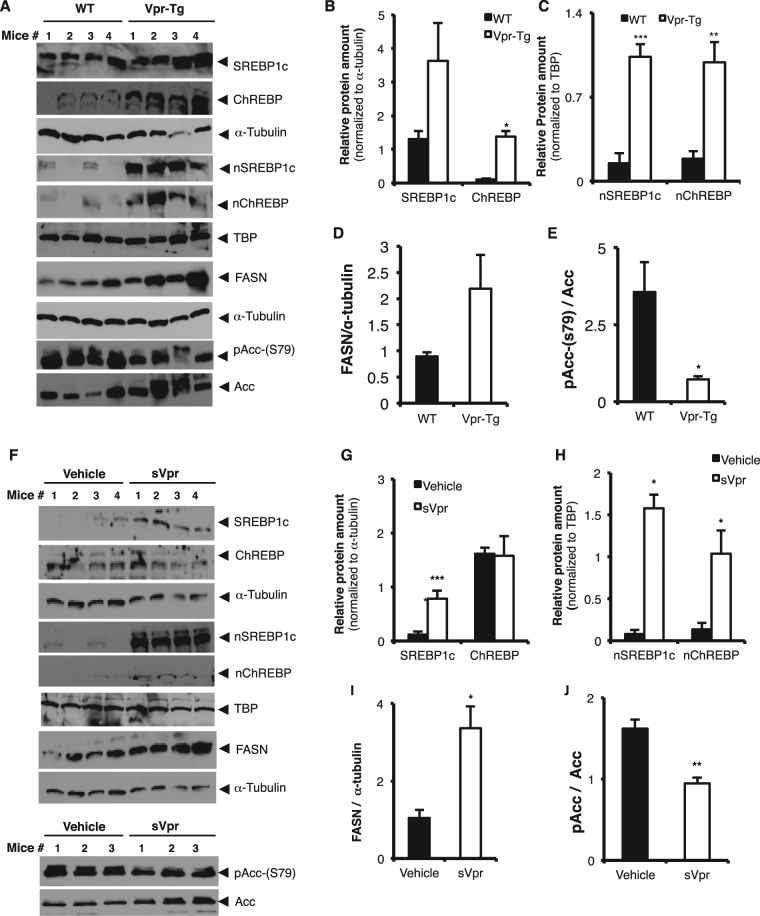
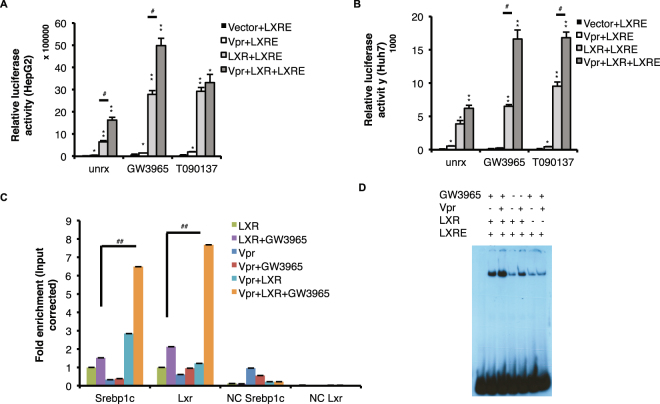
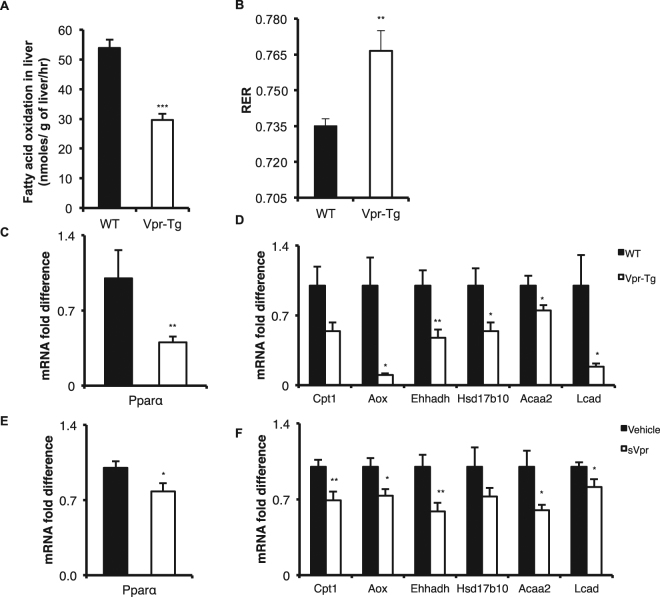
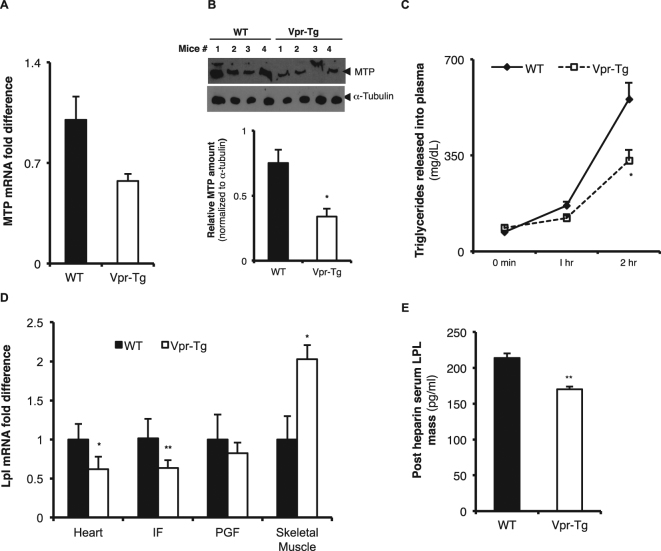
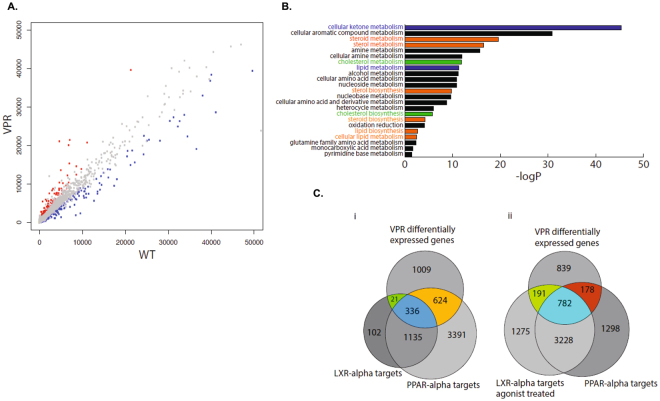
HIV patients develop hepatic steatosis. We investigated hepatic steatosis in transgenic mice expressing the HIV-1 accessory protein Vpr (Vpr-Tg) in liver and adipose tissues, and WT mice infused with synthetic Vpr. Vpr-Tg mice developed increased liver triglyceride content and elevated ALT, bilirubin and alkaline phosphatase due to three hepatic defects: 1.6-fold accelerated de novo lipogenesis (DNL), 45% slower fatty acid ß-oxidation, and 40% decreased VLDL-triglyceride export. Accelerated hepatic DNL was due to coactivation by Vpr of liver X receptor-α (LXRα) with increased expression of its lipogenic targets Srebp1c, Chrebp, Lpk, Dgat, Fasn and Scd1, and intranuclear SREBP1c and ChREBP. Vpr enhanced association of LXRα with Lxrα and Srebp1c promoters, increased LXRE-LXRα binding, and broadly altered hepatic expression of LXRα-regulated lipid metabolic genes. Diminished hepatic fatty acid ß-oxidation was associated with decreased mRNA expression of Pparα and its targets Cpt1, Aox, Lcad, Ehhadh, Hsd10 and Acaa2, and blunted VLDL export with decreased expression of Mttp and its product microsomal triglyceride transfer protein. With our previous findings that Vpr circulates in HIV patients (including those with undetectable plasma HIV-1 RNA), co-regulates the glucocorticoid receptor and PPARγ and transduces hepatocytes, these data indicate a potential role for Vpr in HIV-associated fatty liver disease.


Conflict of interest statement

The authors declare that they have no competing interests.

Figures

Figure 1
Figure 1
Vpr transgenic mice develop hepatosteatosis. (A) Increased liver mass (normalized to body weight) was present in Vpr-Tg compared to WT mice of 14 week old mice (n = 5–6 per group) and 28 week old mice (n = 4–5 per group) and sVpr- compared to vehicle-treated mice (n = 7 per group). (B) Increased liver triglyceride content was present in Vpr-Tg mice by TLC (n = 3 per group) and (C) by colorimetric assay (n = 5–6 per group). (D) Steatosis was observed in Vpr-Tg liver (hematoxylin-eosin stain). Left panel shows liver parenchyma around a centrilobular vein in WT mouse, with a pattern of microsteatosis (black arrows). Right panel shows peri-centrilobular area of liver in Vpr-Tg mouse, with both microsteatosis (black arrows) and macrosteatosis (white arrows). Scale bar = 50 μm. (E) Oil Red O–stained liver sections of 14-week Vpr-Tg show increased lipid accumulation compared to WT mice. Bar graph shows quantification of ORO-stained area. (F) Oil Red O–stained liver sections of 28-week Vpr-Tg show progressive lipid accumulation compared to WT mice. Bar graph shows quantification of ORO-stained area. Values are mean ± SE. *P < 0.05, **P < 0.01, ***P < 0.001.
Figure 2
Figure 2
Increased de novo lipogenesis and mRNA levels of LXR-regulated lipogenic genes in liver of Vpr-Tg and sVpr-treated mice. (A) Faster conversion of [14C]acetate into [14C]-labeled fatty acids in primary hepatocytes was noted in Vpr-Tg compared to WT mice (N = 3 per group). (B) Increased mRNA levels of Chrebp and its target Lpk were present in Vpr-Tg compared to WT mice (N = 8 per group). (C) mRNA levels of Dgat, Fasn and Scd1 were present in Vpr-Tg compared to WT mice (N = 8 per group). (D) mRNA levels of Chrebp and Lpk were increased, and there was a trend towards increased mRNA level of Srebp1c (P = 0.077), in sVpr-treated compared to vehicle-treated mice (N = 8 per group). (E) Increased mRNA levels of Dgat, Fasn, Scd1 and Acc were noted in sVpr-treated compared to vehicle-treated mice (N = 8 per group). Values are mean ± SE. *P < 0.05, **P < 0.01, ***P < 0.001.
Figure 3
Figure 3
Increased amounts and activation of regulatory lipogenic proteins in liver of Vpr-Tg and sVpr-treated mice. (A) Immunoblots show expression of transcription factors and their target proteins in Vpr-Tg vs. WT mice (N = 4 per group). (B) There was a trend towards increased SREBP1c (P = 0.1) and increased ChREBP expression in whole cell extracts of Vpr-Tg compared to WT mice (N = 4 per group). (C) SREBP1c and ChREBP amounts were increased in nuclear fractions of Vpr-Tg compared to WT mice (N = 4 per group). (D) There was a trend towards increased FASN (p = 0.1) in Vpr-Tg compared to WT mice (N = 4 per group). (E) The ratio of phosphoS79-Acc to ACC was decreased in whole cell extracts of Vpr-Tg compared to WT mice (N = 4 per group). (F) Immunoblots show expression of transcription factor and their target proteins in sVpr-treated vs. vehicle-treated mice (N = 4 per group; N = 3 per group for ACC/pACC). (G) There was increased SREBP1c but not ChREBP in whole cell extracts of sVpr-treated compared to vehicle-treated mice (N = 4 per group). (H) There was increased SREBP1c and ChREBP in nuclear fractions of sVpr-treated compared to vehicle-treated mice (N = 4 per group). (I,J) There were increased FASN (N = 4 per group) and decreased ratio of phosphoS79-ACC to ACC (N = 3 per group) in whole cell extracts of sVpr-treated compared to vehicle-treated mice. Multiple replicate immunoblots were prepared for each experiment with 50 µg total protein loaded per lane, and each immunoblot probed was with a different antibody.Values are mean ± SE. *P < 0.05, **P < 0.01. [Note: Immunoblot figures have been cropped to show relevant bands. Original uncropped blots are shown in Supplementary Fig. S2A and B. No image enhancement was used, but the bluish background of the original autoradiogram was changed to gray].
Figure 4
Figure 4
Vpr binds to LXRα and enhances LXRE-dependent promoter activity. (A) Vpr increased luciferase activity in HepG2 cells transfected with a LXRE-luciferase construct, with or without exogenous LXRα, in the presence or absence of LXR agonists GW3965 or T090137. (B) Vpr increased luciferase activity in Huh7 cells transfected with an LXRE-luciferase construct, with or without exogenous LXRα, in the presence or absence of LXR agonists GW3965 or T0901317. (C) Vpr increased association of LXRα with LXRE promoter DNA sequences of Srebp1c (P = 0.007) and Lxr (P = 0.009) in the presence of GW3965, as measured by ChIP (using LXRα antibody) followed by qPCR. Off-target DNA sequences ~2 kb upstream of the LXRE sites were amplified as negative controls (NC). (D) Vpr increased binding of LXRα to 32P-labeled LXRE in nuclear extracts of HepG2 cells, in the presence or absence of GW3965, as measured by gel mobility retardation assay. Data are presented as means ± SE of two replicates, and are representative of two experiments. In A and B, *P < 0.05 and **P < 0.01 compared to Vector + LXRE; ## P < 0.01.
Figure 5
Figure 5
Impaired fatty acid oxidation and decreased mRNA levels of PPARα-regulated oxidative genes in liver of Vpr-Tg and sVpr-treated mice. (A) Fatty acid oxidation was decreased in liver of Vpr-Tg compared to WT mice (P = 0.006; N = 6 per group). (B) Increased respiratory exchange ratio (RER) was present during the initial 4 h of fasting in Vpr-Tg compared to WT mice (N = 5–6 per group). (C) Pparα mRNA level was decreased in liver of Vpr-Tg compared to WT mice (N = 5–6 per group). (D) mRNA levels of Aox, Ehhadh, Hsd17b10, Acaa2 and Lcad were decreased in liver of Vpr-Tg compared to WT mice (N = 5–8 per group). (E) mRNA level of Pparα was decreased in sVpr-treated compared to vehicle-treated mice (N = 7 per group). (F) mRNA levels of Cpt1α, Aox, Ehhadh, Acaa2 and Lcad were decreased in sVpr-treated compared to vehicle-treated mice (N = 7 per group). Values are mean ± SE. *P < 0.05, **P < 0.01, ***P < 0.001.
Figure 6
Figure 6
Altered levels of MTP and blunted VLDL-TG export in liver of Vpr-Tg mice. (A) There was a trend towards decreased Mttp mRNA in liver of Vpr-Tg compared to WT mice (P = 0.077, N = 5–6 per group). (B) Decreased protein level of MTP was present in liver of Vpr-Tg compared to WT mice (N = 4 per group). (C) Decreased VLDL export was observed in liver from Vpr-Tg compared to WT mice following injection of the LPL inhibitor Pluronic F-127 (N = 4 per group). (D) There was variably altered Lpl mRNA in heart, inguinal fat, perigonadal fat and skeletal muscle of Vpr-Tg compared to WT mice (N = 7–8 per group). (E) Decreased LPL mass was present in Vpr-Tg compared to WT mouse plasma following heparin injection (N = 4 per group). Values are mean ± SE. *P < 0.05, **P < 0.01. [Note: Immunoblot figures have been cropped to show relevant bands. Original uncropped blots are shown in Supplementary Fig. S3. No image enhancement was used, but the bluish background of the original autoradiogram was changed to gray].
Figure 7
Figure 7
RNA-Seq analysis of liver reveals that Vpr regulates expression of a broad array of genes related to lipid metabolism. (A) Scatterplot of gene expression from RNA-Seq in Vpr-Tg compared with WT mouse liver. Each point represents a gene that was found to be expressed in both samples. The x-axis represents WT mouse expression and y-axis Vpr-Tg mouse expression in terms of library normalized counts. The red points are significantly upregulated genes and blue points significantly downregulated genes (P < 0.05). The plot is censored to a count of 50,000 for visualization purposes. (B) Gene ontology (GO) analysis for significantly different genes under the biological processes ontology framework. Of the genes for which expression differed significantly between Vpr-Tg and WT mouse livers, 46% belong to the ontology of metabolic processes. Significant ontologies within this subset are displayed (P < 0.05 using Benjamini correction, with a minimal fold change of 2). In particular, lipid and sterol metabolic pathways are highly represented. (C) Vpr binds preferentially to LXRα gene targets. LXRα and PPARα targets were identified by filtering a genome-wide study (27) to regions proximal to the transcriptional start site (within −10 kb to +5 kb with a 20 kb extension) using GREAT version 3.0. There are 4 datasets from fasted mice: LXRα binding sites in WT animals, LXRα binding sites in animals treated with the LXRα agonist T0901317, PPARα binding sites in WT animals, and PPARα binding sites in animals with a LXRα/β double knockout background. (i) In fasted animals, more PPARα binding sites than LXRα binding sites are recovered from the ChIP-Seq. In this state, the effect of Vpr on gene expression shows minimal overlap to LXRα binding, and is skewed towards PPARα targets. (ii) After treatment with the LXRα agonist, there is both more LXRα binding to unique regions, as well as with shared PPARα regions. Activation of LXRα by its agonist results in greater overlap with Vpr-induced gene expression.

Similar articles

Cited by

References

    1. Hadigan C, Liebau J, Andersen R, Holalkere NS, Sahani DV. Magnetic resonance spectroscopy of hepatic lipid content and associated risk factors in HIV infection. J Acquir Immune Defic Syndr. 2007;46:312–317. doi: 10.1097/QAI.0b013e3181568cc2. - DOI - PubMed
    1. Crum-Cianflone N, et al. Nonalcoholic fatty liver disease among HIV-infected persons. J Acquir Immune Defic Syndr. 2009;50:464–473. doi: 10.1097/QAI.0b013e318198a88a. - DOI - PMC - PubMed
    1. Guaraldi G, et al. Nonalcoholic fatty liver disease in HIV-infected patients referred to a metabolic clinic: prevalence, characteristics, and predictors. Clin Infect Dis. 2008;47:250–257. doi: 10.1086/589294. - DOI - PubMed
    1. Li Vecchi V, et al. Prospective evaluation of hepatic steatosis in HIV-infected patients with or without hepatitis C virus co-infection. Int J Infect Dis. 2012;16:e397–402. doi: 10.1016/j.ijid.2012.01.011. - DOI - PubMed
    1. Sterling RK, et al. Steatohepatitis: Risk factors and impact on disease severity in human immunodeficiency virus/hepatitis C virus coinfection. Hepatology. 2008;47:1118–1127. doi: 10.1002/hep.22134. - DOI - PMC - PubMed

Publication types

MeSH terms