. 2017 Sep 29:8:731.
doi: 10.3389/fphys.2017.00731. eCollection 2017.

Influence of Standard Laboratory Procedures on Measures of Erythrocyte Damage

Affiliations

Influence of Standard Laboratory Procedures on Measures of Erythrocyte Damage

Lena Wiegmann et al. Front Physiol. .

Abstract

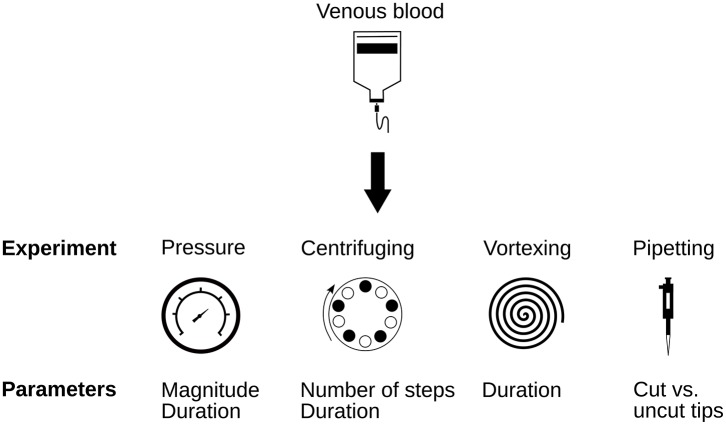
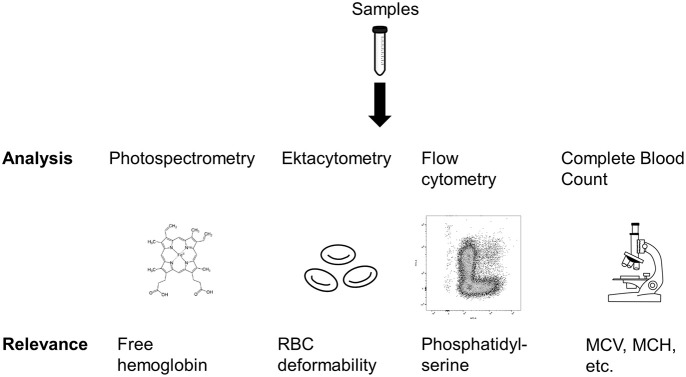
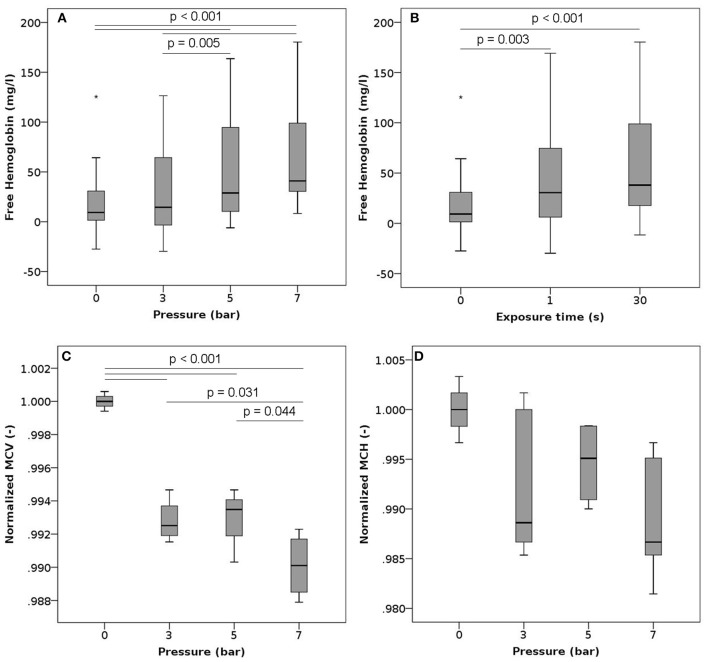
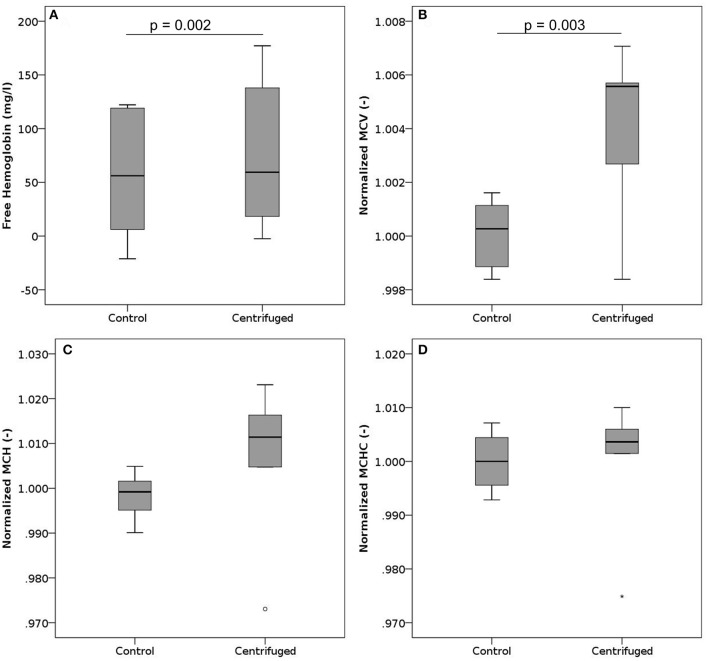
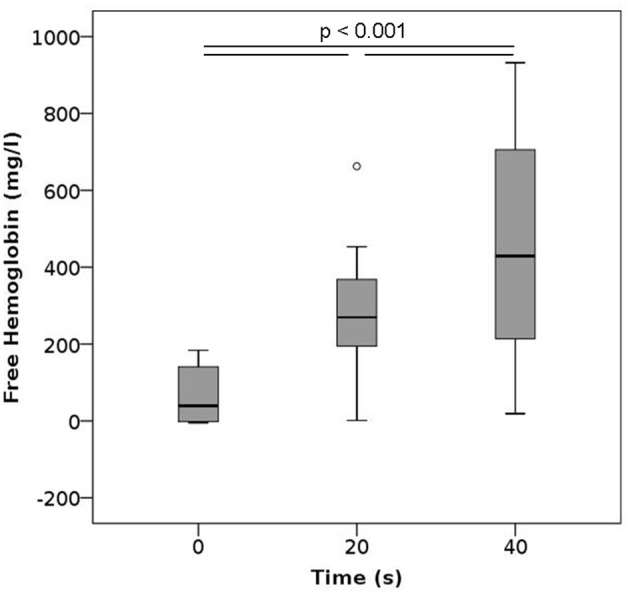
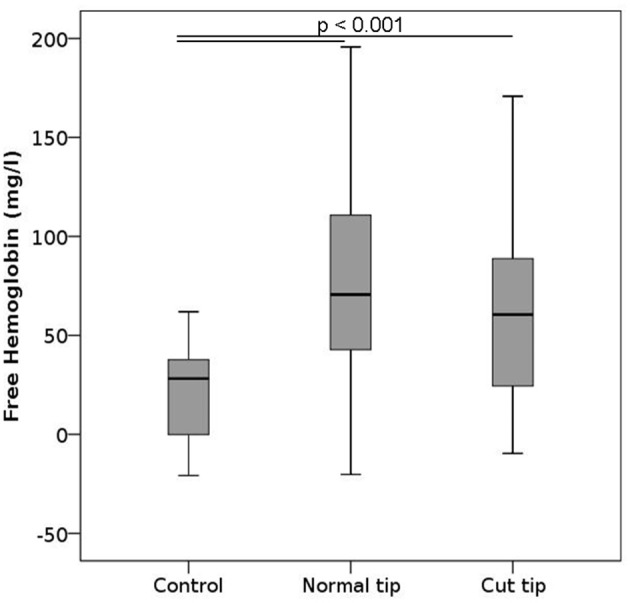
The ability to characterize the mechanical properties of erythrocytes is important in clinical and research contexts: to diagnose and monitor hematologic disorders, as well as to optimize the design of cardiovascular implants and blood circulating devices with respect to blood damage. However, investigation of red blood cell (RBC) properties generally involves preparatory and processing steps. Even though these impose mechanical stresses on cells, little is known about their impact on the final measurement results. In this study, we investigated the effect of centrifuging, vortexing, pipetting, and high pressures on several markers of mechanical blood damage and RBC membrane properties. Using human venous blood, we analyzed erythrocyte damage by measuring free hemoglobin, phosphatidylserine exposure by flow cytometry, RBC deformability by ektacytometry and the parameters of a complete blood count. We observed increased levels of free hemoglobin for all tested procedures. The release of hemoglobin into plasma depended significantly on the level of stress. Elevated pressures and centrifuging also altered mean cell volume (MCV) and mean corpuscular hemoglobin (MCH), suggesting changes in erythrocyte population, and membrane properties. Our results show that the effects of blood handling can significantly influence erythrocyte damage metrics. Careful quantification of this influence as well as other unwanted secondary effects should thus be included in experimental protocols and accounted for in clinical laboratories.

Keywords: centrifugation; ektacytometry; erythrocytes; free hemoglobin; pipetting; red blood cells; vortexing.


Figures

Figure 1
Figure 1
Overview over the experimental setups presented in this study.
Figure 2
Figure 2
Overview of the analyses performed in this study. MCV, Mean cell volume; MCH, Mean corpuscular hemoglobin. Sources: Tube: https://pixabay.com/en/tube-conical-test-measured-305147/; Heme: https://commons.wikimedia.org/wiki/File:Heme_b.svg; Microscope: https://pixabay.com/en/microscope-lab-chemistry-science-2223268/.
Figure 3
Figure 3
Free hemoglobin, MCV and MCH after exposure to high pressure. Blood samples were exposed to high pressures (varying between 3 and 7 bars) 10 times (single exposure duration of 1 or 30 s) with a 30 s recovery period between two consecutive exposures. (A) Free hemoglobin as a function of the pressure level (irrespective of the exposure time) n = 18, 22, 20, and 21 for high pressures of 0, 3, 5, and 7 bar, respectively. (B) Free hemoglobin as a function of the exposure duration (irrespective of the pressure level) n = 18, 33, and 30 for exposures of 0, 1, and 30 s, respectively. (C) Normalized mean cell volume as a function of the pressure level (exposure time 1 s). Reported values have been normalized by the mean of the corresponding control measurements. n = 4, 4, 3, and 4 for high pressures of 0, 3, 5, and 7 bar, respectively. (D) Normalized mean corpuscular hemoglobin as a function of the pressure level (exposure time 1 s). Reported values have been normalized by the mean of the corresponding control measurements. n = 4, 4, 3, and 4 for high pressures of 0, 3, 5, and 7 bar, respectively.
Figure 4
Figure 4
Free hemoglobin, MCV, MCH, and MCHC after centrifugation. Blood samples where centrifuged at 900 g. (A) Free hemoglobin after centrifugation for 5 or 10 min. The black line indicates the median, while the mean values are 61 mg/l and 79 mg/l for controls and centrifuged samples, respectively. n per group = 12. (B) Normalized mean cell volume after centrifugation for 5 min. Reported values have been normalized by the mean of the corresponding control measurements. n per group = 6. (C) Normalized mean corpuscular hemoglobin after centrifugation for 5 min. Reported values have been normalized by the mean of the corresponding control measurements. n per group = 6. (D) Normalized mean corpuscular hemoglobin concentration after centrifugation for 5 min. Reported values have been normalized by the mean of the corresponding control measurements. n per group = 6.
Figure 5
Figure 5
Free hemoglobin after vortexing as a function of the vortexing time. n per group = 12.
Figure 6
Figure 6
Free hemoglobin after pipetting. Blood samples were primed and relieved from the pipet 10 consecutive times. The pipet tip was either normal or cut 7 mm away from the leading edge. n per group = 12.

References

    1. Bai G., Bee J. S., Biddlecombe J. G., Chen Q., Leach W. T. (2012). Computational fluid dynamics (CFD) insights into agitation stress methods in biopharmaceutical development. Int. J. Pharm. 423, 264–280. 10.1016/j.ijpharm.2011.11.044 - DOI - PubMed
    1. Baskurt O., Boynard M., Cokelet G., Connes P., Cooke B. M., Forconi S., et al. . (2009). New guidelines for hemorheological laboratory techniques. Clin. Hemorheol. Microcirc. 42, 75–97. 10.3233/CH-2009-1202 - DOI - PubMed
    1. Boas F. E., Forman L., Beutler E. (1998). Phosphatidylserine exposure and red cell viability in red cell aging and in hemolytic anemia. Proc. Natl. Acad. Sci. U.S.A. 95, 3077–3081. 10.1073/pnas.95.6.3077 - DOI - PMC - PubMed
    1. Bogdanova A., Makhro A., Wang J., Lipp P., Kaestner L. (2013). Calcium in red blood cells-a perilous balance. Int. J. Mol. Sci. 14, 9848–9872. 10.3390/ijms14059848 - DOI - PMC - PubMed
    1. Cahalan S. M., Lukacs V., Ranade S. S., Chien S., Bandell M., Patapoutian A. (2015). Piezo1 links mechanical forces to red blood cell volume. Elife 4, 1–12. 10.7554/eLife.07370 - DOI - PMC - PubMed

LinkOut - more resources