

Overexpression of let-7a increases neurotoxicity in a PC12 cell model of Alzheimer's disease via regulating autophagy
- PMID: 29042965
- PMCID: PMC5639351
- DOI: 10.3892/etm.2017.4977
Overexpression of let-7a increases neurotoxicity in a PC12 cell model of Alzheimer's disease via regulating autophagy
Abstract
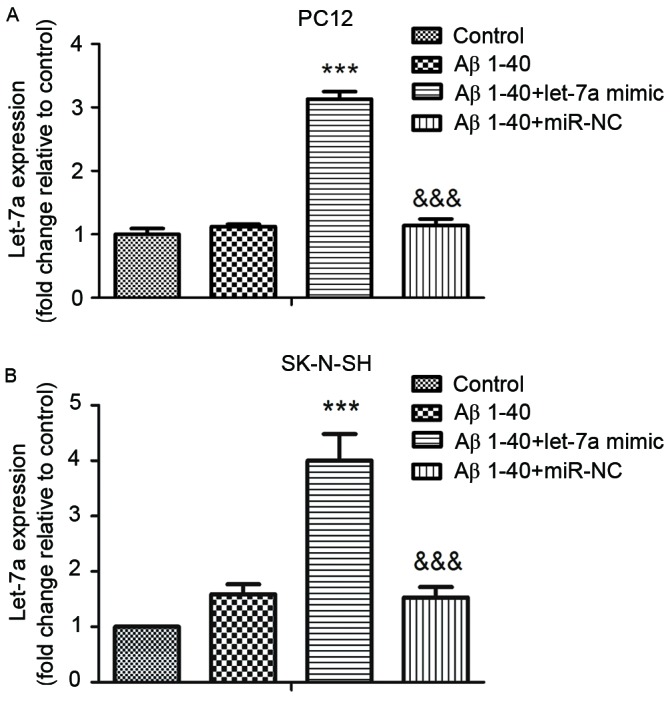
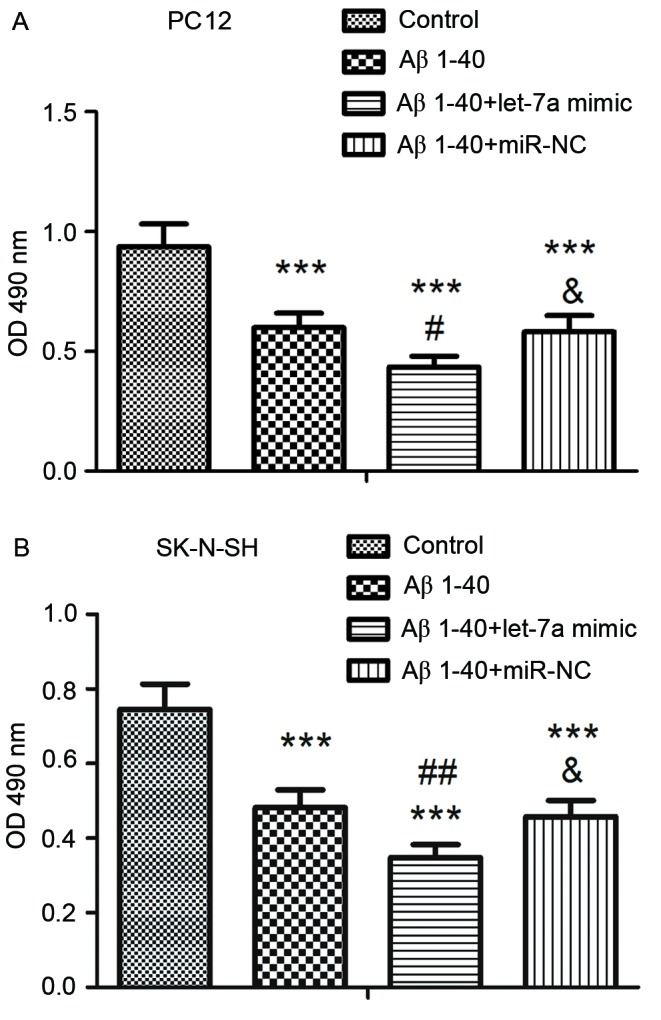
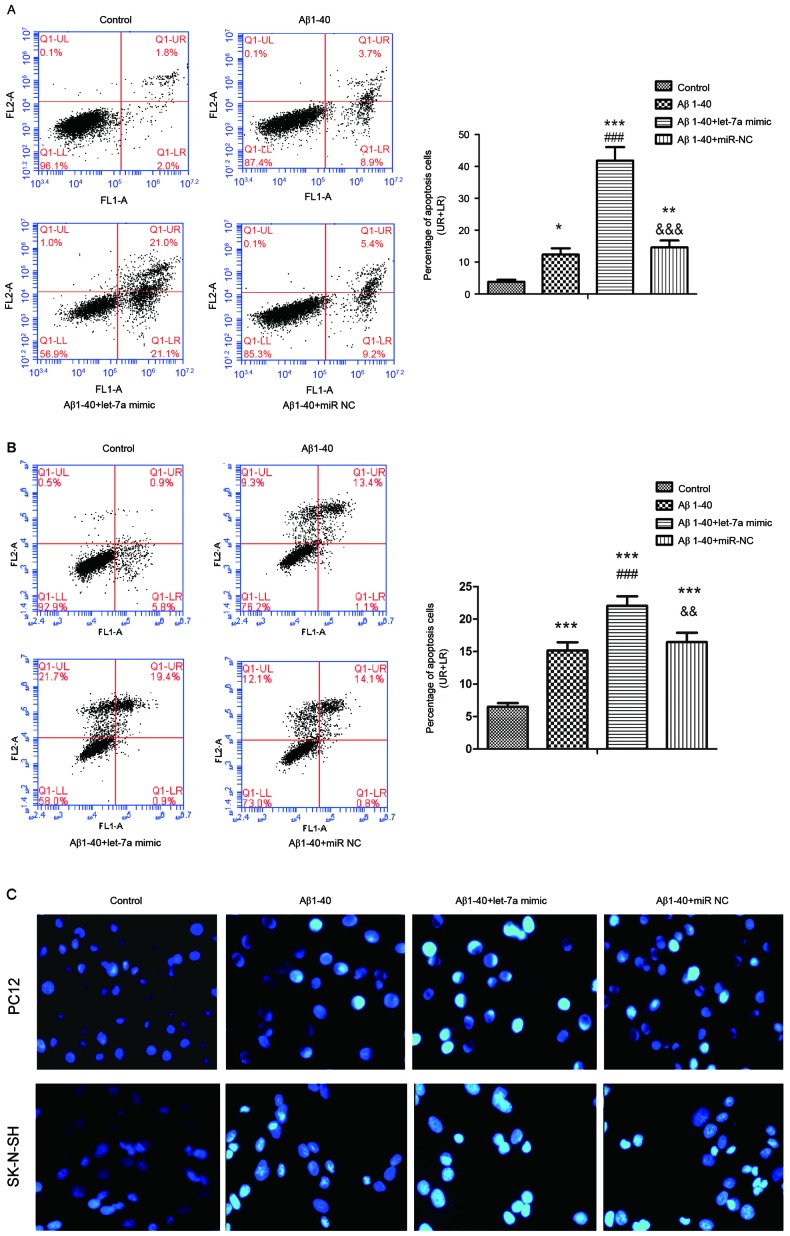
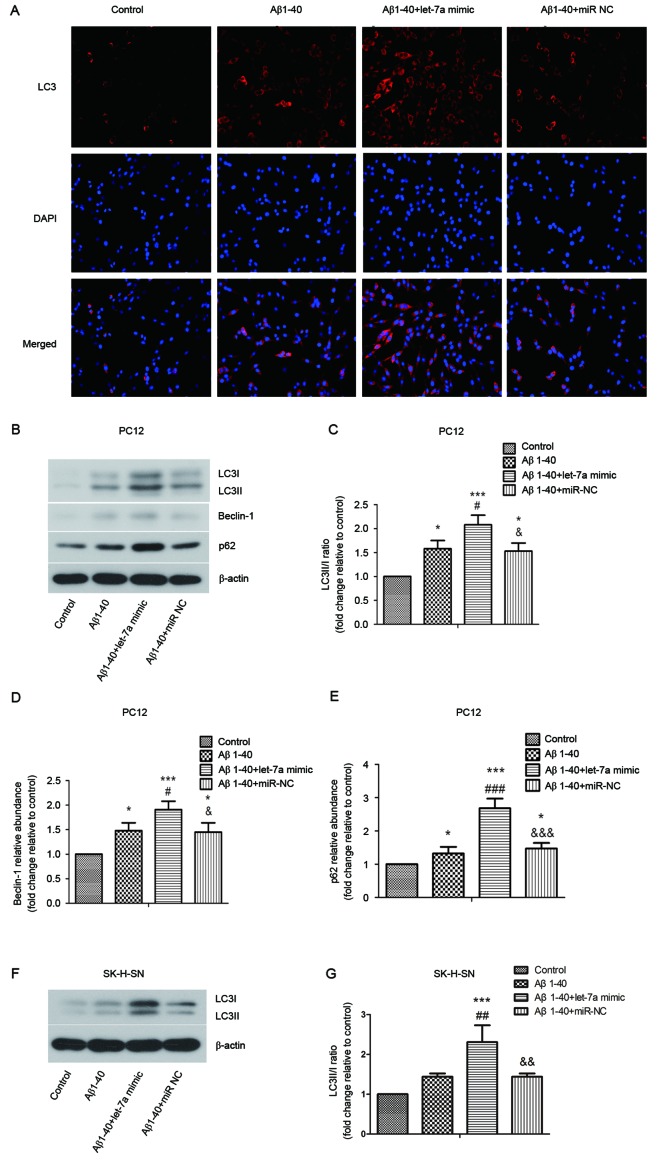
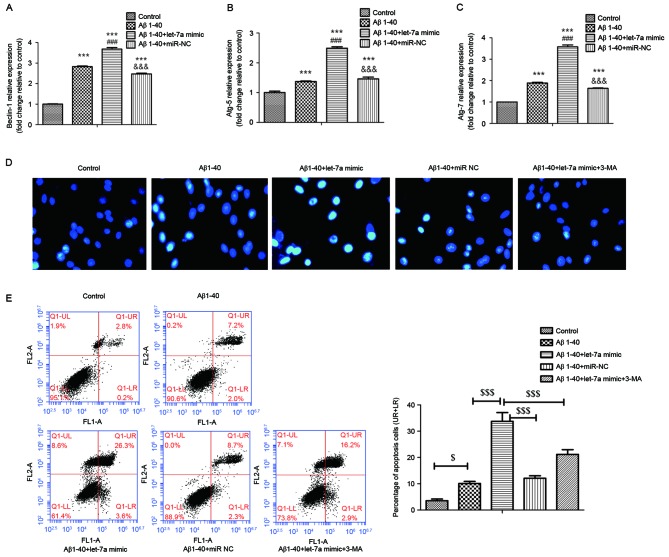
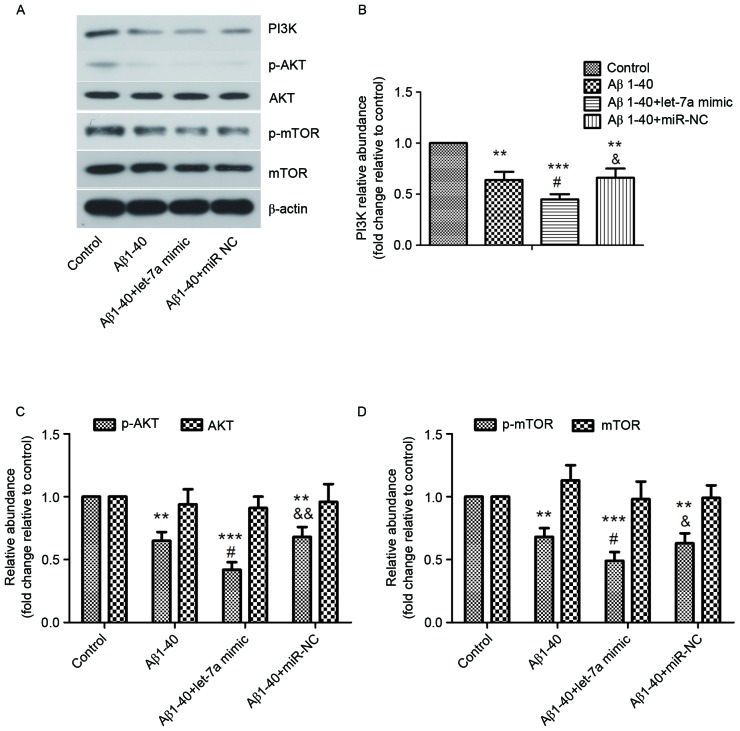
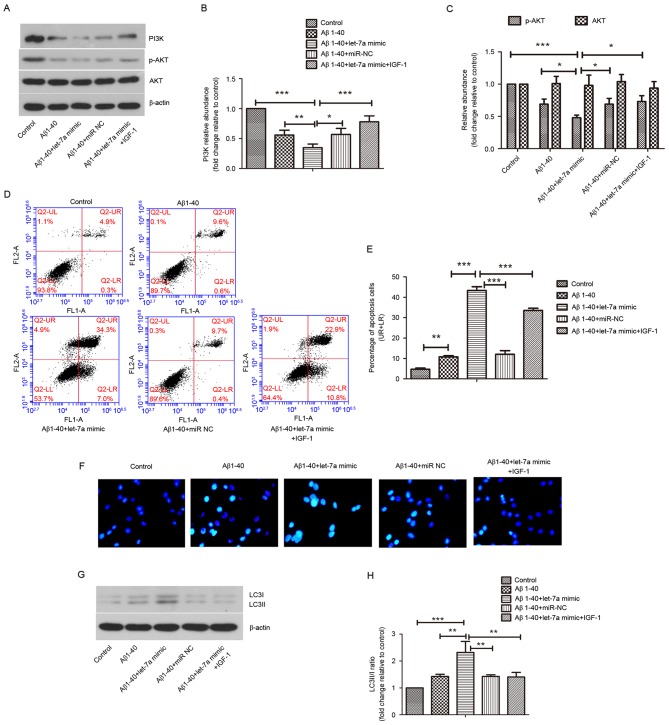
Increased deposition of β-amyloid (Aβ) protein is one of the typical characteristics of Alzheimer's disease (AD). Recent evidence has demonstrated that the microRNA let-7 family, which is highly expressed in the central nervous system, participates in the regulation of pathologic processes of AD. In the present study, the effect of let-7a overexpression on Aβ1-40-induced neurotoxicity was evaluated in PC12 and SK-N-SH cells. The results indicated that overexpression of let-7a enhanced the neurotoxicity induced by Aβ1-40 in PC12 and SK-N-SH cells. In addition, the apoptosis induced by Aβ1-40 in PC12 and SK-N-SH cells was increased by let-7a overexpression. Furthermore, Aβ1-40 treatment increased the protein levels of microtubule-associated protein 1A/1B-light chain 3 (LC3) and beclin-1 and increased the LC3 II/I ratio. The mRNA expression levels of beclin-1, autophagy protein 5 (Atg-5) and Atg-7 were also increased by Aβ1-40 treatment in PC12 cells. Let-7a overexpression further upregulated the above autophagy-related markers. Furthermore, the protein level of p62 was increased by Aβ1-40 treatment, and this was further enhanced by let-7a overexpression. Finally, the present results demonstrated that the phosphoinositide-3-kinase (PI3K)/Akt/mammalian target of rapamycin (mTOR) signaling pathway was involved in the autophagy regulation by let-7a. In conclusion, the present study demonstrates that the neurotoxicity induced by Aβ1-40 is augmented by let-7a overexpression via regulation of autophagy, and the PI3K/Akt/mTOR signaling pathway also serves a function in this process.
Keywords: Alzheimer's disease; autophagy; let-7a; phosphoinositide-3-kinase/Akt/mammalian target of rapamycin; β-amyloid 1-40.
Figures
Similar articles
-
Inhibiting Autophagy Pathway of PI3K/AKT/mTOR Promotes Apoptosis in SK-N-SH Cell Model of Alzheimer's Disease.J Healthc Eng. 2022 Feb 8;2022:6069682. doi: 10.1155/2022/6069682. eCollection 2022. J Healthc Eng. 2022. Retraction in: J Healthc Eng. 2023 Jan 19;2023:9780432. doi: 10.1155/2023/9780432. PMID: 35178230 Free PMC article. Retracted.
-
[Moxibustion at acpoints of governor vessel on regulating PI3K/Akt/mTOR signaling pathway and enhancing autophagy process in APP/PS1 double-transgenic Alzheimer's disease mice].Zhongguo Zhen Jiu. 2019 Dec 12;39(12):1313-8. doi: 10.13703/j.0255-2930.2019.12.015. Zhongguo Zhen Jiu. 2019. PMID: 31820607 Chinese.
-
Beta-asarone attenuates amyloid beta-induced autophagy via Akt/mTOR pathway in PC12 cells.Eur J Pharmacol. 2014 Oct 15;741:195-204. doi: 10.1016/j.ejphar.2014.08.006. Epub 2014 Aug 23. Eur J Pharmacol. 2014. PMID: 25160744
-
Let-7 Family as a Mediator of Exercise on Alzheimer's Disease.Cell Mol Neurobiol. 2025 May 19;45(1):43. doi: 10.1007/s10571-025-01559-9. Cell Mol Neurobiol. 2025. PMID: 40389769 Free PMC article. Review.
-
Impaired autophagy and APP processing in Alzheimer's disease: The potential role of Beclin 1 interactome.Prog Neurobiol. 2013 Jul-Aug;106-107:33-54. doi: 10.1016/j.pneurobio.2013.06.002. Epub 2013 Jul 1. Prog Neurobiol. 2013. PMID: 23827971 Review.
Cited by
-
Alterations of mRNAs and Non-coding RNAs Associated with Neuroinflammation in Alzheimer's Disease.Mol Neurobiol. 2024 Aug;61(8):5826-5840. doi: 10.1007/s12035-023-03908-5. Epub 2024 Jan 18. Mol Neurobiol. 2024. PMID: 38236345 Review.
-
Inhibiting Autophagy Pathway of PI3K/AKT/mTOR Promotes Apoptosis in SK-N-SH Cell Model of Alzheimer's Disease.J Healthc Eng. 2022 Feb 8;2022:6069682. doi: 10.1155/2022/6069682. eCollection 2022. J Healthc Eng. 2022. Retraction in: J Healthc Eng. 2023 Jan 19;2023:9780432. doi: 10.1155/2023/9780432. PMID: 35178230 Free PMC article. Retracted.
-
Epigenomics and Lipidomics Integration in Alzheimer Disease: Pathways Involved in Early Stages.Biomedicines. 2021 Dec 2;9(12):1812. doi: 10.3390/biomedicines9121812. Biomedicines. 2021. PMID: 34944628 Free PMC article.
-
Mesenchymal Stem Cells from Familial Alzheimer's Patients Express MicroRNA Differently.Int J Mol Sci. 2024 Jan 27;25(3):1580. doi: 10.3390/ijms25031580. Int J Mol Sci. 2024. PMID: 38338859 Free PMC article.
-
Cholinergic Differentiation of Human Neuroblastoma SH-SY5Y Cell Line and Its Potential Use as an In vitro Model for Alzheimer's Disease Studies.Mol Neurobiol. 2019 Nov;56(11):7355-7367. doi: 10.1007/s12035-019-1605-3. Epub 2019 Apr 29. Mol Neurobiol. 2019. PMID: 31037648
References
-
- Pamphlett R, Jew Kum S. Different populations of human locus ceruleus neurons contain heavy metals or hyperphosphorylated tau: Implications for amyloid-β and tau pathology in Alzheimer's disease. J Alzheimers Dis. 2015;45:437–447. - PubMed
LinkOut - more resources
Full Text Sources
Other Literature Sources
Miscellaneous