. 2017 Jul 19:6:1144.
doi: 10.12688/f1000research.12036.1. eCollection 2017.

CNS cell-type localization and LPS response of TLR signaling pathways

Affiliations

CNS cell-type localization and LPS response of TLR signaling pathways

Gizelle M McCarthy et al. F1000Res. .

Abstract

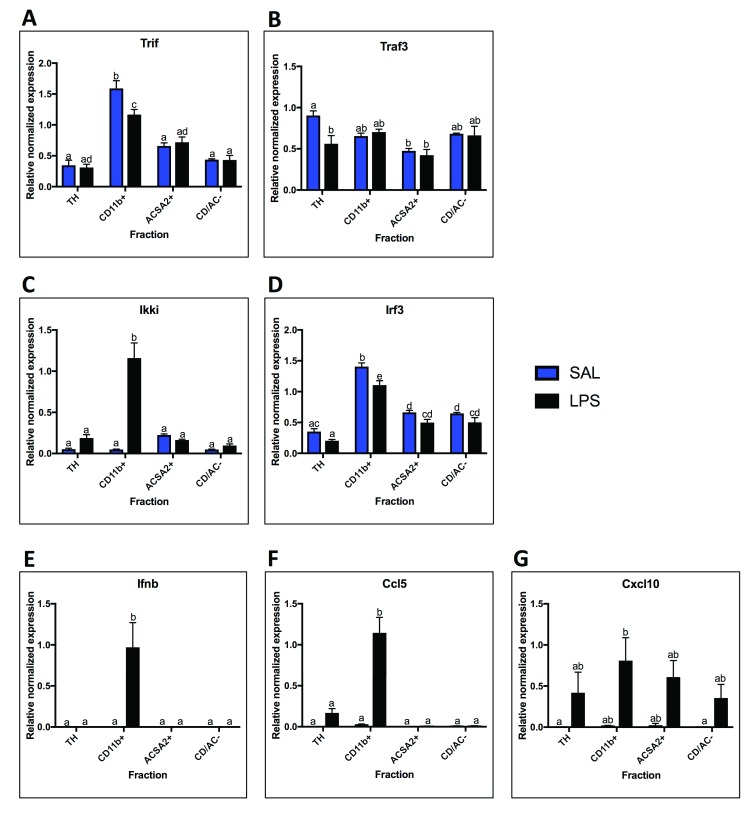
Background: Innate immune signaling in the brain has emerged as a contributor to many central nervous system (CNS) pathologies, including mood disorders, neurodegenerative disorders, neurodevelopmental disorders, and addiction. Toll-like receptors (TLRs), a key component of the innate immune response, are particularly implicated in neuroimmune dysfunction. However, most of our understanding about TLR signaling comes from the peripheral immune response, and it is becoming clear that the CNS immune response is unique. One controversial aspect of neuroimmune signaling is which CNS cell types are involved. While microglia are the CNS cell-type derived from a myeloid lineage, studies suggest that other glial cell types and even neurons express TLRs, although this idea is controversial. Furthermore, recent work suggests a discrepancy between RNA and protein expression within the CNS. Methods: To elucidate the CNS cell-type localization of TLRs and their downstream signaling molecules, we isolated microglia and astrocytes from the brain of adult mice treated with saline or the TLR4 ligand lipopolysaccharide (LPS). Glial mRNA and protein expression was compared to a cellular-admixture to determine cell-type enrichment. Results: Enrichment analysis revealed that most of the TLR pathway genes are localized in microglia and changed in microglia following immune challenge. However, expression of Tlr3 was enriched in astrocytes, where it increased in response to LPS. Furthermore, attempts to determine protein cell-type localization revealed that many antibodies are non-specific and that antibody differences are contributing to conflicting localization results. Conclusions: Together these results highlight the cell types that should be looked at when studying TLR signaling gene expression and suggest that non-antibody approaches need to be used to accurately evaluate protein expression.

Keywords: MyD88; TRIF; Toll-like receptor; astrocyte; lipopolysaccharide; microglia; neuroimmune.


Conflict of interest statement

Competing interests: No competing interests were disclosed.

Figures

Figure 1.
Figure 1.. TLR-signaling pathways.
Lipopolysaccharide (LPS) is recognized by TLR4 and its co-receptors MD2 and CD14. TLR4 signals through two different pathways, the MyD88-dependent pathway and the TRIF-dependent pathway. The MyD88-dependent pathway utilizes the adapter protein MyD88, which recruits IRAK4, IRAK1, and TRAF6. Phosphorylation of IRAK1 and ubiquitination of TRAF6 leads to activation of IKKs and NF-κB. Activated NF-κB translocates to the nucleus where it promotes transcription of pro-inflammatory cytokines. TLR2 also signals through the MyD88-dependent pathway. The TRIF-dependent pathway, utilized by TLR3 and TLR4, signals through the adapter protein TRIF. TRIF recruits TRAF6 and TRAF3. Signaling through TRAF6 leads to NF-κB activation, while signaling through TRAF3 utilizes IKKM ε to activate IRF3. Activated IRF3 translocates to the nucleus, where it leads to transcription of Type I interferons and interferon inducible genes.
Figure 2.
Figure 2.. Cell-type marker mRNA expression.
qPCR analysis of cell-type marker expression in the four fractions. A. The microglial fraction was highly enriched for the microglial marker Cd11b, and Cd11b was absent in the astrocyte and negative fraction. B. The astrocyte fraction was highly enriched for the astrocyte marker Glast, and expression of Glast was extremely low or absent in the microglial and negative fractions. C. The total homogenate (TH) had high expression of the neuronal marker Neun. Neun was absent from the microglial and astrocytes fractions and was expressed in low levels in the negative fraction. D. The endothelial cell marker Tek was highly expressed in the negative fraction and lowly expressed in the other three fractions. Tek expression decreased with LPS in the negative fraction. E. The activated microglial marker Cd68 was highly expressed in the microglial fraction, and lowly expressed in the other fractions. Cd68 expression increased with LPS in the microglial fraction. Two bars with the same letter are not statistically different; two bars with no letter in common are statistically different (two-way ANOVA with Tukey’s test for multiple comparisons, p<0.05). SAL, saline; LPS, liposaccharide.
Figure 3.
Figure 3.. Toll-like receptor (TLR) mRNA expression.
Fraction localization and LPS expression changes for TLRs and co-receptors measured by qPCR. A. Tlr2 is expressed primarily in the microglial fraction and expression increases with LPS. B. Tlr3 is enriched in both microglia and astrocytes compared to the total homogenate (TH), with higher expression in astrocytes. Astrocyte Tlr3 expression increased with LPS. C. Tlr4 expression is highly microglial and decreases following LPS. D. Cd14 is highly enriched in microglia and increases with LPS. Two bars with the same letter are not statistically different; two bars with no letter in common are statistically different (two-way ANOVA with Tukey’s test for multiple comparisons, p<0.05). SAL, saline; LPS, liposaccharide.
Figure 4.
Figure 4.. MyD88-dependent pathway mRNA expression.
Fraction localization and LPS expression changes for components and outputs of the MyD88-Dependent Pathway, measured by qPCR. A. MyD88 is highest enriched in the microglial fraction and increases with LPS. B. Irak1 is highest enriched in the microglial fraction, but present in moderate levels (expression is 50% or more than that of microglia) in all other fractions. Irak1 expression increases in microglia with LPS. C. Irak4 expression is highly enriched in microglia under basal conditions, and decreases in microglia after LPS. D. With saline, Traf6 is enriched in the microglial fraction, but present in moderate levels in all other fractions. With LPS, Traf6 expression increases in the astrocyte fraction and the negative fraction. E. Ikkb expression was highest in microglia, but expressed in moderate levels in all other fractions. No significant expression changes were seen after LPS treatment. F. Expression of Il1b is only detected in microglia and increases with LPS. G. Expression of Il6 is only detected in microglia with saline, but is detected in all other fractions after LPS. H. Tnf was only detected in the microglial fraction and increased following LPS. Two bars with the same letter are not statistically different; two bars with no letter in common are statistically different (two-way ANOVA with Tukey’s test for multiple comparisons, p<0.05). SAL, saline; LPS, liposaccharide; TH, total homogenate.
Figure 5.
Figure 5.. TRIF-dependent pathway mRNA expression.
Fraction mRNA localization for components and outputs of the TRIF-Dependent Pathway in saline and LPS treated animals. A. Trif was highest expressed in the microglial fraction with saline and decreased with LPS. B. Traf3 expression was relatively even across the fractions, with only significant difference being between the total homogenate (TH) and the astrocyte fraction. There were no significant changes with LPS. C. Ikki expression was not significantly enriched in any fraction with saline, but was highest in astrocytes. With LPS, expression increased in the microglial fraction. D. Irf3 expression was highest in the microglial fraction, but was also significantly enriched over the TH in the astrocyte fraction and negative fraction. E. Ifnb was not detected in any fractions with saline, but was expressed in microglia with LPS. F. Expression of Ccl5 was expressed in low amounts in microglia with saline, but was detected in the TH with LPS and increased in microglia. G. Cxcl10 was expressed in low levels in the microglial and astrocyte fractions with saline, but was detected in all fractions with LPS, although none of the changes were significant. Two bars with the same letter are not statistically different; two bars with no letter in common are statistically different (two-way ANOVA with Tukey’s test for multiple comparisons, p<0.05). SAL, saline; LPS, liposaccharide.
Figure 6.
Figure 6.. Antibody validation.
Antibody tests in negative controls (knockout tissue and HEK-293 cells). Each antibody was run once with just knockout tissue if available, and once with knockout tissue and HEK 293T cell lysates. A. The TLR2 antibody produces a signal in HEK-293 cells and TLR knockout tissue (KO), neither of which should express TLR2. B. The TLR3 antibody only produced signal in the WT tissue. C and D. Both TLR4 antibodies produced signals in the HEK-293 cells and the TLR4 knockout tissue, neither of which should express TLR4. E. The IL-1β antibody produced a signal in the HEK-293 cells, which should not express IL-1β. FJ. All five MyD88 antibodies produced a signal in the MyD88 knockout tissue.
Figure 7.
Figure 7.. Protein expression in fractions.
Fraction protein expression in representative western blot images. Number of experiments for each antibody are indicated in parenthesis. A. Cell-type specific antibodies verify cell-type enrichment in the fractions. NEUN, a neuronal marker, is expressed in the control sample and the total homogenate (TH) (n=3). GFAP, an astrocytic marker, is expressed in low levels in the TH and higher levels in astrocytes (n=2). IBA1, a microglial maker, is expressed in microglia (n=3). B. Expression for TLR2 appears to be in all fractions except microglia (n=3), while TLR3 is only detected in the TH (n=2), and TLR4 (n=2) and IL-1β (n=3) are detected in all fractions C. Blotting with three different MyD88 antibodies produced different results (n=3 for each). Sc-11356 suggested MyD88 is only expressed in the total homogenate, while ab2064 and ab2068 show expression in all fractions, with highest expression in microglia and the negative fraction. D. IRAK1 (n=2) shows expression in all fractions except microglia and IRAK4 (n=3) shows expression in all fractions, but highest expression in the TH. E. Two different TRAF6 antibodies produce multiple bands and different results. Based on predicted molecular weight, both antibodies show highest expression in the TH and lowest expression in microglia (n=2 for each). F. IKKβ showed expression in the TH and light expression in the negative fraction (n=2). G. IRF3 was detected in all fractions, but highest in the negative fraction. H. Two antibodies were used to evaluate IKK ε. Sc-5693 gave signal only in the TH while Sc-376114 produced signal in all cell types (n=3 for each). Sal, saline; LPS, liposaccharide; CD, CD11b+; AC, ACSA2+.
Figure 8.
Figure 8.. Summary of mRNA enrichment and LPS response.
Microglial and astrocyte cell-type enrichment (compared to TH) is shown for TLR pathway genes in saline and LPS treated mice. The font size of each gene indicates fold-enrichment, with larger sizes meaning larger fold-enrichment. Colors on the LPS side denote whether that gene changed in that cell type with LPS treatment. Red indicates increased gene expression while blue denotes decreased gene expression. Figure created using http://servier.com/Powerpoint-image-bank.

Similar articles

Cited by

References

    1. Kawai T, Akira S: Signaling to NF-kappaB by Toll-like receptors. Trends Mol Med. 2007;13(11):460–469. 10.1016/j.molmed.2007.09.002 - DOI - PubMed
    1. Takeda K, Akira S: TLR signaling pathways. Semin Immunol. 2004;16(1):3–9. 10.1016/j.smim.2003.10.003 - DOI - PubMed
    1. Takeda K, Akira S: Toll-like receptors in innate immunity. Int Immunol. 2005;17(1):1–14. 10.1093/intimm/dxh186 - DOI - PubMed
    1. García Bueno B, Caso JR, Madrigal JL, et al. : Innate immune receptor Toll-like receptor 4 signalling in neuropsychiatric diseases. Neurosci Biobehav Rev. 2016;64:134–147. 10.1016/j.neubiorev.2016.02.013 - DOI - PubMed
    1. Gasiorowski K, Brokos B, Echeverria V, et al. : RAGE-TLR Crosstalk Sustains Chronic Inflammation in Neurodegeneration. Mol Neurobiol. 2017;12:593. 10.1007/s12035-017-0419-4 - DOI - PubMed

LinkOut - more resources