Review
. 2018:245:271-312.
doi: 10.1007/164_2017_62.

The Molecular Physiopathogenesis of Islet Amyloidosis

Affiliations
Review

The Molecular Physiopathogenesis of Islet Amyloidosis

Diti Chatterjee Bhowmick et al. Handb Exp Pharmacol. 2018.

Abstract

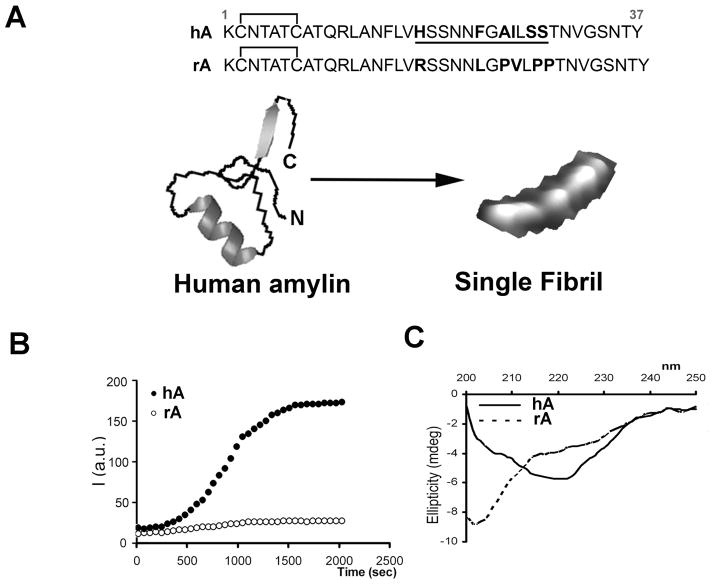
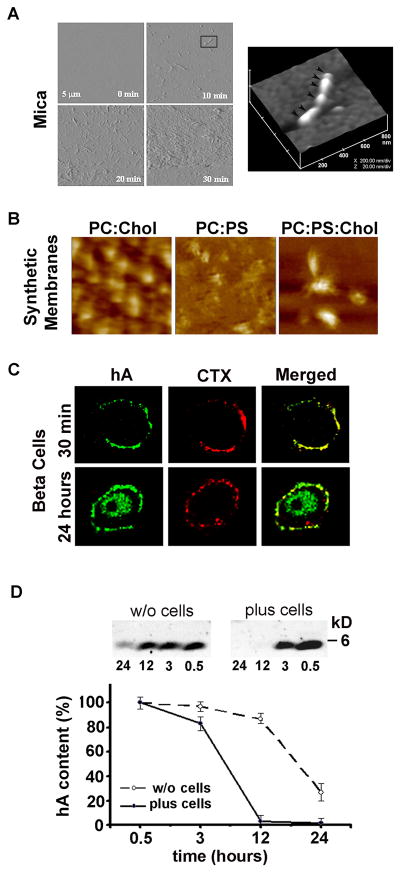
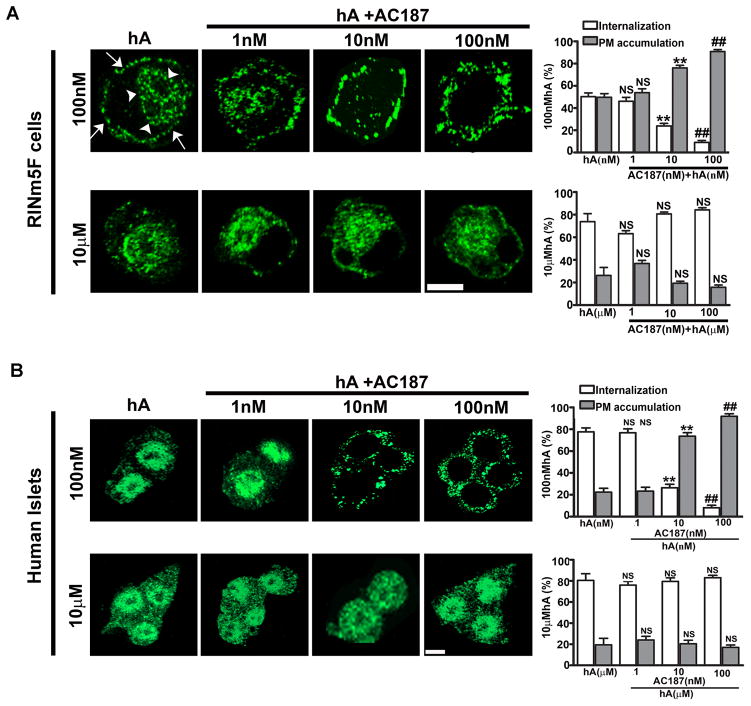
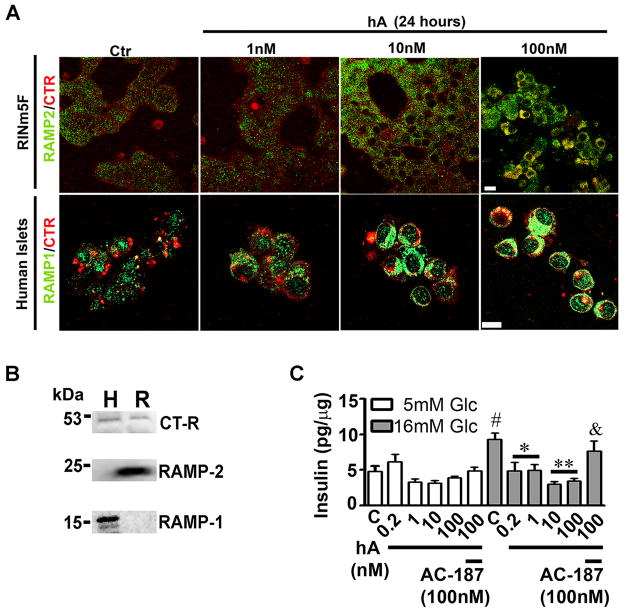
Human islet amyloid polypeptide or amylin (hA) is a 37-amino acid peptide hormone produced and co-secreted with insulin by pancreatic β-cells. Under physiological conditions, hA regulates a broad range of biological processes including insulin release and slowing of gastric emptying, thereby maintaining glucose homeostasis. However, under the pathological conditions associated with type 2 diabetes mellitus (T2DM), hA undergoes a conformational transition from soluble random coil monomers to alpha-helical oligomers and insoluble β-sheet amyloid fibrils or amyloid plaques. There is a positive correlation between hA oligomerization/aggregation, hA toxicity, and diabetes progression. Because the homeostatic balance between hA synthesis, release, and uptake is lost in diabetics and hA aggregation is a hallmark of T2DM, this chapter focuses on the biophysical and cell biology studies investigating molecular mechanisms of hA uptake, trafficking, and degradation in pancreatic cells and its relevance to h's toxicity. We will also discuss the regulatory role of endocytosis and proteolytic pathways in clearance of toxic hA species. Finally, we will discuss potential pharmacological approaches for specific targeting of hA trafficking pathways and toxicity in islet β-cells as potential new avenues toward treatments of T2DM patients.

Keywords: Aggregation; Endocytosis; Human amylin; Islet amyloidosis; Proteasome; Proteotoxicity; Type 2 diabetes mellitus.


Figures

Figure 1
Figure 1. Dynamics of hA aggregation and misfolding in solution
(A) Primary structures of mature forms of hA and rA are shown. Species-specific amino-acids within the amyloidoigenic region (underlined) of the two polypeptide chains are bolded for clarity. (B) Kinetics and extent of aggregation of human and rA in buffer as a function of time. Thioflavin-T fluorescent assay reveals fibrilogenesis of 20μM hA in solution (closed circles) and lack of aggregation of non-amyloidogenic rA (20μM; open circles). (C) Far-UV CD spectra of hA (solid line) and rA (dashed line) taken after 20 min. in PBS solution in the presence of 2% HFIP. Note the absorption minimum at ~220nm for hA but not rA, typical for peptides and proteins adopting β-sheet conformation.
Figure 2
Figure 2. High resolution microscopic analysis of hA aggregation on solid surfaces and membranes
(A) Tapping mode time-lapse AFM was used to capture structural intermediates, oligomers and fibrils, during hA aggregation on mica. Note a time-dependent structural transition of hA from small fibrils (early stage of hA aggregation, 10 min) to amyloid-like dense deposits (late stage of hA aggregation, 20–30 min). All micrographs on the left panel are 5×5 μm. 3-D AFM image of a single full-grown fibril on mica (inset, 10 min) reveals linear alignment of several hA oligomers and their bi-directional extension into a fibril (depicted by arrowheads). Micrograph is 800 × 800 nm scale. (B) AFM analysis of membrane-directed hA self-assembly. High-resolution 2D AFM analysis revealed distinct deposition pattern and morphology of hA aggregates on synthetic lipid membranes. Note the clustering of hA aggregates on cholesterol-containing membranes, PC:Chol (3.2:0.8 mol:mol) and PC:PS:Chol (2.3:1:0.8 mol:mol:mol). In contrast, hA aggregates were less compact and homogenously distributed across cholesterol-free membranes-PC:PS (2.8:1.2 mol:mol). In contrast to mica (Figure 2A), no fibrils were detected on either membranes (Figure 2B). Micrographs are 2×2 μm. (C) Confocal microscopy analysis of binding and clustering of hA on the β-cell PM. Rinm5F cells were exposed to hA (20 μM) for 30 min or 24h. Cells were then washed and fixed prior to immunochemical analysis. hA specific antibody (green) was used to analyze peptide’s accumulation on the plasma membrane and intracellularly. Fluorescently-labeled lipid-raft marker cholera toxin (CTX, red) was added to cell during last 30 min. of hA incubations to localize lipid rafts micro domains on the cell plasma membrane. Note hA and CTX co-clustering on the cell plasma membrane (yellow puncta) and time-dependent hA internalization in a single β-cell indicating hA extracellular clearance. (D) Clearance of extracellular hA by pancreatic β-cell revealed by western blot. hA (20 μM) was added to Rinm5F cells or cell-free buffer and the changes in hA content in solution were analyzed over 24 by western blot approach. hA (4 kDa) was detected using amylin-specific antibody. Note the accelerated clearance of hA from solution containing cells. The slow decrease in hA content in cell-free solution is due to delayed hA aggregation and precipitation from solution. Due to its toxicity, peptide solvent HFIP was omitted from these studies.
Figure 3
Figure 3. High affinity AM-R-dependent and low affinity AM-R-independent hA transport operate in pancreatic cells
Rin-m5F (A) and human islet cells (B) were incubated with 100 nM or 10 μM hA either in the presence or absence of the AM-R antagonist, AC-187 (1–100 nM) for 24 hours. hA accumulation on the cell PM and subsequent internalization was concurrently assessed with quantitative confocal microscopy analysis. (A) Confocal microscopy analysis of hA uptake in Rin-m5F cells is shown. When low concentration of hA (100 nM) was used, hA monomer internalization was significantly inhibited with increasing concentrations of AC-187 (top panel, graph). A corresponding increase in hA accumulation on cell PM was observed. In contrast to this high affinity uptake process, hA monomer/oligomer uptake at high (10 μM) was not affected with increasing concentrations of AC-187 (bottom panel, graph). (B) Confocal microscopy analysis of hA uptake in cultured human islet cells is depicted. Note a dose-dependent inhibition of hA uptake by AC-187 at lower (100 nM) but not higher (10 μM) hA concentrations, revealing high- and low-affinity hA transport mechanism in β-cells, respectively. Significance established at p<0.05 by ANOVA followed by Dunnett-Square test. Bar 5μm.
Figure 4
Figure 4. hA regulates trafficking of AM-R and insulin release in β-cells
(A) Immunoconfocal microscopy analysis revealed expression and location of RAMP2 (green)/CT-R (red) in RINm5F β-cells (top panel) and RAMP1 (green)/CT-R (red) in human islet cells (bottom panel). Note increased recycling on AM-R components, CT-R and RAMPs, to the plasma membranes (yellow puncta) following exposure to increasing hA concentration (1–100 nM). Bar 10 μm. (B) Western blot analysis shows expression of CT-R and two RAMPs isoforms RAMP1 in human islets (H) and RAMP2 in RINm5F β-cells (R). (C) The inhibitory effect of hA on glucose-evoked insulin release from human islets was reversed by addition of AM-R antagonist, AC-187, indicating an AM-R mediated process. Intact human islets were exposed to normal (5mM) or high (16mM) glucose (Glc) concentrations in the presence or absence of hA (0.2–100 nM) and/or AC-187 (100 nM) for 30 minutes, following which insulin content in the samples (release) was analyzed by ELISA. Data was normalized to total protein content in samples. #p<0.05, 5mM Glc vs. 16mM Glc, n=6, **p<0.01, control vs. hA 0.2–100nM; and &p<0.05, hA 100nM vs. hA 100nM +AC-187 100nM, n=6. Significance established by ANOVA followed by Dunnett-Square test.
Figure 5
Figure 5. Fluid phase uptake of hA monomers and oligomers by pancreatic cells
(A) Initial entry (1h) of hA monomers (top panel) and oligomers (bottom panel) is through dynamin-independent macropinocytosis in RINm5F cells. Cells were treated with various endocytotic inhibitors EIPA, CytD, Wort or Dyn for 1 hour followed by hA (green) (10 μM) for an additional 1 hour at 37°C. Dextran (red) at 40μg/ml was finally added for 30 minutes. Confocal microscopy revealed a significant reduction in internalization and an increase in PM accumulation of hA monomers (green) and dextran (red) in the presence EIPA, CytD or Wort but not Dyn when compared to controls. (A, top panel and graph). Similar internalization pathway was also demonstrated for hA oligomers and dextran within the first hour (A, bottom panel and graph). (B) Late entry (24h) of hA oligomers but not monomers is through dynamin-independent macropinocytosis in RINm5F cells. Note no significant change in the cellular distributions of hA monomers (top panel, graph) in the presence of EIPA, CytD, Wort or DN dyn1K44A when compared to controls. On the contrary, dextran internalization was completely blocked with these macropinocytotic inhibitors but not with DN dyn1K44A (A, top panel and graph). Marked inhibition in internalization of hA oligomers and dextran was observed following treatments with EIPA, CytD or Wort but not with DN dyn1K44A (A, bottom panel and graph). Bar 10μm. **p<0.01, hA vs. hA plus inhibitors, ##p<0.01, dextran vs. dextran plus inhibitors, NS p>0.05, n=9. Significance established by ANOVA followed by Dunnett-Square test.
Figure 6
Figure 6. Clathrin-dependent and independent endocytotic pathways regulate hA internalization in pancreatic cells
(A) hA monomer internalization is independent of clathrin and dynamin at 1 hour in RINm5F cells. Cells were treated with dynamin inhibitor dynasore (Dyn) or clathrin inhibitor chlorpromazine (Chl) for 1 hour followed by hA (green) (10 μM) for an additional 1 hour at 37°C. In parallel, cells were incubated with hA (10 μM) for 1 hour at 4°C. CTX (red) (20 μg/ml) and Trf (blue) (50 μg/ml) were finally added for 30 minutes at 37°C or 4°C. Whole cell analysis (graph) demonstrated no noticeable difference in cellular distributions of monomers at 1 hour when treated with Dyn or Chl. However, lowering temperature to 4°C blocked monomer internalization as well as CTX and Trf (A). Arrowheads and arrows denote cells with internalized and PM associated hA monomers, respectively. (B) Late phase of hA monomer internalization requires clathrin in RINm5F cells. Cells were first transfected with wild type (wt-AP180) or dominant negative clathrin adaptor AP180 protein, containing clathrin binding domain at its C-terminus (DN AP180CFLAG) for 16–18 hours. Following transfections, cells were incubated with 10 μM hA (green) for an additional 24 hours at 37°C. Cells were also treated with hA at the indicated concentrations for 24 hours at 4°C. CTX (red) (20 μg/ml) and Trf (blue) (50 μg/ml) were finally added for 30 minutes at 37°C or 4°C after incubating the cells with hA. Confocal microcopy and whole cell analysis revealed a significant reduction in internalization and an increase in PM accumulation of hA when transfected with DN AP180CFLAG or when incubated at 4°C. In contrast, there was no change in their cellular distributions in wt-AP180 expressed cells and controls (B). Transferrin but cholera toxin internalization was blocked in cells transfected with DN AP180CFLAG construct (B). Internalization of all three cargoes were effectively blocked at 4°C (B). **p<0.01, hA vs. hA plus inhibitors, ##p<0.01, hA vs. hA/4°C, ##p<0.01, CTX vs. CTX/4°C, and Trf vs. Trf/wt-AP180, NS p>0.05, n=9. Significance established by ANOVA followed by Dunnett-Square test. Bar 10μm.
Figure 7
Figure 7. hA accumulates in cytosol and nucleus of pancreatic cells
Cells were treated with hA for 24 hours and intracellular redistribution of hA in intact cells and cell fractions determined. (A) Analysis of hA accumulation in cytosolic and nuclear fractions revealed by ELISA in RIN-m5F cells. (B) Redistribution of internalized hA between the nucleus and cytosol examined by ELISA. Note accumulation of hA in the nucleus and to a lesser extent in cytosol following its uptake in RIN-m5F cells (A) and human islets (B). Significance established at * p<0.05,** p<0.01 and *** p<0.001, n=6, Student’s t-test. (C) Confocal microscopy analysis of hA localization in pancreatic cells. Nuclear marker DRAQ5 colocalizes with hA in RIN-m5F (top panel) and human islets (bottom panel) as indicated by arrows in merged images. Bars, 10μm.
Figure 8
Figure 8. Dynamics of intracellular accumulation and aggregation of hA
(A) Time course and extent of aggregation of hA (30μM) at RT, prepared by two distinct methods is shown. Note immediate increase in ThT fluorescence, reflecting hA fibrilization in preaggregated sample (circles). In contrast, freshly prepared equimolar samples lacking aggregates (black diamonds) show delayed hA aggregation (lag phase > 1 hour). (B) Characterization of hA oligomeric state by native PAGE. Freshly prepared hA was incubated at +4°C, room temperature (RT) or in the presence of amyloid-inhibitor methylene blue (MB, 500 μM) for 4 hours. Arrow denotes monomeric hA, whereas arrowhead denotes oligomers. (C) Dynamics of hA internalization in RIN-m5F cells examined by ELISA. (D) Confocal microscopy was used to assessed kinetics and location of hA in these cells. (E) MTT cellular stress assay was used to evaluate toxicity of hA in the absence or presence of oligomeric inhibitor methylene blue (MB). (F) Effect of protein stress inducer Lactacystin (Lac, 10μM) on mitochondrial activity in the presence or absence of MB is shown. Significance was established at * p<0.05, ** p<0.01 and *** p<0.001, n=6, ANOVA followed by Tukey’s post hoc comparison test.
Figure 9
Figure 9. Confocal microscopy analysis of hA trafficking in pancreatic cells
hA was incubated with cells for 24 hours, cells fixed and its trafficking and association with cellular organelles, cytosolic and nuclear proteins was analyzed by indirect immunocytochemistry. Association of hA or lack of it with lysosomes (LAMP1), mitochondria (Mitotracker-MITO), Golgi (GM130), heat shock protein (HSP70) and ubiquitin (PD41) is shown. Representative cells in which hA accumulates in LAMP2 positive perinuclear compartments and interacts with ubiquitin in cytosol and nucleus are indicated by arrows.
Figure 10
Figure 10. hA interacts with the catalytic and regulatory components of the 26S proteasome complex
hA was incubated with in RIN-m5F cells and human islets for 24 hours and its interaction with 20s proteasome was assessed by confocal microscopy and immunoprecipitation. (A) hA colocalizes (arrows) with 20S proteasome in the nucleus of RIN-m5F cells (top panel) and human islets (bottom panel) as confirmed by indirect immunocytochemistry. Bars,10 μm. (B–C) hA interacts with the catalytic and lid components of 26S proteasome complex in RINm5F cells. hA was pulled down using hA specific antibody from the nuclear fraction (B) or whole cell extract (C) of hA -treated RIN-m5F cells and immunoblotted with antibodies against 20Sα4 subunit (B) and 19SRpn8 (C) subunits of the 26S proteasome complex. (D) hA interacts with 20Sβ1 in vitro to form a heterocomplex. Synthetic hA and purified 20S complex were co-incubated and immunoprecipitated using anti- hA antibody as bait. Anti-20Sβ1 antibody was used to confirm pull down of hA/20S immunocomplex. Significance was established at * p<0.05,** p<0.01 n=3, ANOVA followed by Tukey’s post hoc comparison test (B–D, histograms).
Figure 11
Figure 11. Inhibition of proteasome proteolytic function accelerates nuclear accumulation and toxicity of hA in pancreatic cells
(A–B) hA was incubated with cells in the presence or absence of lactacystin for 24 hours. The extent of hA accumulation in the presence and absence of lactacystin (1uM) or pepstatin A (1μM) in (A) nucleus and (B) cytosol is revealed by ELISA. Significance was established at * p<0.05,** p<0.01 and *** p<0.001, n=3–6, ANOVA followed by Tukey’s post hoc comparison test. (C–D) Analysis of hA cytotoxicity in response to proteasomal inhibition. Dose dependent effect of lactacystin (1–10μM) on hA toxicity was analyzed by (C) MTT stress assay and (D) PARP/Caspase 3 cleavage assay. Significance was established at * p<0.05, n=3–6, ANOVA followed by Tukey’s post hoc test, hA vs Lac treatments. (E) A schematic representation of endocytotic-regulated hA internalization followed by proteasome-mediated degradation and detoxicification of hA in pancreatic cells is depicted. Conversely, inhibition of hA internalization and proteasome functions can lead to excessive accumulation of hA on the plasma membrane and intracellularly leading to its aggregation and toxicity.

Similar articles

Cited by

References

    1. Abedini A, Raleigh DP. The role of His-18 in amyloid formation by human islet amyloid polypeptide. Biochemistry. 2005;44(49):16284–16291. doi: 10.1021/bi051432v. - DOI - PubMed
    1. Abedini A, Schmidt AM. Mechanisms of islet amyloidosis toxicity in type 2 diabetes. FEBS Lett. 2013;587(8):1119–1127. doi: 10.1016/j.febslet.2013.01.017. - DOI - PMC - PubMed
    1. Amyere M, Payrastre B, Krause U, Van Der Smissen P, Veithen A, Courtoy PJ. Constitutive macropinocytosis in oncogene-transformed fibroblasts depends on sequential permanent activation of phosphoinositide 3-kinase and phospholipase C. Mol Biol Cell. 2000;11(10):3453–3467. - PMC - PubMed
    1. Ancsin JB. Amyloidogenesis: historical and modern observations point to heparan sulfate proteoglycans as a major culprit. Amyloid. 2003;10(2):67–79. - PubMed
    1. Araki N, Johnson MT, Swanson JA. A role for phosphoinositide 3-kinase in the completion of macropinocytosis and phagocytosis by macrophages. J Cell Biol. 1996;135(5):1249–1260. - PMC - PubMed

Publication types

MeSH terms

Substances

LinkOut - more resources