

Development of Adenosine Deaminase-Specific IgY Antibodies: Diagnostic and Inhibitory Application
- PMID: 29043661
- PMCID: PMC5889419
- DOI: 10.1007/s12010-017-2626-x
Development of Adenosine Deaminase-Specific IgY Antibodies: Diagnostic and Inhibitory Application
Abstract
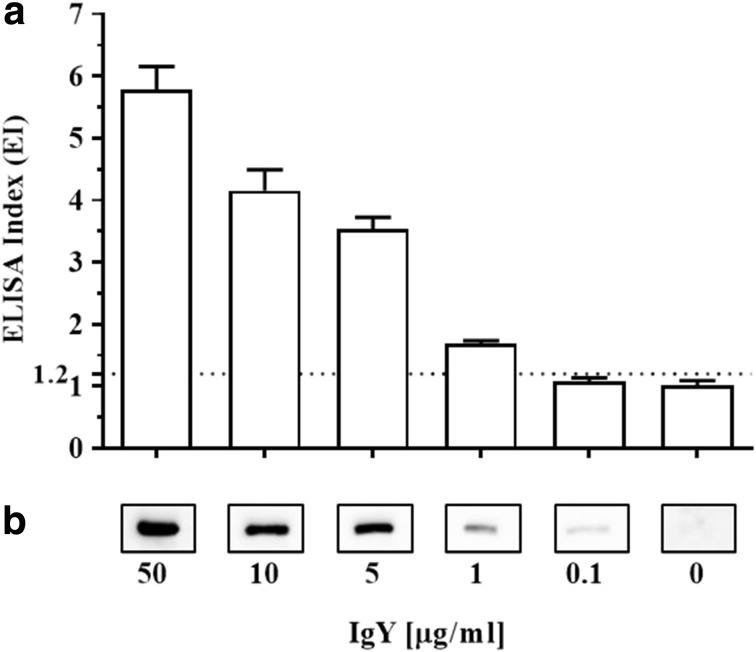
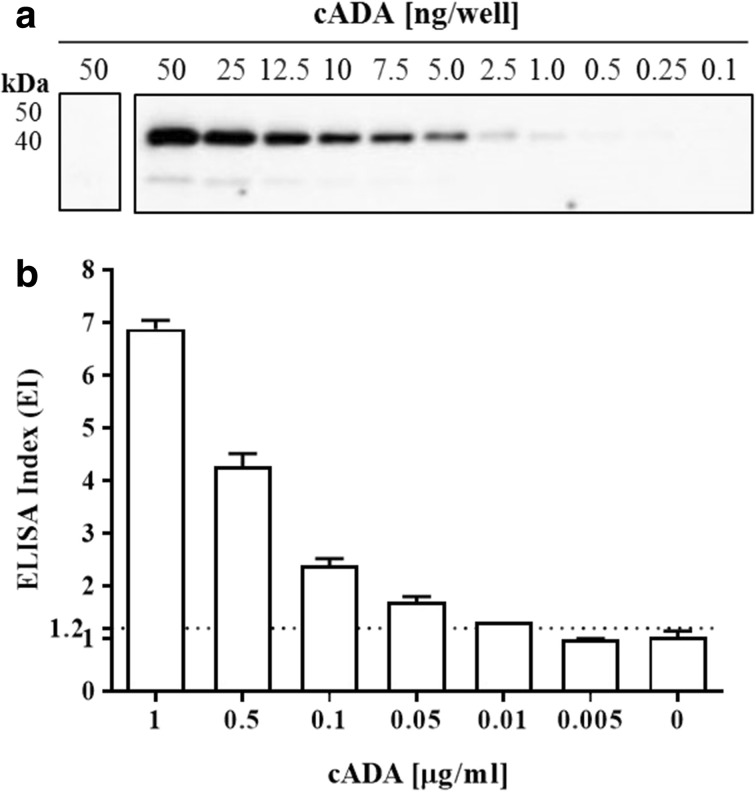
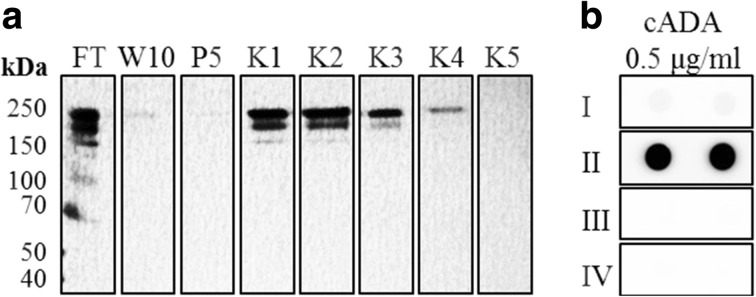
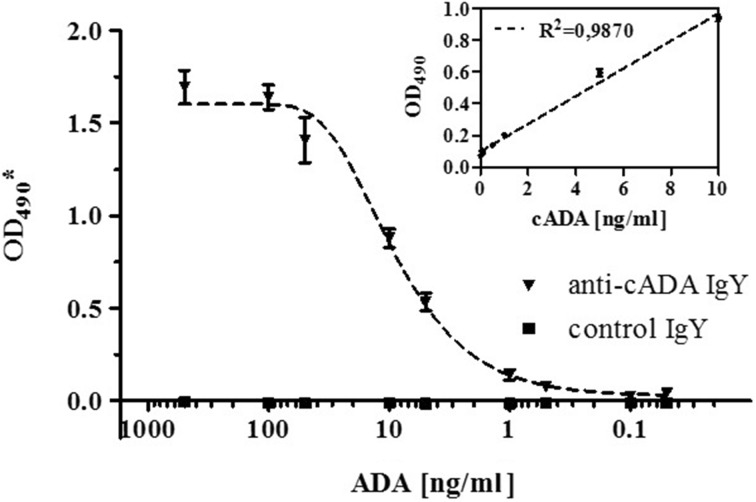
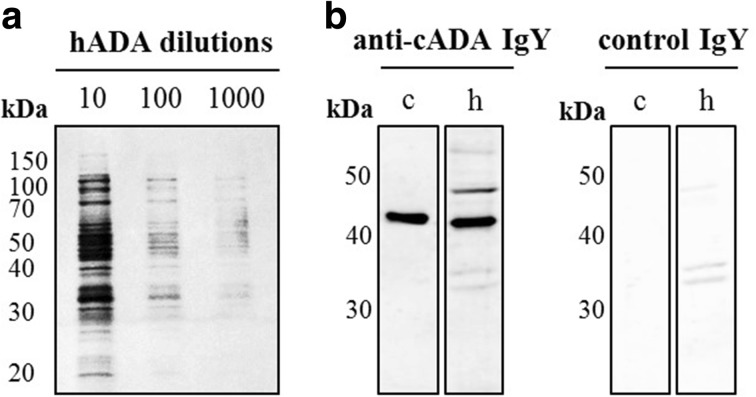
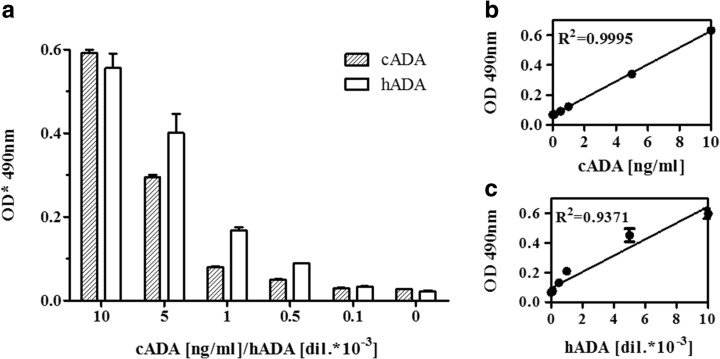
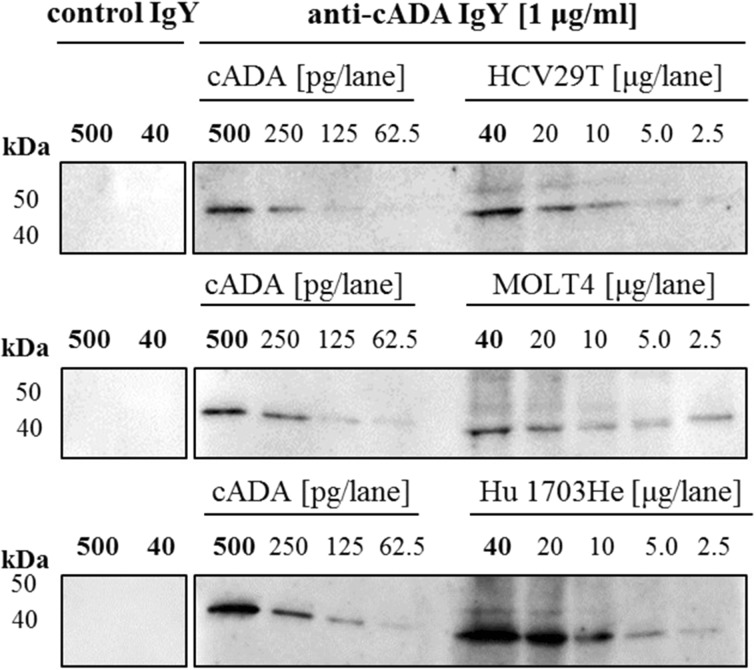
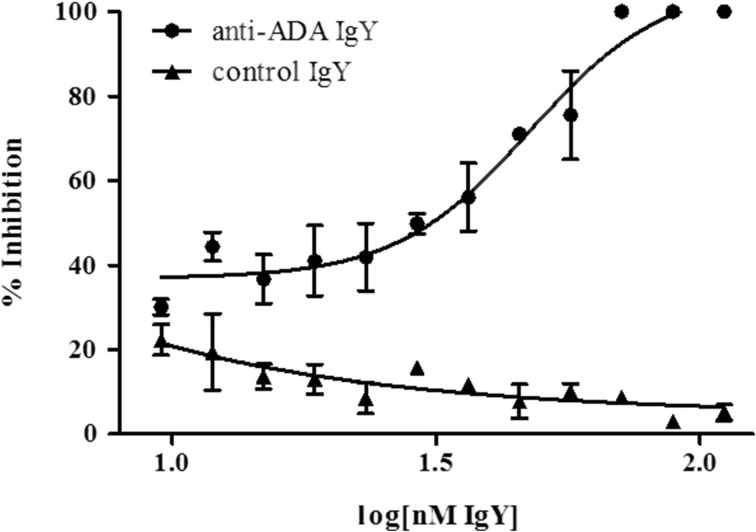
Adenosine deaminase (ADA) is currently used as a diagnostic marker for tuberculous pleuritis. Although ADA has been suggested as a potential marker for several types of cancer, the importance of each of ADA isoforms as well as their levels and enzymatic activities in tumors need to be further investigated. Herein we developed avian immunoglobulin Y highly specific to human ADA via hens immunization with calf adenosine deaminase. The obtained antibodies were used for the development of a sensitive double-egg yolk immunoglobulin (IgY) sandwich ELISA assay with an ADA detection limit of 0.5 ng/ml and a linearity range of up to 10 ng/ml. Specific, affinity-purified IgYs were able to recognize human recombinant ADA and ADA present in human cancer cell lines. In addition, antigen-specific IgY antibodies were able to inhibit catalytic activity of calf ADA with an IC50 value of 47.48 nM. We showed that generated IgY antibodies may be useful for ADA detection, thus acting as a diagnostic agent in immunoenzymatic assays.
Keywords: Adenosine deaminase (ADA); Affinity purification; Anti-adenosine deaminase antibody; ELISA; Egg yolk immunoglobulin (IgY); Enzyme inhibition.
Conflict of interest statement
Conflict of Interest
The authors declare that they have no conflict of interest.
Ethics Statement
The authors state that they have obtained appropriate institutional review board approval or have followed the principles outlined in the Declaration of Helsinki for all human or animal experimental investigations.
Animal experimentation was approved by the Ethics Committee for Animal Experiments of the Wroclaw University of Environmental and Life Sciences in Wroclaw, Poland (Permit Number: 52/2010), and conducted in compliance with local and national guidelines. Animals were housed under conventional conditions and continuously monitored for any signs of distress and pain in the Vivarium of the Wroclaw University of Environmental Science, Faculty of Veterinary Medicine (Wroclaw, Poland).
Figures

Similar articles
-
IgY technology: Methods for developing and evaluating avian immunoglobulins for the in vitro detection of biomolecules.World J Methodol. 2021 Sep 20;11(5):243-262. doi: 10.5662/wjm.v11.i5.243. eCollection 2021 Sep 20. World J Methodol. 2021. PMID: 34631482 Free PMC article. Review.
-
Highly sensitive detection of cancer antigen human epidermal growth factor receptor 2 using novel chicken egg yolk immunoglobulin.Biologicals. 2015 May;43(3):165-70. doi: 10.1016/j.biologicals.2015.03.002. Epub 2015 Apr 1. Biologicals. 2015. PMID: 25841774
-
IgG antibody response to polyethylene glycol-modified adenosine deaminase in patients with adenosine deaminase deficiency.J Clin Invest. 1992 May;89(5):1643-51. doi: 10.1172/JCI115761. J Clin Invest. 1992. PMID: 1569204 Free PMC article.
-
Ecto-enzymes activities in splenic lymphocytes of mice experimentally infected by Trypanosoma cruzi and treated with specific avian immunoglobulins: an attempt to improve the immune response.Mol Cell Biochem. 2018 Nov;448(1-2):9-15. doi: 10.1007/s11010-018-3308-x. Epub 2018 Feb 12. Mol Cell Biochem. 2018. PMID: 29435869
-
Egg yolk antibodies for passive immunity.Annu Rev Food Sci Technol. 2012;3:163-82. doi: 10.1146/annurev-food-022811-101137. Epub 2011 Nov 28. Annu Rev Food Sci Technol. 2012. PMID: 22136128 Review.
Cited by
-
IgY technology: Methods for developing and evaluating avian immunoglobulins for the in vitro detection of biomolecules.World J Methodol. 2021 Sep 20;11(5):243-262. doi: 10.5662/wjm.v11.i5.243. eCollection 2021 Sep 20. World J Methodol. 2021. PMID: 34631482 Free PMC article. Review.
-
Egg yolk antibodies (IgY) and their applications in human and veterinary health: A review.Int Immunopharmacol. 2019 Aug;73:293-303. doi: 10.1016/j.intimp.2019.05.015. Epub 2019 May 22. Int Immunopharmacol. 2019. PMID: 31128529 Free PMC article. Review.
-
Correlation of adenosine deaminase operating under nitro-oxidative stress with tumor and vascularization in patients with advanced gallbladder carcinoma.J Appl Biomed. 2019 Sep;17(3):175-183. doi: 10.32725/jab.2019.016. Epub 2019 Sep 17. J Appl Biomed. 2019. PMID: 34907699
-
Development and Evaluation of an Immunoglobulin Y-Based ELISA for Measuring Prostate Specific Antigen in Human Serum.Ann Lab Med. 2019 Jul;39(4):373-380. doi: 10.3343/alm.2019.39.4.373. Ann Lab Med. 2019. PMID: 30809983 Free PMC article.
-
IgY Antibodies from Birds: A Review on Affinity and Avidity.Animals (Basel). 2023 Oct 7;13(19):3130. doi: 10.3390/ani13193130. Animals (Basel). 2023. PMID: 37835736 Free PMC article. Review.
References
-
- Gracia E, Cortes A, Meana J, et al. Human adenosine deaminase as an allosteric modulator of human A1 adenosine receptor: abolishment of negative cooperativity for [3H](R)-pia binding to the caudate nucleus. Journal of Neurochemistry. 2008;107(1):161–170. doi: 10.1111/j.1471-4159.2008.05602.x. - DOI - PubMed
MeSH terms
Substances
Grants and funding
LinkOut - more resources
Full Text Sources
Other Literature Sources
Research Materials
