. 2017 Nov;163(11):1540-1556.
doi: 10.1099/mic.0.000552. Epub 2017 Oct 18.

N-acetylglucosamine affects Cryptococcus neoformans cell-wall composition and melanin architecture

Affiliations

N-acetylglucosamine affects Cryptococcus neoformans cell-wall composition and melanin architecture

Emma Camacho et al. Microbiology (Reading). 2017 Nov.

Abstract

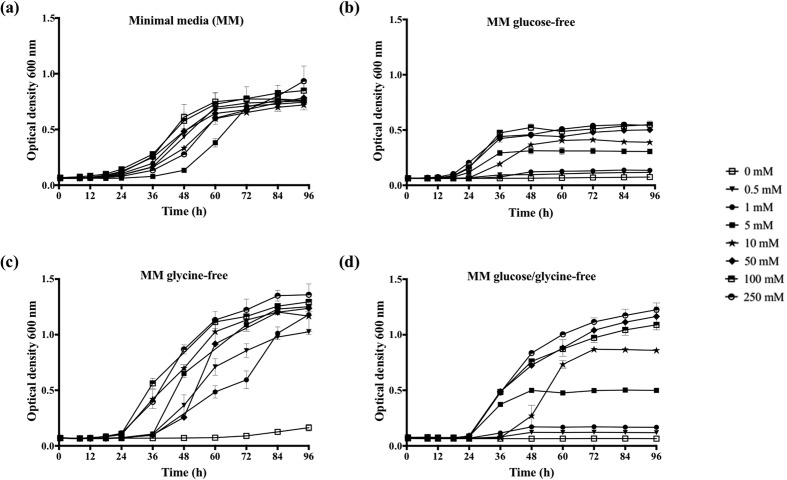
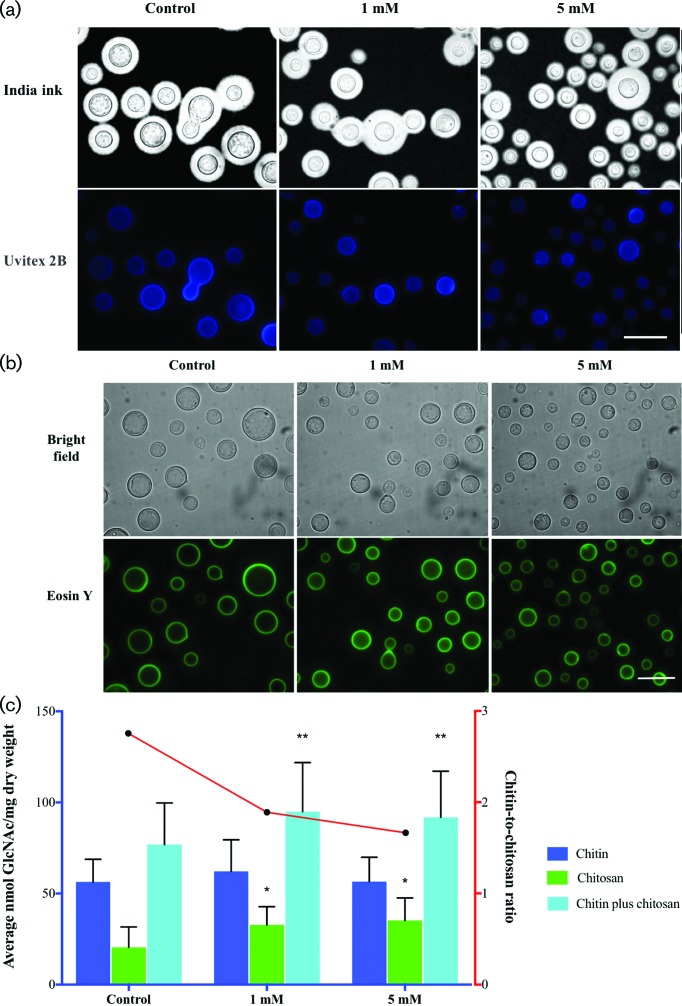
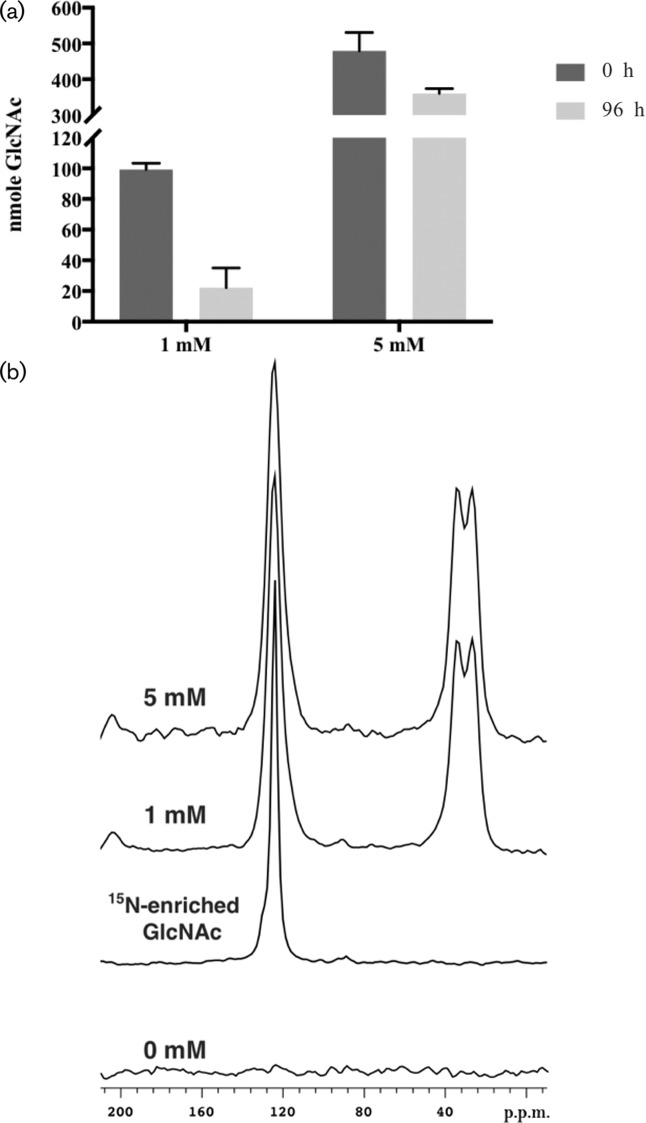
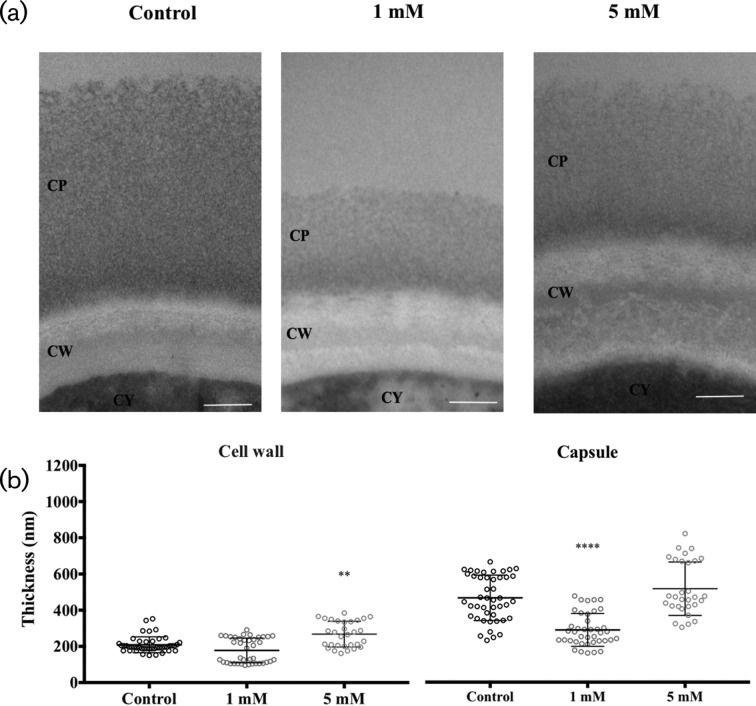
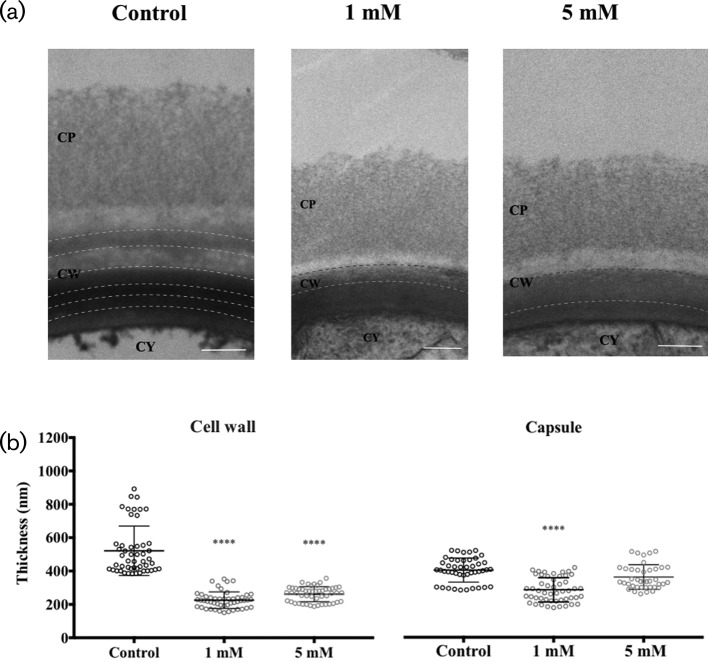
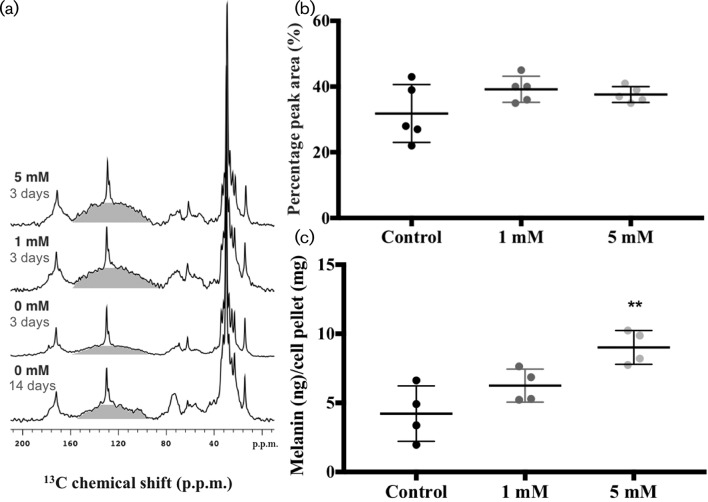
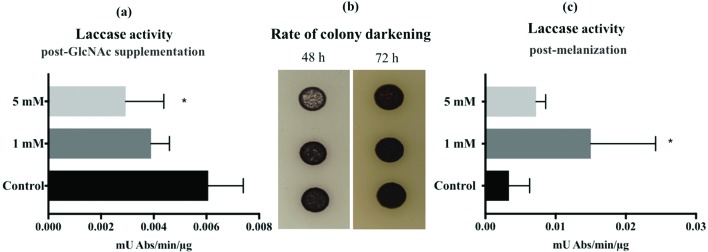
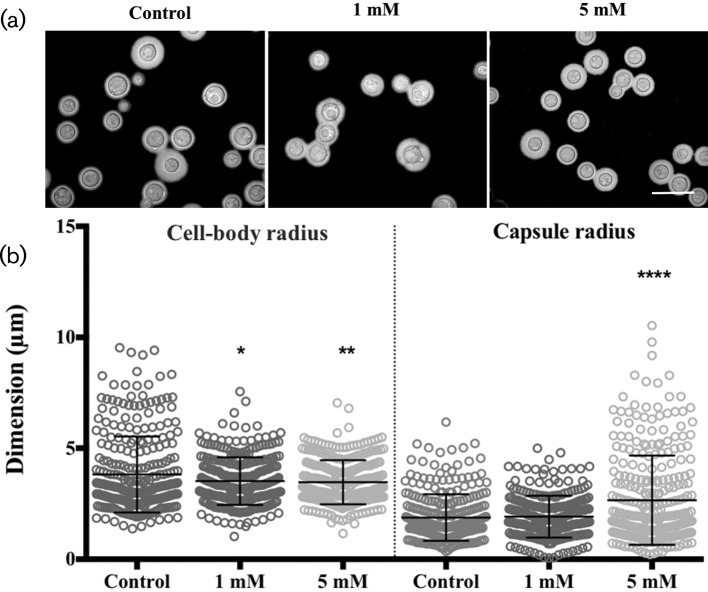
Cryptococcus neoformans is an environmental fungus that belongs to the phylum Basidiomycetes and is a major pathogen in immunocompromised patients. The ability of C. neoformans to produce melanin pigments represents its second most important virulence factor, after the presence of a polysaccharide capsule. Both the capsule and melanin are closely associated with the fungal cell wall, a complex structure that is essential for maintaining cell morphology and viability under conditions of stress. The amino sugar N-acetylglucosamine (GlcNAc) is a key constituent of the cell-wall chitin and is used for both N-linked glycosylation and GPI anchor synthesis. Recent studies have suggested additional roles for GlcNAc as an activator and mediator of cellular signalling in fungal and plant cells. Furthermore, chitin and chitosan polysaccharides interact with melanin pigments in the cell wall and have been found to be essential for melanization. Despite the importance of melanin, its molecular structure remains unresolved; however, we previously obtained critical insights using advanced nuclear magnetic resonance (NMR) and imaging techniques. In this study, we investigated the effect of GlcNAc supplementation on cryptococcal cell-wall composition and melanization. C. neoformans was able to metabolize GlcNAc as a sole source of carbon and nitrogen, indicating a capacity to use a component of a highly abundant polymer in the biospherenutritionally. C. neoformans cells grown with GlcNAc manifested changes in the chitosan cell-wall content, cell-wall thickness and capsule size. Supplementing cultures with isotopically 15N-labelled GlcNAc demonstrated that the exogenous monomer serves as a building block for chitin/chitosan and is incorporated into the cell wall. The altered chitin-to-chitosan ratio had no negative effects on the mother-daughter cell separation; growth with GlcNAc affected the fungal cell-wall scaffold, resulting in increased melanin deposition and assembly. In summary, GlcNAc supplementation had pleiotropic effects on cell-wall and melanin architectures, and thus established its capacity to perturb these structures, a property that could prove useful for metabolic tracking studies.

Keywords: N-acetylglucosamine; chitin; chitosan; fungal cell wall; melanin.


Conflict of interest statement

The authors declare that there are no conflicts of interest.

Figures

Fig. 1.
Fig. 1.
C. neoformans can use GlcNAc as a source of carbon and nitrogen. Representative growth curves of C. neoformans strain H99 in minimal media (MM) with different concentrations of N-acetylglucosamine (GlcNAc) as supplementation. (a) MM plus GlcNAc. (b) MM glucose-free plus GlcNAc. (c) MM glycine-free plus GlcNAc. (d) MM glucose/glycine-free plus GlcNAc. Fungal cell growth was recorded at an optical density of 600 nm in a Bioscreen reader with continuous shaking at 30 °C for 96 h. Each growth curve was performed in two–three independent experiments with similar results. Data represent mean±sd; each point was analysed in triplicate.
Fig. 2.
Fig. 2.
GlcNAc supplementation alters the C. neoformans cell-wall chitin-to-chitosan ratio. (a) Top panel, India ink staining that allows the capsule and cell body size to be visualized. Bottom panel, Uvitex 2B staining for chitin qualitative detection. (b) Bright field and eosin Y staining for chitosan staining. (c) Bar graph, biochemical determination of chitin, chitosan and the total of chitin plus chitosan using the MBTH colorimetric reaction measured at 650 nm. The data represent an average of four independent cultures for each condition. The error bars indicate standard deviations. An asterisk indicates a significant difference (P<0.05) between the chitosan content of the control and that of the supplemented samples. Two asterisks indicate a significant difference (P<0.005) between the chitin plus chitosan content of the control and the supplemented samples. Line graph, median value of chitin-to-chitosan ratio of three independent cultures for each condition. These experiments were performed after 96 h of supplementation with GlcNAc in MM at 30 °C. All pictures were taken with the same exposure time as a control (at a magnification of 100×). Scale bar, 10 µm.
Fig. 3.
Fig. 3.
Exogenous GlcNAc is taken up by C. neoformans cells and utilized as a cell-wall building block. (a) GlcNAc quantification of culture media supernatant before and after 96 h of fungal growth at 30 °C in MM supplemented with GlcNAc. The GlcNAc levels were measured using a modified 3-methyl-2-benzothiazolinone hydrazone hydrochloride (MBTH) colorimetric reaction at 560 nm. The data represent the mean of results from three independent samples for each condition. The error bars indicate standard deviations. (b) 15N cross-polarization (CPMAS) NMR spectra of lyophilized alkaline-extracted cell-wall material from cells grown in the presence of 15N-enriched GlcNAc displaying strong signals at approximately 123 and 30 p.p.m., which are characteristic of chitin and chitosan, respectively, thereby strongly suggesting that the exogenous substrate is internalized and indeed readily utilized as a precursor for cell-wall constituents. The spectrum of N-acetyl-d-[15 N]glucosamine (second from bottom) used for cell-supplementation is shown for comparison.
Fig. 4.
Fig. 4.
The C. neoformans cell-wall ultrastructural architecture is remodelled by GlcNAc supplementation. (a) Representative transmission electron micrographs of C. neoformans post-GlcNAc supplementation, showing electron-dense structures of the cell wall (CW) and capsule (CP). (b) Measurement of cell-wall and capsule thickness. On the cell-wall panel (left), two asterisks indicate a significant difference (P<0.005) between the cell-wall thickness of the control and the 5 mM GlcNAc-supplemented sample. On the capsule panel (right), four asterisks indicate a significant difference (P<0.0001) between the capsule thickness of the control and the 1 mM GlcNAc-supplemented sample. Scale bar, 200 nm. CY, cytoplasm.
Fig. 5.
Fig. 5.
C. neoformans melanized cell-wall thickness is reduced by GlcNAc supplementation. (a) Representative transmission electron micrographs of C. neoformans melanized cell sections post-GlcNAc supplementation, showing layered (dash lines) melanin deposition on the cell wall (CW) and capsule size (CP). (b) Measurement of melanized cell-wall and capsule thickness. On the cell-wall panel (left), four asterisks indicate a significant difference (P<0.0001) between the cell-wall thickness of the control and the GlcNAc-supplemented samples. On the capsule panel (right), an asterisk indicates a significant difference (P<0.05) between the capsule thickness of the control and the 5 mM GlcNAc-supplemented sample. Four asterisks indicate a significant difference (P<0.0001) between the capsule thickness of the control and the 1 mM GlcNAc-supplemented sample. Scale bar, 200 nm. CY, cytoplasm.
Fig. 6.
Fig. 6.
The melanin scaffold is altered by GlcNAc supplementation. (a) Representative 150 MHz 13C NMR spectra of melanin ghosts from C. neoformans after GlcNAc supplementation showing an increased signal intensity from the aromatic moieties (110–160 p.p.m., shaded area). (b) Quantitative measurement of the amount melanin in terms of the relative amount of indole-based pigment compared with the membrane and cell-wall constituents, using the 13C direct-polarization magic-angle spinning (DPMAS) technique. The data represent the mean of results from five experimental trials. The error bars represent standard deviation. Each spectrum is normalized by setting the largest peak to full scale. (c) Estimation of melanin ghost mass per cell pellet weight. The data represent the mean of results from four experimental samples for each condition. The error bars represent standard deviation. Two asterisks indicates a significant difference (P value<0.01) between melanin ghost mass per cell pellet weight of the control and the 5 mM GlcNAc-supplemented sample.
Fig. 7.
Fig. 7.
C. neoformans melanin biosynthesis is altered by GlcNAc supplementation. (a) Laccase activity of C. neoformans cells post-GlcNAc supplementation, demonstrating inhibition of the enzymatic activity on supplemented cells in comparison to control. The data represent the mean of results from one experimental trial in triplicate. The error bars represent standard deviation. A significant difference (P<0.05) between the laccase activity of the control and the 5 mM GlcNAc-supplemented sample is indicated with one asterisk. (b) Rate of colony darkening after cells were grown in media supplemented with different GlcNAc concentrations or without it, showing that 5 mM GlcNAc-supplemented cells have a noticeable delayed effect on melanin production at 48 h. A 3 µl drop of each culture adjusted to 106 cells ml−1 was spotted on MM with l-DOPA agar at 30 ˚C. Melanin production was monitored every 24 h. These results are representative of two independent experiments. (c) Laccase activity of C. neoformans cells after melanization for 72 h, showing that both GlcNAc-supplemented cells displayed increased enzymatic activity in comparison to non-supplemented melanized control cells. The data represent the mean of results from two independent runs, with each sample analysed in duplicate. The error bars represent standard deviation. One asterisk represents a significant difference (P<0.05) between the laccase activity of the control and that of the 1 mM GlcNAc-supplemented sample.
Fig. 8.
Fig. 8.
GlcNAc supplementation leads to changes in C. neoformans cell morphology. (a) Representative images of C. neoformans with India ink counterstaining post-GlcNAc supplementation (at a magnification of ×1000). Scale bar, 10 µm. (b) The morphology data show the mean of measurements for 100 cells per condition in three independent experiments for a total of 300 cells. The error bars represent standard deviations. An asterisk indicates a significant difference (P-value <0.05) between the cell-body radius of the control and the 1 mM GlcNAc-supplemented sample. Two asterisks indicate a significant difference (P-value <0.005) between the cell body radius of the control and the 5 mM GlcNAc-supplemented sample. Four asterisks indicate a significant difference (P-value <0.0001) between the capsule radius of the control and the 5 mM GlcNAc-supplemented sample.
Fig. 9.
Fig. 9.
C. neoformans shows increased azole resistance post-GlcNAc supplementation. C. neoformans cells post-GlcNAc supplementation were tested for antifungal susceptibility (minimum inhibitory concentration) using a microdilution protocol at 37 °C, with 180 r.p.m. shaking for 48 h. Growth density was measured at 492 nm. The data represent the mean of results from two to three experimental trials. On the voriconazole panel (top right), two asterisks indicates a significant difference (P-value <0.001) between the MIC 50 of the control and 5 mM supplemented samples, three asterisks indicates a significant difference (P-value ≤0.0005) between the MIC 50 of the control and the 1 mM-supplemented sample. On the fluconazole panel (bottom left), three asterisks indicates a significant difference (P-value ≤0.0005) between the MIC 50 of the control and the 5 mM-supplemented samples.

Similar articles

Cited by

References

    1. Casadevall A, Perfect JR. Cryptococcus Neoformans. Washington, DC: American Society for Microbiology; 1998.
    1. Meya D, Rajasingham R, Nalintya E, Tenforde M, Jarvis JN. Preventing cryptococcosis-shifting the paradigm in the era of highly active antiretroviral therapy. Curr Trop Med Rep. 2015;2:81–89. doi: 10.1007/s40475-015-0045-z. - DOI - PMC - PubMed
    1. Mirza SA, Phelan M, Rimland D, Graviss E, Hamill R, et al. The changing epidemiology of cryptococcosis: an update from population-based active surveillance in 2 large metropolitan areas, 1992–2000. Clin Infect Dis. 2003;36:789–794. doi: 10.1086/368091. - DOI - PubMed
    1. Alspaugh JA. Virulence mechanisms and Cryptococcus neoformans pathogenesis. Fungal Genet Biol. 2015;78:55–58. doi: 10.1016/j.fgb.2014.09.004. - DOI - PMC - PubMed
    1. McClelland EE, Bernhardt P, Casadevall A. Estimating the relative contributions of virulence factors for pathogenic microbes. Infect Immun. 2006;74:1500–1504. doi: 10.1128/IAI.74.3.1500-1504.2006. - DOI - PMC - PubMed