. 2017 Oct 18;8(1):1022.
doi: 10.1038/s41467-017-01122-1.

OCT4 impedes cell fate redirection by the melanocyte lineage master regulator MITF in mouse ESCs

Affiliations

OCT4 impedes cell fate redirection by the melanocyte lineage master regulator MITF in mouse ESCs

Danna Sheinboim et al. Nat Commun. .

Abstract

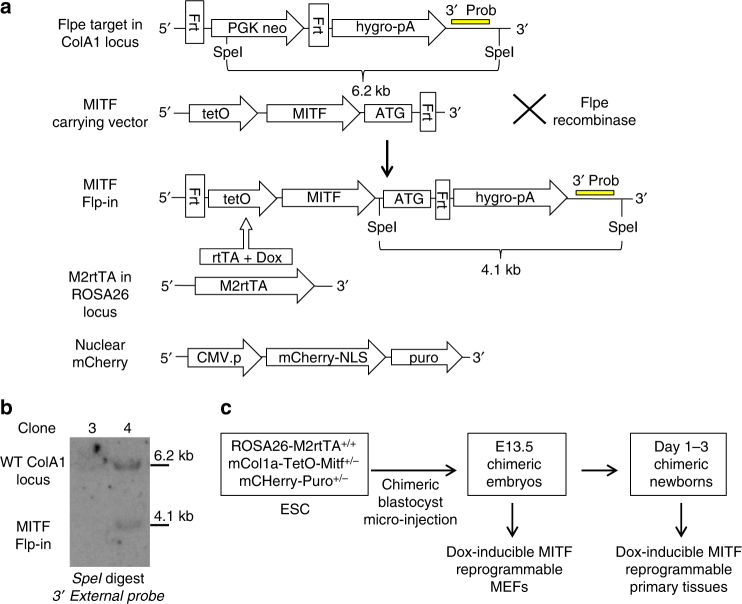
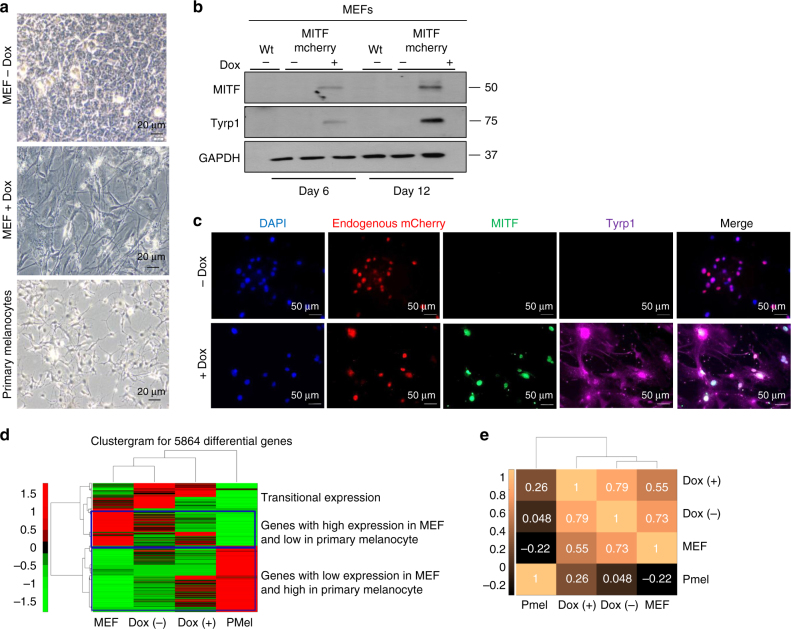
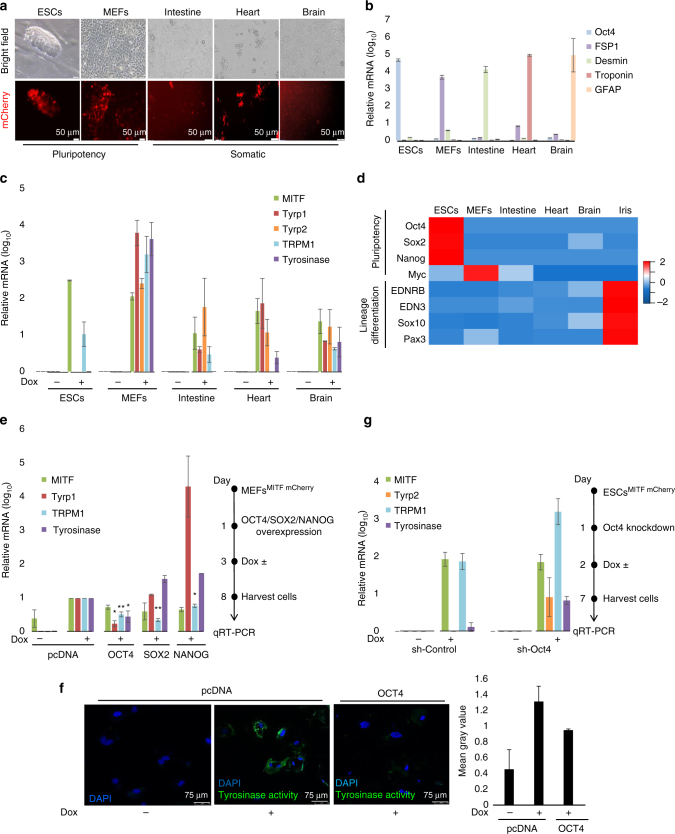
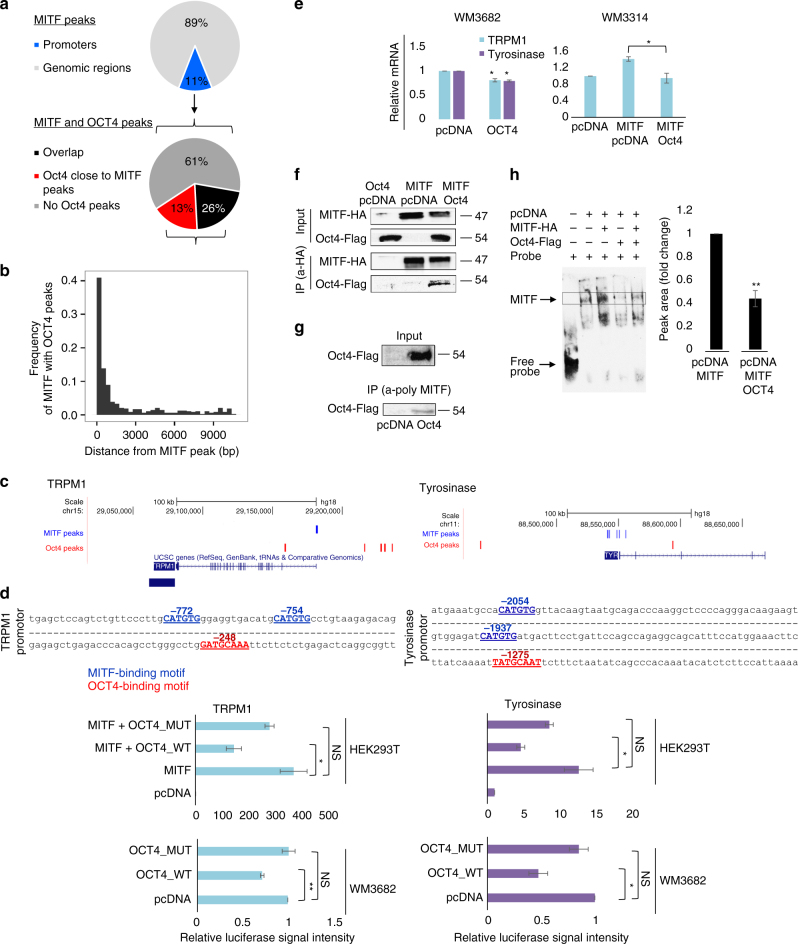
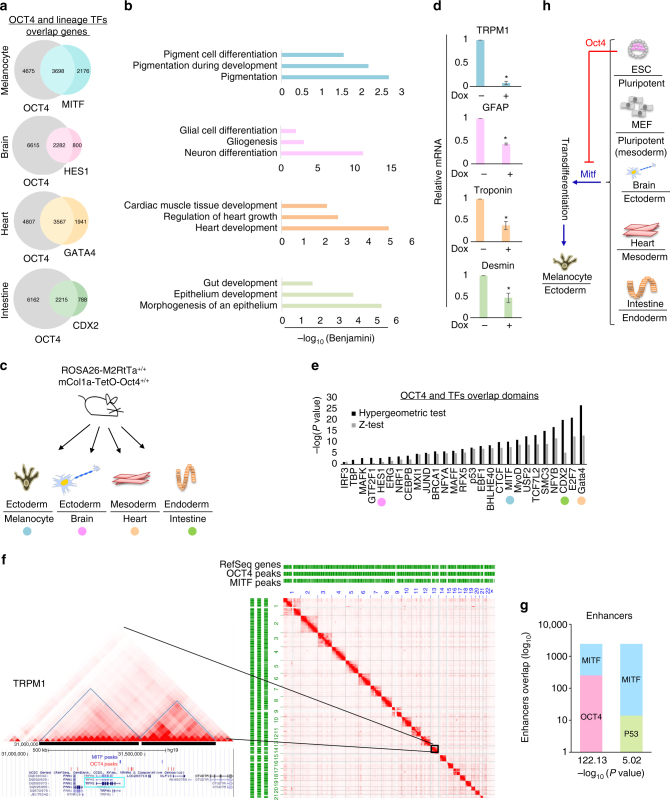
Ectopic expression of lineage master regulators induces transdifferentiation. Whether cell fate transitions can be induced during various developmental stages has not been systemically examined. Here we discover that amongst different developmental stages, mouse embryonic stem cells (mESCs) are resistant to cell fate conversion induced by the melanocyte lineage master regulator MITF. By generating a transgenic system we exhibit that in mESCs, the pluripotency master regulator Oct4, counteracts pro-differentiation induced by Mitf by physical interference with MITF transcriptional activity. We further demonstrate that mESCs must be released from Oct4-maintained pluripotency prior to ectopically induced differentiation. Moreover, Oct4 induction in various differentiated cells represses their lineage identity in vivo. Alongside, chromatin architecture combined with ChIP-seq analysis suggest that Oct4 competes with various lineage master regulators for binding promoters and enhancers. Our analysis reveals pluripotency and transdifferentiation regulatory principles and could open new opportunities in the field of regenerative medicine.


Conflict of interest statement

The authors declare no competing financial interests.

Figures

Fig. 1
Fig. 1
Generation of Dox inducible Mitf reprogrammable system. a A schematic illustration of the Frt-tetO-Mitf knock-in construct directed to the Flpe mCol1a cassette. Also indicated are 3’ Southern blot external probes and the nuclear mCherry transgene marker. b Southern blot verification of tetO-Mitf knock-in to mESCs. Clone #3 was incorrectly targeted, whereas clone #4 was correctly targeted and was used for injection into E3.5blastocyst to obtain ROSA26-M2RtTa+/+mCol1a-TetO-Mitf +/− derived MEFs and somatic cells. c A schematic illustration of the Mitf knock-in reprogrammable MEFs and somatic cells
Fig. 2
Fig. 2
MITF efficiently transdifferentiates MEFs. a Bright field images of Mitf knock-in MEFs showing morphological changes at 12 days after Mitf induction by Dox supplementation and of untreated Mitf knock-in MEFs and primary mouse melanocytes. This was one of n = 3 experiments. b MITF and TYRP1 protein levels in Mitf knock-in MEFs at days 6 and 12 post Dox induction. This was one of n = 3 experiments. c Immunostaining of MITF (green) and TYRP1 (purple) in MEFs at day 6 post Dox induction with endogenous expression of mCherry (red). This was one of n = 3 experiments. d Hierarchical clustering of genes differentially expressed in MEFs before and after induction of Mitf expression (5864 genes) using Spearman correlation as a distance metric, Ward’s linkage, and per-row standardization (z score). e Spearman’s correlation was calculated over all exons that show differential ( > 4 fold change) expression between MEFs and melanocyte samples (45,155 exons)
Fig. 3
Fig. 3
OCT4 impedes mESCs differentiation despite MITF expression. a Representative microscopy images of mESCs, MEFs, and cells from the intestine, heart, and brain from Mitf knock-in chimera mice. This was one of n = 3 experiments. b Expression of lineage specific markers in the investigated cell types are shown. Levels were normalized to Gapdh. Error bars represent ± SEM (n = 3). c Mitf, Tyrp1, Tyrp2, Trpm1, and Tyrosinase mRNA levels in the indicated cells at day 6 post Dox induction and in vehicle-treated cells. Relative levels were normalized to Gapdh. Error bars represent ± SEM (n = 3). d Gene expression profile of the investigated cells. e MEFs were transfected with expression plasmids or transduced with retroviruses for expression of OCT4, SOX2, or NANOG. Mitf, Tyrp1, Trpm1, and Tyrosinase mRNA levels were evaluated at day 6 post Dox induction. Levels were normalized to Gapdh. Fold changes relative to control cells transfected with empty vector (pcDNA) and treated with Dox are shown. Error bars represent ± SEM. * indicates p < 0.05, ** indicates p < 0.01 (n = 3). Experiment process is shown schematically to the right. f MEFs were transfected with a plasmid for expression of OCT4 or empty vector control (pcDNA). Tyrosinase activity (Cy5, green) was evaluated at day 6 post Dox induction. Nuclei appear blue (DAPI). Green pixel quantification for 10 nuclei from each treatment using ImageJ software is plotted to the right. This was one of n = 2 experiments. g mESCs were transduced with lentiviral vectors for expression of shRNA targeting Oct4 or empty vector as control (sh-control). Mitf, Tyrp2, Trpm1, and Tyrosinase mRNA levels were evaluated at day 6 post Dox induction. Levels were normalized to Gapdh, and fold changes relative to control are shown. Error bars represent ± SEM (n = 2). Experiment process is presented schematically on the right
Fig. 4
Fig. 4
OCT4 interferes with MITF transcriptional activity. a Pie chart represents promoter regions occupied by MITF (upper panel) and of the realms engaged by MITF and OCT4 (lower panel). b Frequency of OCT4 and MITF peaks within a given distance. c Illustration of MITF and OCT4 peak positions on TRPM1 (left panel) and TYR (right panel) generated by uploading MITF and OCT4 ChIP-seq data, into “UCSC genome browser”. d Upper panel: regions upstream of the transcription start site which were cloned into Luciferase reporter plasmids are shown; numbers indicate nucleotide position. MITF binding motif (E-box: CATGTG) appears blue and OCT4 binding motif (Octamer box: NATGCAAN) appears red. Lower panel: HEK293T or WM3682 cells were co-transfected with luciferase reporter driven by TRPM1 or TYR promoter and wild-type OCT4 (OCT4_WT), mutated OCT4 (OCT4_MUT) or empty plasmid as control. HEK293T cells were also co-transfected with plasmid for expression of MITF. Luciferase activity was normalized to Renilla. Fold changes relative to control are shown. Error bars represent ± SEM, * indicates p < 0.05, ** indicates p < 0.01 (n = 3). e Left: WM3682 were transfected with vector for OCT4 expression or empty vector. TRPM1 and TYR mRNA levels normalized to GAPDH. Error bars represent ± SEM, * indicates p < 0.05 (n = 3). Right: WM3314 cells were transfected with vectors for expression of MITF and OCT4. TRPM1 mRNA levels normalized to GAPDH. Error bars represent ± SEM, * indicates p < 0.05 (n = 3). f Co-IP assay of MITF-HA and OCT4-flag in HEK293T cells. Samples were precipitated using anti-HA antibody. Anti-HA or anti-flag antibodies were used for western blot. This was one of n = 3 experiments. g Co-IP assay of endogenous MITF and OCT4-flag in WM3682 melanoma. Samples were precipitated using anti MITF antibody. Anti-flag were used for western blot. This was one of n = 2 experiments. h EMSA was conducted using a probe corresponding to the E-box region. HEK293T nuclear extracts were incubated with biotinylated probe. Bands corresponding to MITF binding and free probe are marked with arrows. Graph represent bands quantification ± SEM, * indicates p < 0.05 (n = 3)
Fig. 5
Fig. 5
Oct4 maintains pluripotency and prevents differentiation. a Venn diagrams represent the number of gene promoters bound by OCT4 and lineage specific transcription factors based on ChIP-seq. b A view of the selected biological pathways identified by Gene Ontology enrichment analysis of genes bound by OCT4 and lineage-specific factors. c Melanocytes were generated from the epidermis and primary cells were extracted from brain, heart, and intestine of mice that can be induced to express Oct4. d Levels of lineage-specific mRNAs in the indicated cell types at day 6 post Dox induction of Oct4 expression relative to vehicle treated cells are shown. Levels were normalized to Gapdh. Error bars represent ± SEM. * indicates p < 0.05 (n = 2). e Overlap between OCT4 and indicated transcription factor peaks in Hi-C domains. Lineage specific transcription factors are highlighted in colors corresponding to the Venn diagrams in a. f Right: Hi-C map of human lymphoblastoid cells. RefSeq genes and ChIP-seq peaks of OCT4 and MITF are shown as green horizontal lines. Left: Chromosome 15 is magnified and the melanogenic marker TRPM1 is marked with blue square. TRPM1 is in the black highlighted domains. g Graphs show the number of unique and overlapping enhancer regions bound by MITF and OCT4 or by MITF and P53 based on ChIP-seq coordinates. h A suggested model representing that high expression of Oct4 in mESCs inhibits Mitf induced differentiation whereas Mitf induced transdifferentiation is not hindered when Oct4 is found in lower concentrations

References

    1. Takahashi K, Yamanaka S. Induction of pluripotent stem cells from mouse embryonic and adult fibroblast cultures by defined factors. Cell. 2006;126:663–676. doi: 10.1016/j.cell.2006.07.024. - DOI - PubMed
    1. Masui S, et al. Pluripotency governed by Sox2 via regulation of Oct3/4 expression in mouse embryonic stem cells. Nat. Cell. Biol. 2007;9:625–635. doi: 10.1038/ncb1589. - DOI - PubMed
    1. Singh VK, Kalsan M, Kumar N, Saini A, Chandra R. Induced pluripotent stem cells: applications in regenerative medicine, disease modeling, and drug discovery. Frontiers in cell and developmental biology. 2015;3:2. doi: 10.3389/fcell.2015.00002. - DOI - PMC - PubMed
    1. Graf T, Enver T. Forcing cells to change lineages. Nature. 2009;462:587–594. doi: 10.1038/nature08533. - DOI - PubMed
    1. Ladewig J, Koch P, Brustle O. Leveling waddington: the emergence of direct programming and the loss of cell fate hierarchies. Nat. Rev. Mol. Cell. Biol. 2013;14:225–236. doi: 10.1038/nrm3543. - DOI - PubMed

Publication types

MeSH terms

Substances