. 2017 Oct 18;7(1):13504.
doi: 10.1038/s41598-017-14077-6.

Wax Ester Synthase/Diacylglycerol Acyltransferase Isoenzymes Play a Pivotal Role in Wax Ester Biosynthesis in Euglena gracilis

Affiliations

Wax Ester Synthase/Diacylglycerol Acyltransferase Isoenzymes Play a Pivotal Role in Wax Ester Biosynthesis in Euglena gracilis

Takuya Tomiyama et al. Sci Rep. .

Abstract

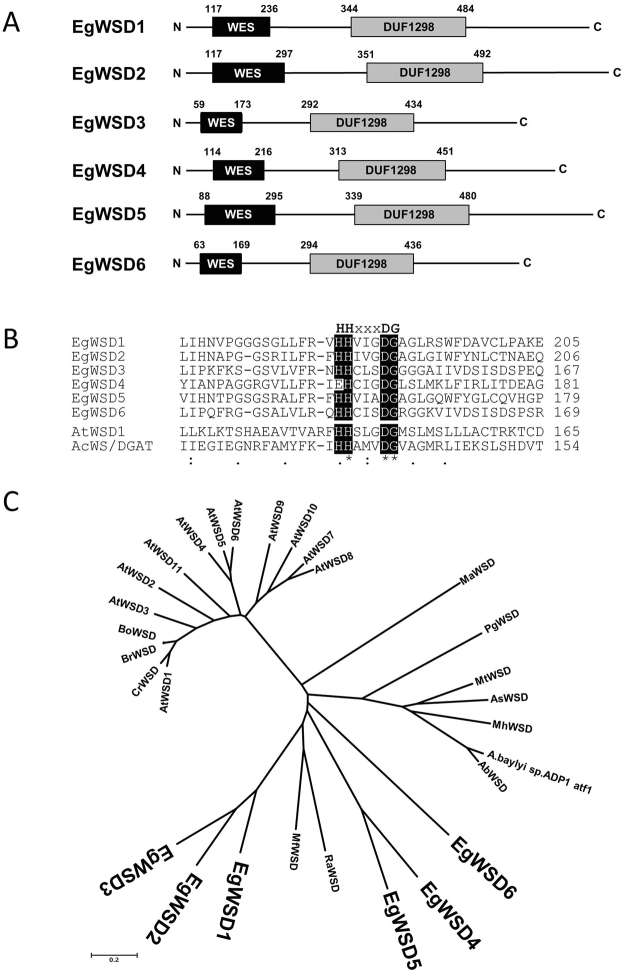
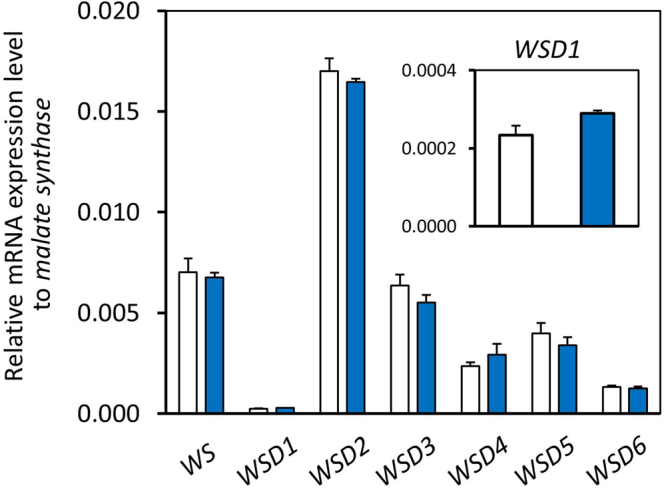
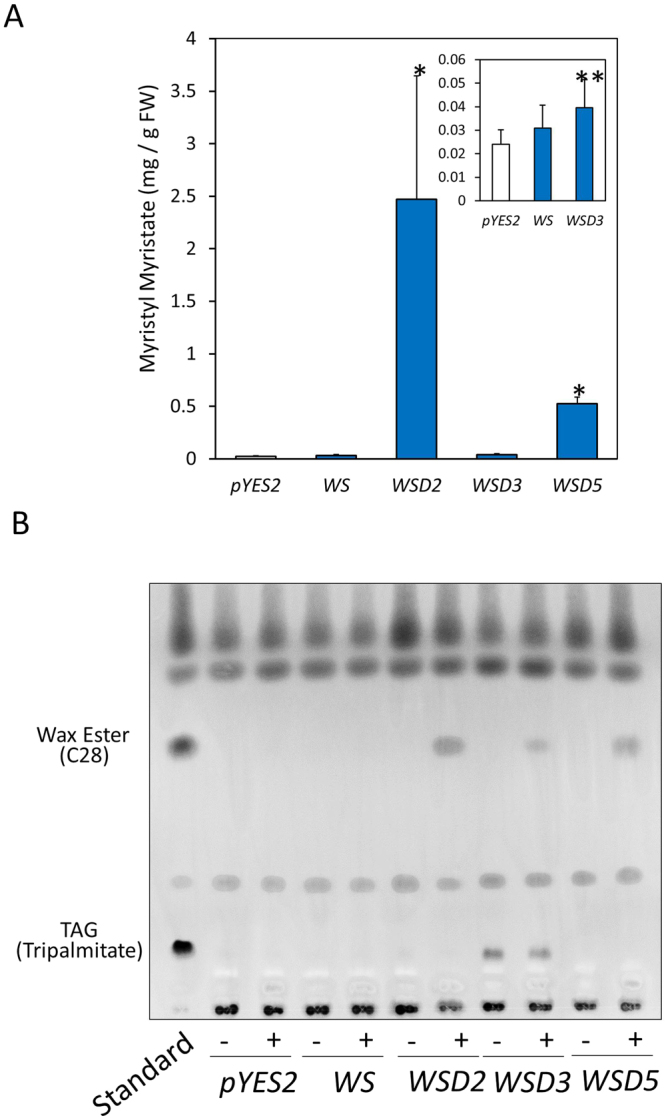
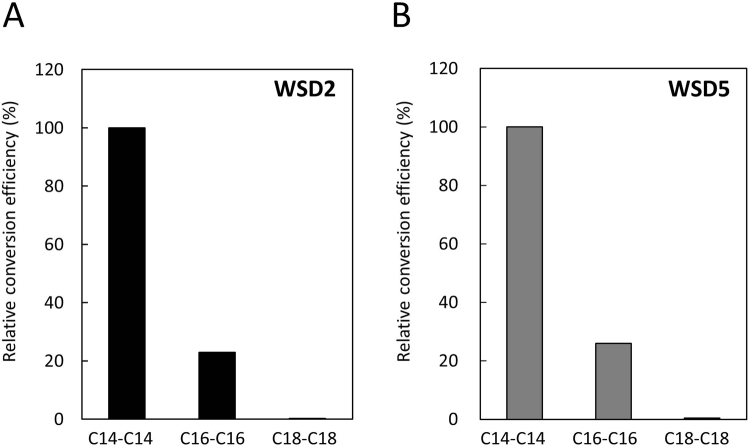
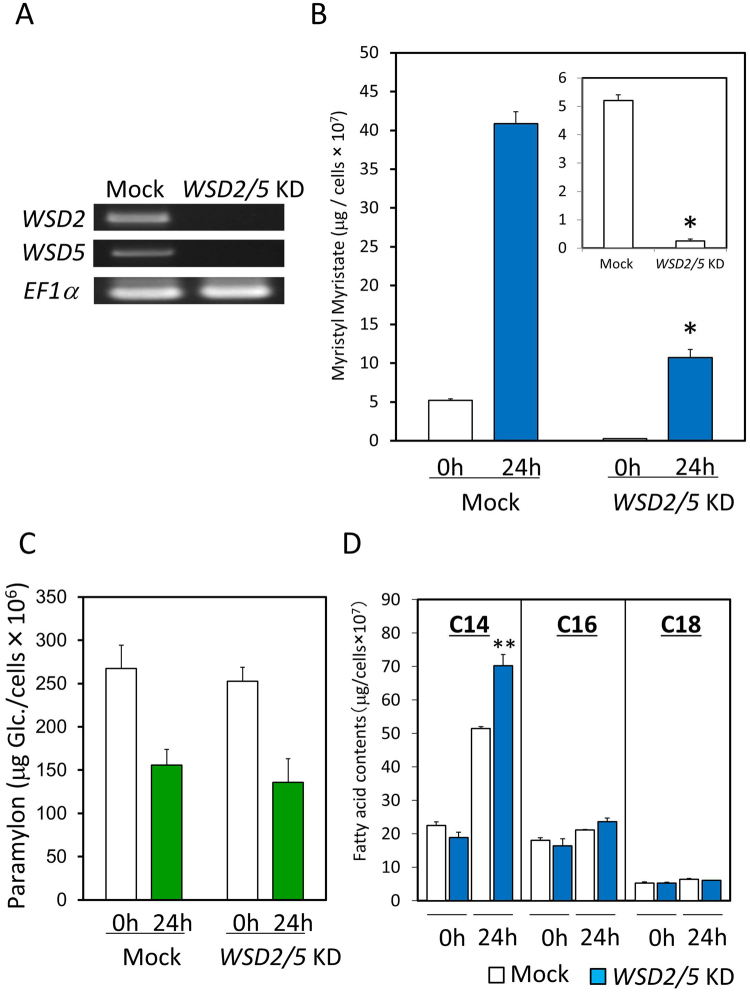
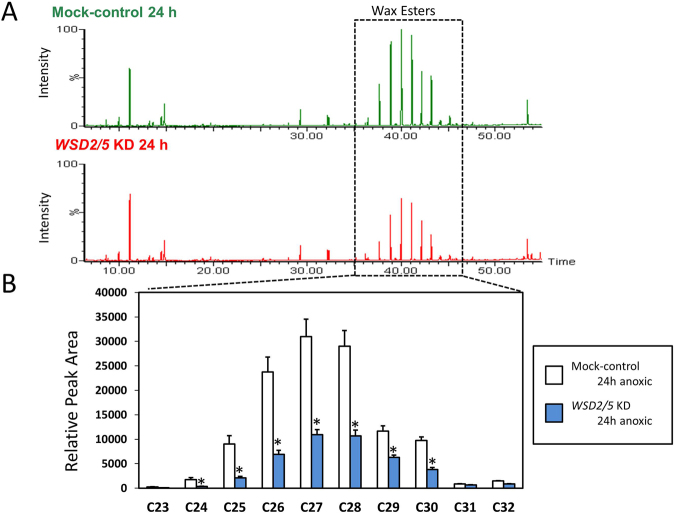
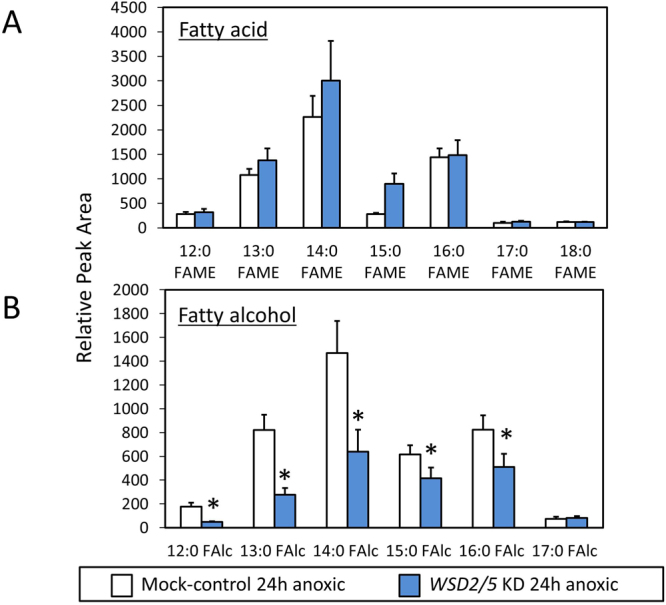
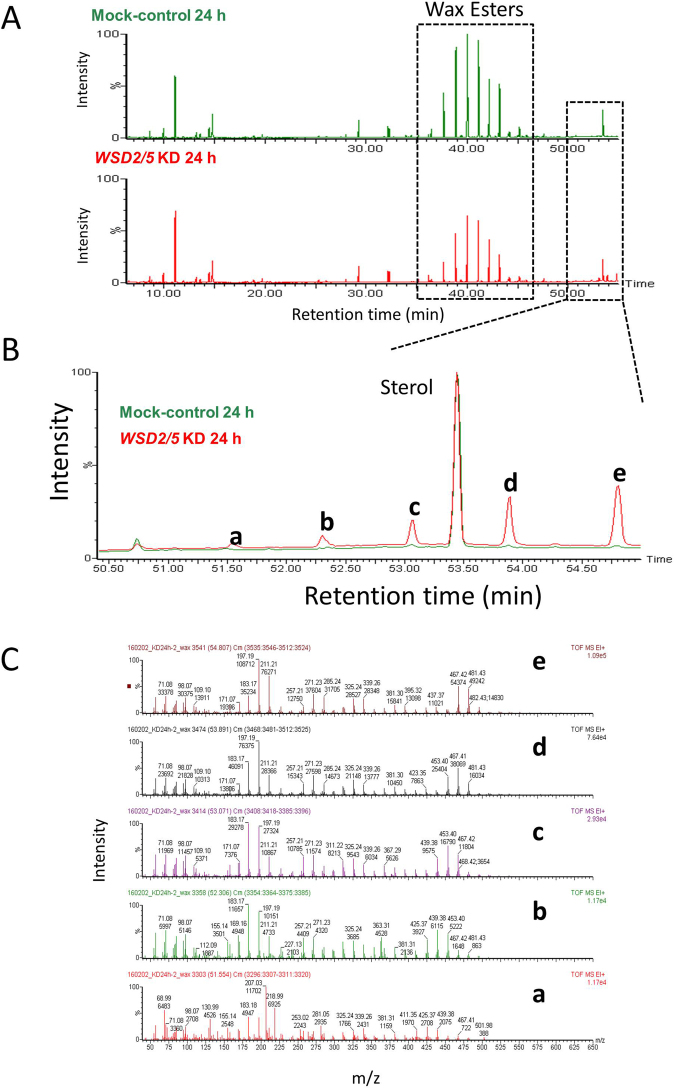
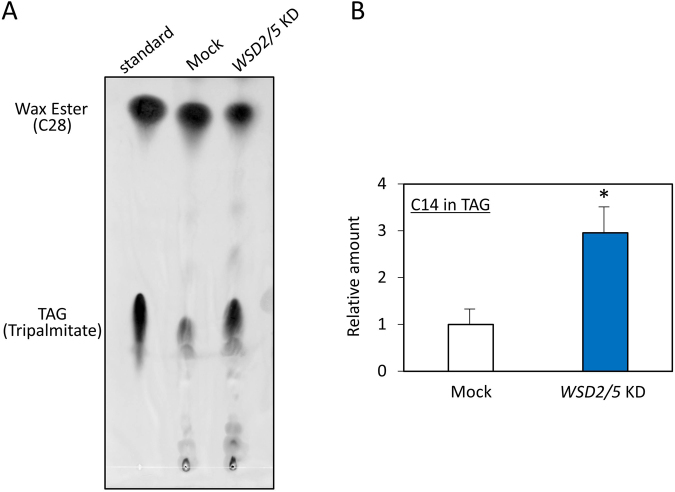
Wax ester fermentation is a unique energy gaining pathway for a unicellular phytoflagellated protozoan, Euglena gracilis, to survive under anaerobiosis. Wax esters produced in E. gracilis are composed of saturated fatty acids and alcohols, which are the major constituents of myristic acid and myristyl alcohol. Thus, wax esters can be promising alternative biofuels. Here, we report the identification and characterization of wax ester synthase/diacylglycerol acyltrasferase (WSD) isoenzymes as the terminal enzymes of wax ester production in E. gracilis. Among six possible Euglena WSD orthologs predicted by BLASTX search, gene expression analysis and in vivo evaluation for enzyme activity with yeast expressing individual recombinant WSDs indicated that two of them (EgWSD2 and EgWSD5) predominantly function as wax ester synthase. Furthermore, experiments with gene silencing demonstrated a pivotal role of both EgWSD2 and EgWSD5 in wax ester synthesis, as evidenced by remarkably reduced wax ester contents in EgWSD2/5-double knockdown E. gracilis cells treated with anaerobic conditions. Interestingly, the decreased ability to produce wax ester did not affect adaptation of E. gracilis to anaerobiosis. Lipid profile analysis suggested allocation of metabolites to other compounds including triacylglycerol instead of wax esters.


Conflict of interest statement

The authors declare that they have no competing interests.

Figures

Figure 1
Figure 1
Primary structure of WSD isoforms in E. gracilis. (A) Molecular organization of six WSD isoforms. Designations of putative domains were based on Pfam domain database: WES, wax ester synthase-like acyl-CoA acyltransferase domain; DUF1298, domain of unknown function. (B) Comparison of putative active site residues of WSDs from Euglena (EgWSD1-6, LC069357-LC069364), Arabidopsis (AtWSD1, At1G72110) and Acinetobacter calcoaceticus ADP1 (AcWS/DGAT, AF529086) using the ClustalW program. Amino acids matching the putative active site motif HHxxxDG are shaded in black. (C) Phylogenetic analysis of the six WSDs from Euglena and proteins related to WSD from other organisms. Phylogenetic trees were constructed with full-length WSD amino acid sequences using the neighbor-joining (NJ) method using the MEGA 6.0 software (http://www.megasoftware.net/). Sequence alignments were assembled by the ClustalW algorithem version 2.1. Abbreviations and UniProt accession numbers except for EgWSDs are as follows: At, Arabidopsis thaliana (AtWSD1-11, Q93ZR6, Q9C7H4, F4IU14, Q9M3B3, Q9M3B2, Q9M3B1, Q94CK0, Q9FFE8, Q9FK89, Q9FK04, Q5KS41); Bo, Brassica oleracea var. oleracea (A0A0D3APY8); Br, Brassica rapa (A0A078CR28); Cr, Capsella rubella (R0IEG2); Ab, Acinetobacter baumannii (A0A077GKS2); As, Amycolicicoccus subflavus DQS3-9A1 (F6EKR7); Mh, Marinobacter hydrocarbonoclasticus (A3RE50); A.baylyi sp.ADP1 aft, Acinetobacter baylyi sp. ADP1(Q8GGG1); Mt, Mycobacterium tuberculosis (P9WKC7); Ra, Rhodococcus aetherivorans (A0A1Q8I8D0); Mf, Myxococcus fulvus 124B02 (A0A0F7DYG7); Ma, Mucor ambiguus (A0A0C9N7W4); Pg, Photobacterium ganghwense (A0A0J1HAU3).
Figure 2
Figure 2
Quantitative expression analysis of WS and WSD genes in response to aerobic and anaerobic conditions. Total RNA was extracted from 7-d-old Euglena SM-ZK cells grown heterotrophically under normal growth conditions (white bar) and the cells anaerobically treated for 24 h (blue bar). Quantitative PCR analysis was performed to determine the expression levels of the indicated genes. Relative expression levels were normalized to malate synthase mRNA. Values are the mean ± SD of three independent measurements.
Figure 3
Figure 3
In vivo evaluation of wax ester synthesis activities of EgWSDs in yeast H1246 cells. (A) TAG synthesis-deficient yeast mutant transformed with an empty vector (pYES2), WS, and WSDs were grown to exponential phase and were incubated for 48 h after supplementation of 250 µM myristic acid and 1-tetradecanol. Myristyl myristate contents were determined and quantified by GC-MS analysis. Asterisks denote statistically significant differences (*p < 0.01, **p < 0.05) compared with vector control (pYES2). Values are the mean ± SD of three independent experiments. (B) TLC analysis of whole yeast extracts from each transformed line supplemented with both 250 μM myristic acid and 1-tetradecanol (+), and 250 μM myristic acid only (−). Lipids were extracted from each transformed yeast, and separated on a Silica gel 60 plate as described in Materials and Methods section.
Figure 4
Figure 4
Substrate specificity of WSD2 and WSD5. The analysis was performed using transformed yeast H1246 expressing recombinant WSD2 (A) and WSD5 (B). Yeast cells were grown to exponential phase and were incubated for 24 h after supplementation of 250 µM fatty acids (myristic acid, palmitic acid, stearic acid) and fatty acid alcohols (1-tetradecanol, 1-hexadecanol, 1-octadecanol). The resultant wax ester contents were determined and quantified by GC-MS analysis. The results are expressed as relative efficiency on the basis of myristyl myristate (C14-C14) production. Values are means of two independent experiments.
Figure 5
Figure 5
Effect of WSD2 and WSD5-double gene knock down (WSD2/5 KD) on wax ester fermentation. (A) Verification of gene silencing by RT-PCR. RT-PCR was carried out with total RNA from Euglena cells in which dsRNA was introduced. Mock cells electroporated without dsRNA. (B) Influence of WSD2/5 KD on myristyl myristate production under anaerobic conditions. Euglena cells grown to stationary phase were anaerobically treated for 24 h and then collected for wax ester measurement as described in Material and Method section. The inset shows the results for 0 h in detail. Asterisk denotes statistically significant differences (*p < 0.01) compared with mock control. Values are the mean ± SD of three independent experiments. (C) Influence of WSD2/5 KD on paramylon content and consumption under anaerobic condition. Paramylon contents were finally determined by the phenol-sulfuric acid method using glucose solution as a standard. Values are the mean ± SD of three independent experiments. (D) Influence of WSD2/5 KD on fatty acid contents under anaerobic condition. Asterisks denote statistically significant differences (**p < 0.05) compared with mock control. Values are the mean ± SD of three independent experiments.
Figure 6
Figure 6
GC-TOF/MS-based lipid profiling between mock control and WSD2/5-KD. Aerobically grown Euglena cells were placed under anaerobic conditions for 24 h. The Euglena cells were collected at 0 h and 24 h. Total lipid was extracted from the Euglena cells and dried using a centrifugal evaporator. The non-methylesterified lipid fractions prepared from the mock control and WSD2/5-KD cells were analyzed by GC-TOF/MS. Wax ester contents were determined by a GC-TOF/MS-based profiling method as described by Furuhashi et al.. (A) Representative GC-TOF/MS total ion chromatograms (TIC) of mock-control and WSD2/5-KD Euglena cells treated with anaerobic conditions for 24 h. (B) Comparison of relative amount of wax ester molecules between mock control and WSD2/5-KD. The data was processed based on the region enclosed by the dashed line. Asterisks indicate statistically significant differences between mock-control and WSD2/5-KD Euglena cells (means ± SD, n = 3; biological replicate, Student t-test, *p < 0.05).
Figure 7
Figure 7
GC-TOF/MS-based profiling of the ester-linked fatty acids and fatty alcohols. Aerobically grown Euglena cells were placed under anaerobic conditions for 24 h. The Euglena cells were collected at 0 h and 24 h. Total lipid was extracted from the Euglena cells and dried using a centrifugal evaporator. Sodium methoxide in methanol was added to the dried lipid pellet to transesterify the ester-linked lipids, followed by trimethylsilylation; then the methyl esters and the TMS derivatives were subjected to GC-TOF/MS analysis. Asterisks indicate statistically significant differences between mock-control and WSD2/5 KD cells in each time points (means ± SD, n = 3; biological replicate, Student t-test, *p < 0.05).
Figure 8
Figure 8
Comparison of GC-TOF/MS-based lipid profiling between mock-control and WSD2/5KD. The non-methylesterified lipid fractions prepared from the mock control and WSD2/5KD cells were analyzed by GC-TOF/MS. (A) Representative GC-TOF/MS total ion chromatograms (TIC) of mock-control and WSD2/5-KD Euglena cells treated with anaerobic conditions for 24 h. (B) Chromatogram enlarging the area surrounding the dashed line. Letters a-e indicate unique peaks observed in the TIC of the WSD2/5-KD at 24 h. (C) Mass spectra of the unique peaks observed in the TIC of the WSD2/5-KD at 24 h.
Figure 9
Figure 9
TLC analysis of wax ester and TAG in WSD2/5 KD cells treated anaerobically for 24 h. (A) Total lipids were extracted from mock and WSD2/5 KD cells, and separated on a Silica gel 60 plate as described in the Materials and Methods section. (B) Comparison of C14 contents consisting of TAG molecules in the mock and EgWSD2/5 KD cells. TAG spots were scraped, eluted, and trans-esterified to fatty acid methyl esters (FAME). The FAME was analyzed as the lipid compositions by GC/MS. Values are the mean ± SD of three independent experiments. Asterisks denote statistically significant differences (*p < 0.05) compared with the mock control.

Similar articles

Cited by

References

    1. Mata TM, Martins AA, Caetano NS. Microalgae for biodiesel production and other applications: A review. Renew. Sustain. Energy Rev. 2010;14:217–232. doi: 10.1016/j.rser.2009.07.020. - DOI
    1. Stephens E, et al. An economic and technical evaluation of microalgal biofuels. Nature Biotech. 2010;28:126–128. doi: 10.1038/nbt0210-126. - DOI - PubMed
    1. Hu Q, et al. Microalgal triacylglycerols as feedstocks for biofuel production: perspectives and advances. Plant J. 2008;54:621–639. doi: 10.1111/j.1365-313X.2008.03492.x. - DOI - PubMed
    1. Markou G, Nerantzis E. Microalgae for high-value compounds and biofuels production: a review with focus on cultivation under stress conditions. Biotechnol. Adv. 2013;31:1532–1542. doi: 10.1016/j.biotechadv.2013.07.011. - DOI - PubMed
    1. Inui H, Miyatake K, Nakano Y, Kitaoka S. Wax ester fermentation in Euglena gracils. FEBS Lett. 1982;150:89–93. doi: 10.1016/0014-5793(82)81310-0. - DOI - PMC - PubMed

Publication types

MeSH terms

LinkOut - more resources