. 2018 May;233(5):4137-4155.
doi: 10.1002/jcp.26219. Epub 2017 Dec 18.

Discovery and characterization of novel trans-spliced products of human polyoma JC virus late transcripts from PML patients

Affiliations

Discovery and characterization of novel trans-spliced products of human polyoma JC virus late transcripts from PML patients

A Sami Saribas et al. J Cell Physiol. 2018 May.

Abstract

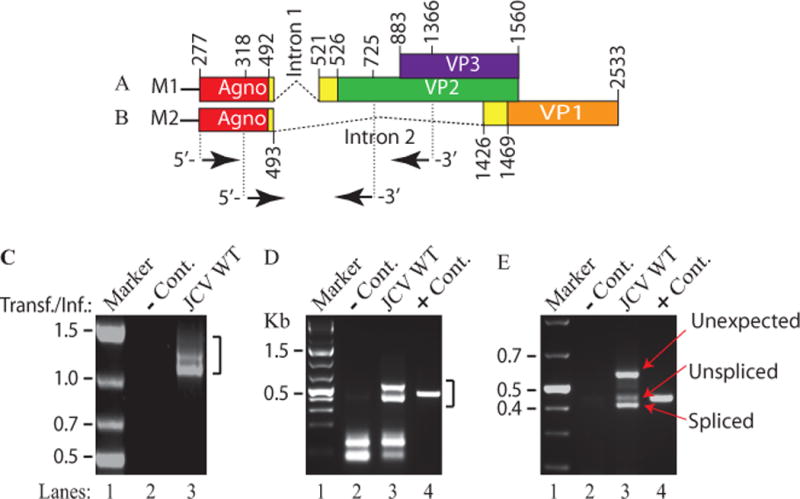
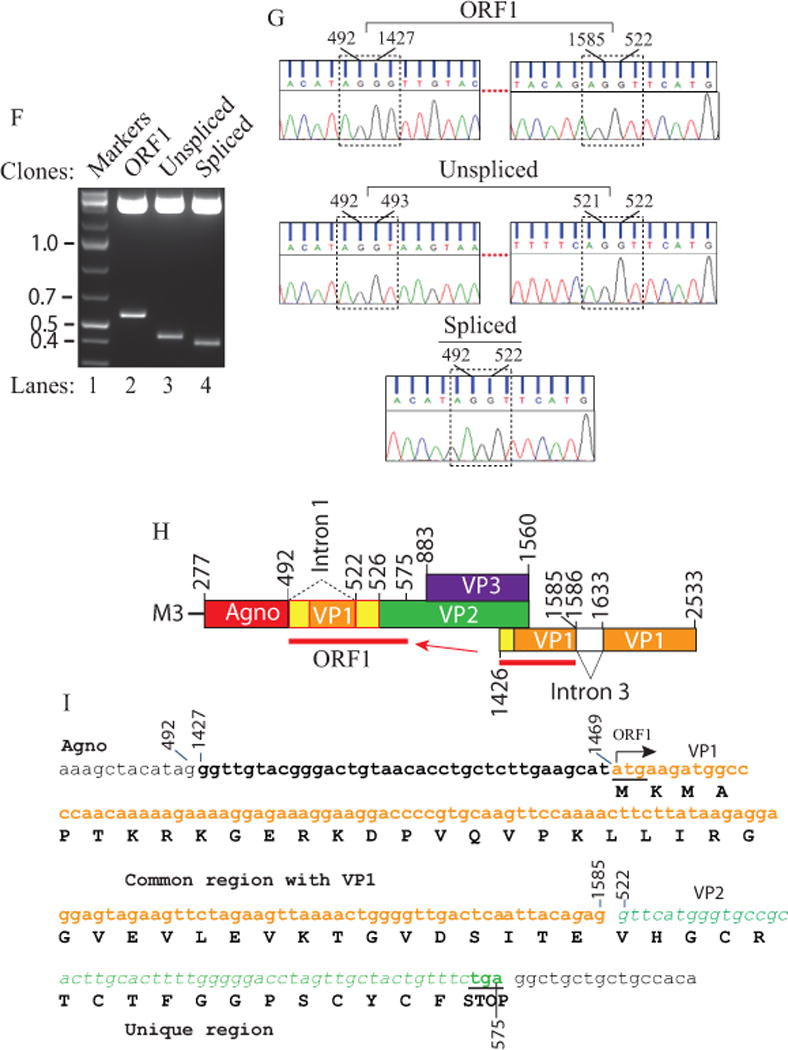
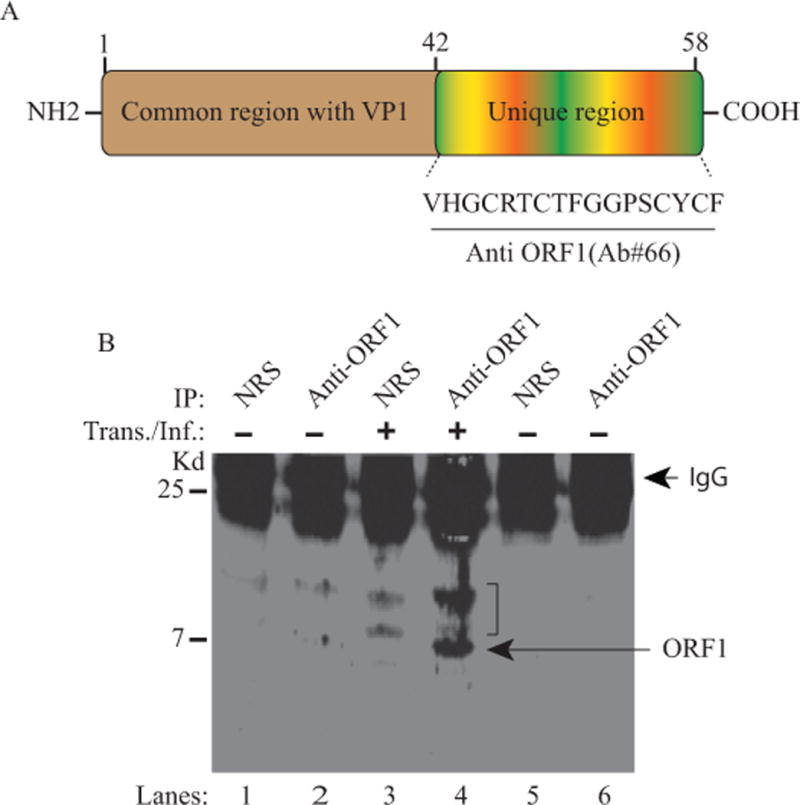
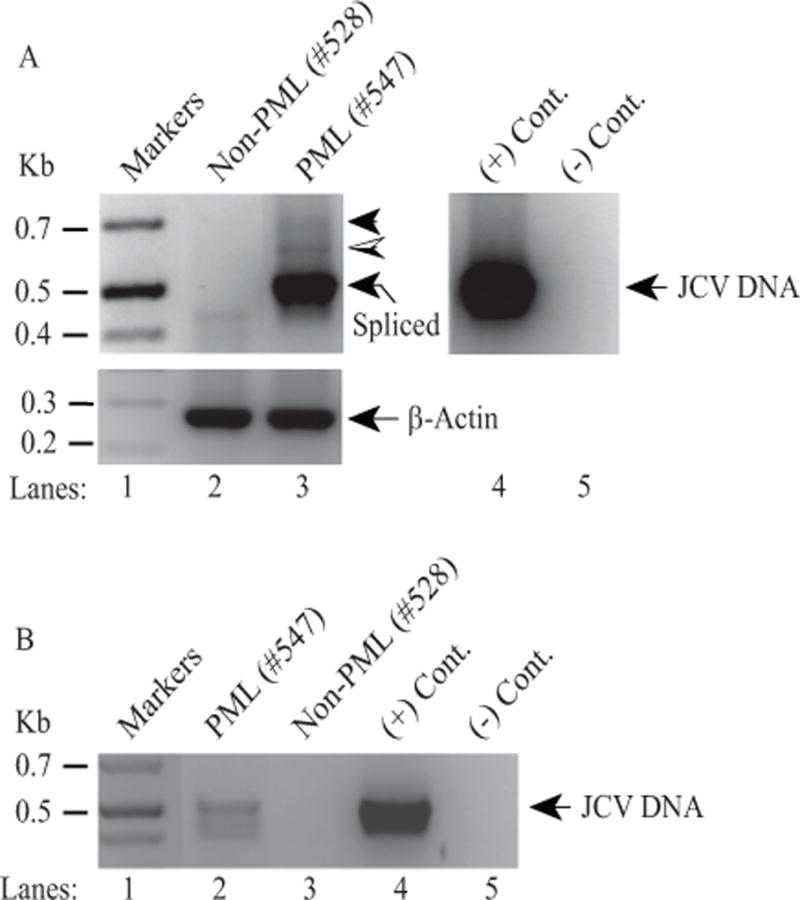
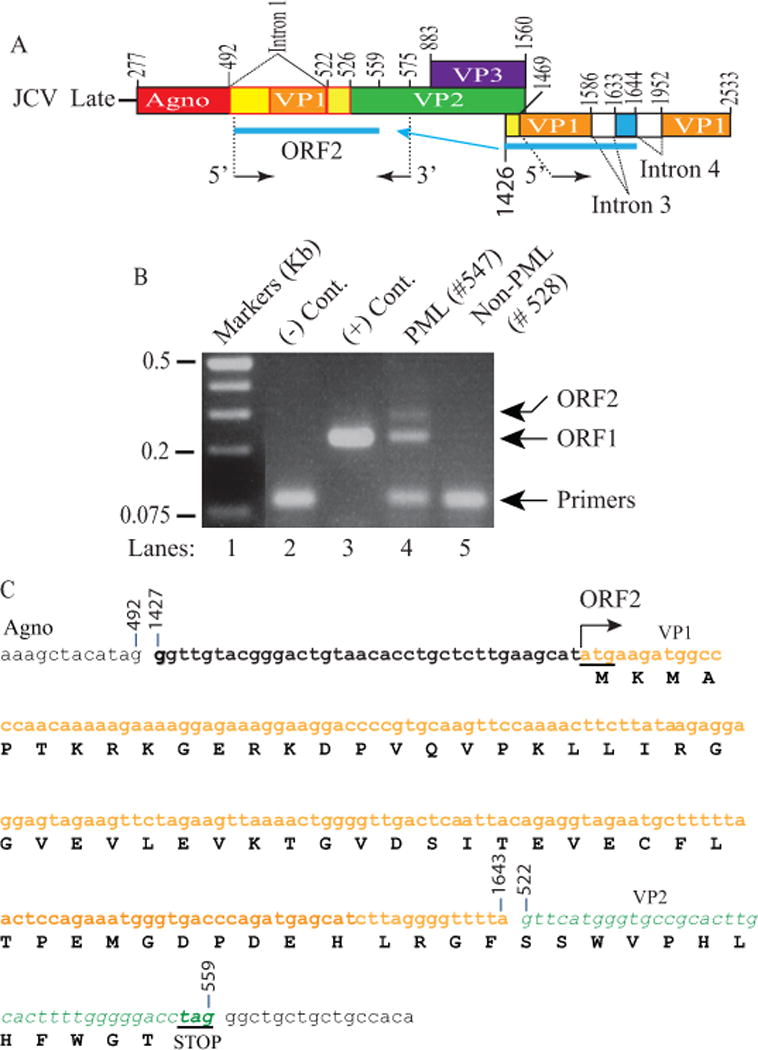
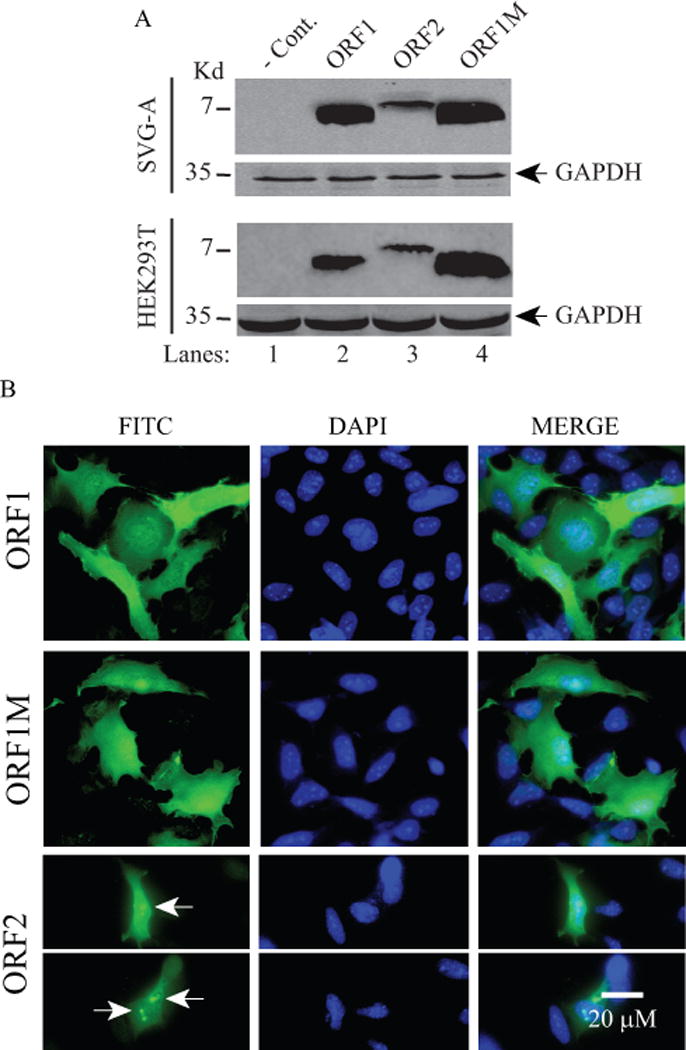
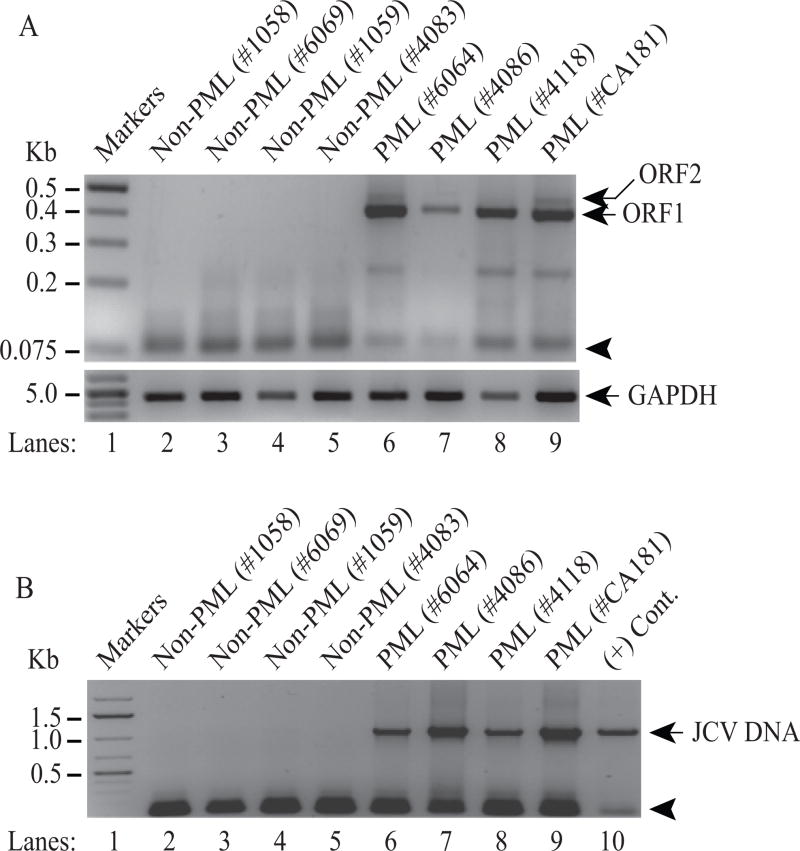
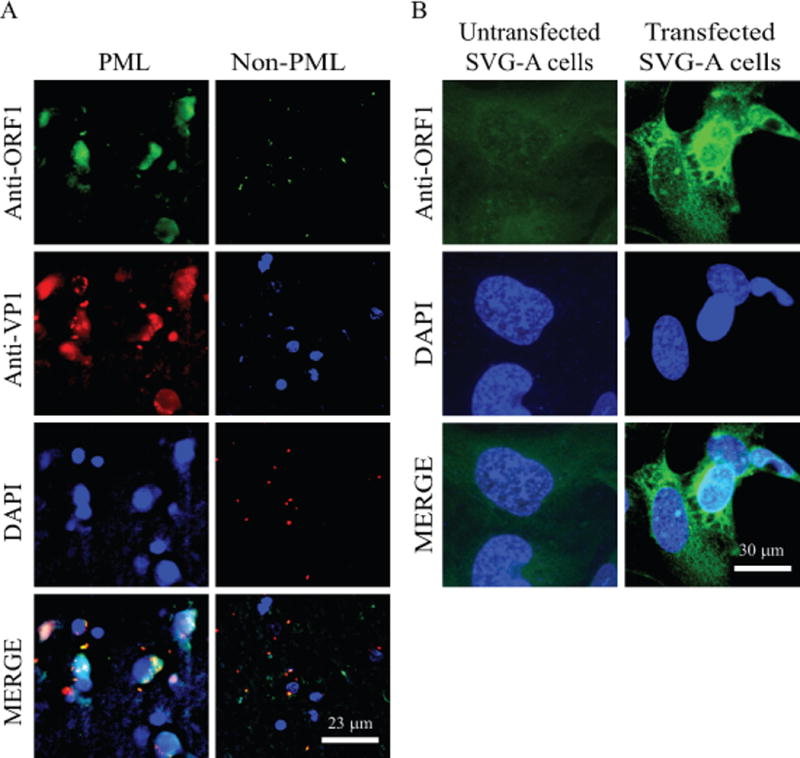
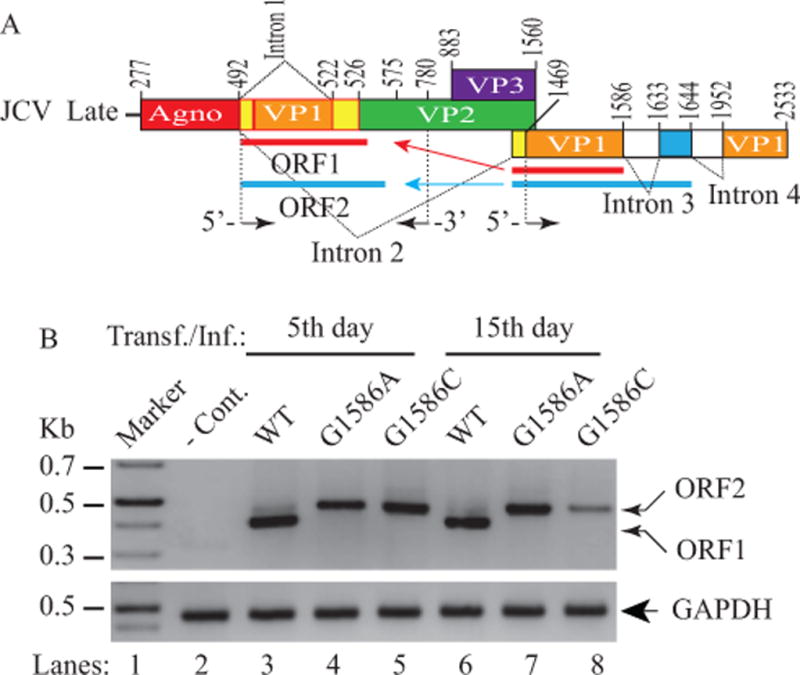
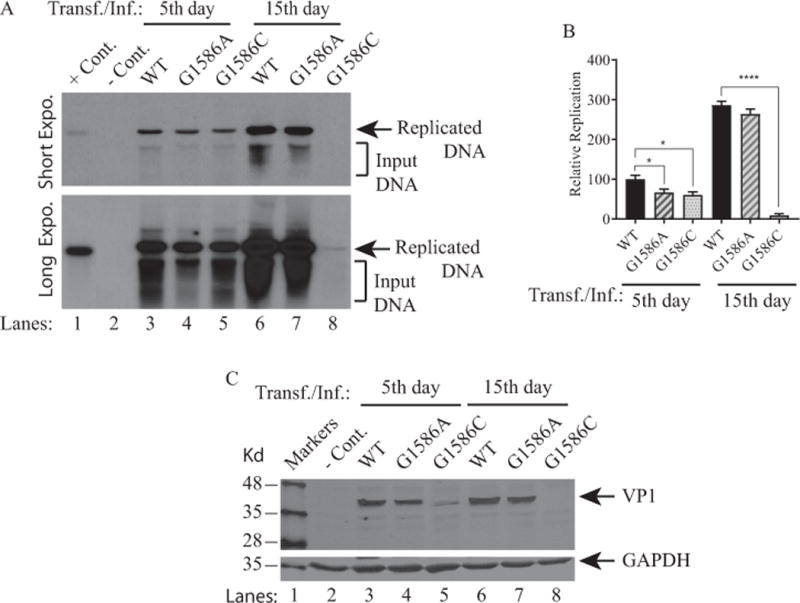
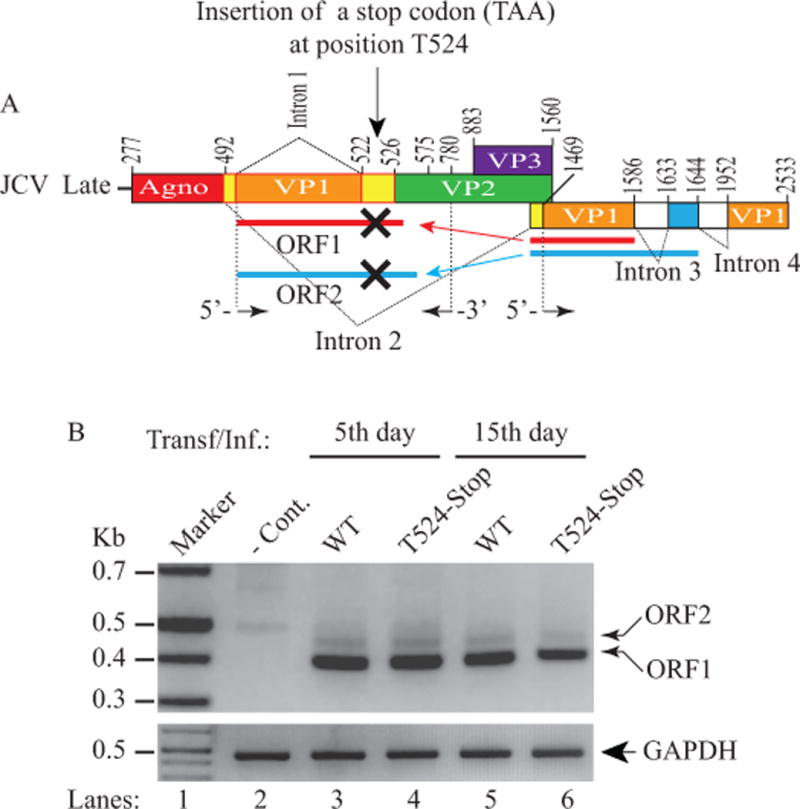
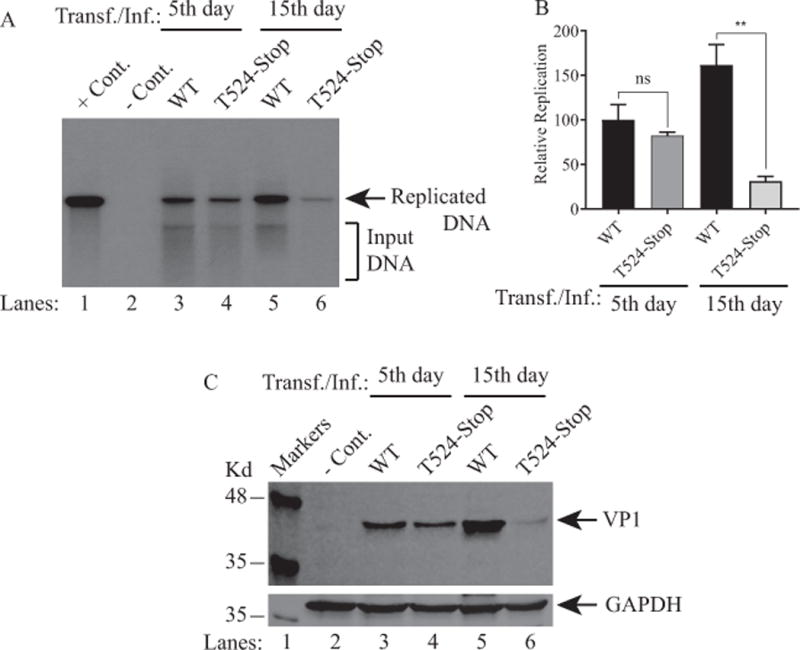
Although the human neurotropic polyomavirus, JC virus (JCV), was isolated almost a half century ago, understanding the molecular mechanisms governing its biology remains highly elusive. JCV infects oligodendrocytes and astrocytes in the central nervous system (CNS) and causes a rare fatal brain disease known as progressive multifocal leukoencephalopathy (PML) in immunocompromised individuals including AIDS. It has a small circular DNA genome (∼5 kb) and generates two primary transcripts from its early and late coding regions, producing several predicted alternatively spliced products mainly by cis-splicing. Here, we report the discovery and characterization of two novel open reading frames (ORF1 and ORF2) associated with JCV late transcripts, generated by an unusual splicing process called trans-splicing. These ORFs result from (i) the trans-splicing of two different lengths of the 5'-short coding region of VP1 between the coding regions of agnoprotein and VP2 after replacing the intron located between these two coding regions and (ii) frame-shifts occurring within the VP2 coding sequences terminated by a stop codon. ORF1 and ORF2 are capable of encoding 58 and 72 aa long proteins respectively and are expressed in infected cells and PML patients. Each ORF protein shares a common coding region with VP1 and has a unique coding sequence of their own. When the expression of the unique coding regions of ORFs is blocked by a stop codon insertion in the viral background, the mutant virus replicates less efficiently when compared to wild-type, suggesting that the newly discovered ORFs play critical roles in the JCV life cycle.

Keywords: BK virus; DNA replication; JC virus; ORF; RNA splicing; SV40; VP1; VP2; cis- and trans-splicing; merkel cell carcinoma virus; polyomavirus; progressive multifocal leukoencephalopathy; transcription.


Conflict of interest statement

CONFLICT OF INTEREST

Authors declare no conflict of interest.

Figures

Figure 1
Figure 1. RT-PCR analysis of JCV late transcripts revealed an unexpected splice product
(A) Schematic representation of the JCV Mad-1 first major late transcript (M1) prior to splicing. The position of intron 1 between nucleotides 493 and 521 (JCV Mad-1 numbering) is indicated. (B) Schematic presentation of second major JCV Mad-1 late transcript (M2) prior to splicing. The position of intron 2 between nucleotides 493 and 1426 is indicated. (C) Agarose gel analysis of the RT-PCR products from the M1 transcript with specific primers (5′-JCV Mad-1 277-303 bp region and 3′-(JCV Mad-1, 1366-1346 bp). Total RNA was isolated from SVG-A cells transfected/infected with JCV Mad-1 WT at 15th day posttransfection/infection, subjected to RT-PCR reaction as described in Materials and Methods and analyzed on an agarose gel (1.5%). A bracket points the unresolved RT-PCR products. Transf./Inf.: Transfection/Infection. Total RNA from the untransfected SVG-A cells was also subjected to RT-PCR using the same primers as a negative control (− Cont.). (D) Re-amplification of the RT-PCR products from panel C by PCR using internal primers. The RT-PCR products from the panel C were re-amplified using the following internal primers: 5′-Primer: JCV Mad-1 (318-338) and 3′-primer: JCV Mad-1 (725-701) and resolved on an agarose gel (3 %). In lane 4, PCR-amplified JCV Mad-1 sequence was used as a positive control (+ Cont.) using the same internal primers. A bracket points to the unresolved bands. (E) Further resolution of the unresolved bands shown on panel D and subcloning them for sequencing. The resolved bands, labeled as “unexpected, unspliced and spliced” bands were gel-purified using QIAquick® gel extraction kit (Qiagen, catalog no. 28704), digested with HindIII and BamHI restriction enzymes and subcloned into the pcDNA3.1 (+) vector at HindIII and BamHI sites. Finally, the clones were sequenced commercially (Genewiz,http://www.genewiz.com). (F) Analysis of the cloned fragments by restriction enzyme digestion. The clones were digested with HindIII and BamHI enzymes and analyzed on a 3% agarose gel. (G) Partial representation of the DNA sequencing data of the cloned fragments at the splice junctions. The splice junctions were encased with dashed lines and the nucleotides were numbered according to the JCV Mad-1 strain numbering. (H) Schematic representation of a trans-spliced product (159 bp) of the 5′-end of the VP1 [Mad-1 (1426-1585) region] in place of “Intron 1” and creation of the ORF1 open reading frame. (I) Representation of the ORF1 sequence (159 bp) inserted in place of Intron 1. After insertion, a frame shift occurs within VP2, which is terminated with stop codon at nucleotide position 575. The common region of ORF1 (41 aa long) with VP1 is colored orange and the unique region is colored green (17 aa long).
Figure 2
Figure 2. Detection of ORF1 expression in JCV infected cells by IP/Western
(A) Schematic representation of ORF1 protein (58 aa long). The N-terminus (aa 1-41) of ORF1 overlaps with the N-terminus of VP1 (aa 1-41) but the C-terminus of the protein is unique (aa 42-58). An anti- ORF1 polyclonal antibody was raised in a rabbit against the unique region of ORF1 and is designated as Ab#66. (B) Detection of ORF1 expression in SVG-A cells infected with JCV Mad-1 strain by immunoprecipitation followed by Western blot (IP/WB) as described in Material and Methods using Ab#66 antibody. Membranes were probed with primary anti-ORF1 (Ab#66) and secondary (goat anti-rabbit IRDye 800CW) antibodies and analyzed on an Odyssey CLx imaging system. In lanes 5 and 6, normal rabbit serum (NRS) and Ab#66 antibody respectively were immunoprecipitated and loaded as additional controls in order to demonstrate whether there is any contribution to the non-specific detection of the bands observed on lanes 1 and 2 by the degradation of the antibodies. IP: immunoprecipitation, Kd.: Kilodalton. IgG: Immunoglobulin light chain. A bracket indicates the non-specific bands detected by the primary antibody.
Figure 3
Figure 3. Detection of the ORF1-like expression in a PML brain tissue sample by RT-PCR
(A) (Upper panel) Detection of a three-banding pattern in a PML patient tissue samples by RT-PCR. Initially, PML and non-PML tissue samples were obtained from the Manhattan HIV Brain Bank and total RNA isolated from those samples was subjected to one step RT-PCR as described in Materials and Methods using JCV 5′-primer (277-302) and JCV 3′-primer (780-752) (Mad-1 numbering). A new internal 3′-primer was used in this RT-PCR to amplify relatively short fragments and therefore resolve them well on the agarose gels. The hatched and filled arrow heads indicate the possible expression of ORF1 and perhaps additional ORFs respectively. The labeled arrow points to the expected spliced product. In lane 4, JCV Mad-1 DNA was used as positive control (+ Cont.) and in lane 5, water was used as a negative control (− Cont.) in PCR reactions. (Lower panel) Total RNA was also subjected to RT-PCR using human actin primers as a control: Forward primer: Human actin (354-375) 5′-CTACAATGAGCTGCGTGTGGC-3′ and Reverse primer: Human actin (624-603) 5′-CAGGTCCAGACGCAGGATGGC-3′. (B) Detection of JCV DNA in PML tissue samples. In parallel to the panel A, JCV DNA isolated from the same PML and non-PML brain tissue samples were also amplified by PCR as described in Materials and Methods, using the same primers described for panel A.
Figure 4
Figure 4. Discovery of additional ORFs from PML brain tissue samples
(A) Schematic representation of JCV late transcript containing the ORF2 coding region. (B) RT-PCR amplification of the ORF1 coding region with specific internal primers followed by analysis of the amplified products by agarose gel (3%) electrophoresis. Total RNA isolated from SVG-A cells [uninfected (-Cont., lane 2) and infected with JCV Mad-1 genome, (+ Cont., lane 3)]; and from PML (lane 4) and non-PML (lane 5) patients were subjected to RT-PCR using the following internal primers: 5′-primer: JCV Mad-1 VP1 (1469-1481), 3′-primer: JCV Mad-1 VP2 (575-555). The RT-PCR products were gel-purified and subcloned into XbaI/BamHI sites of the pCGT7 and sequenced. The sequencing data showed that, in addition to ORF1, a longer fragment of VP1 (216 bp) was also inserted in place of Intron 1 in another splice product creating another new ORF designated as a ORF2. Sequencing data also revealed that a mutant form of ORF1 also exists in PML tissue samples, designated ORF1M where Ile23 is mutated to Met (Ile23Met). (C) Schematic representation of a trans-spliced fragment (216 bp) of the 5′-end of the VP1 [Mad-1 (1427-1643) region] in place of “Intron 1” and creation of ORF2 (72 aa). After insertion, a frame shift occurs within VP2, which is terminated with a stop codon at nucleotide position 559. The common region of ORF1 (60 aa long) with VP1 is colored in orange and the unique region is colored in green (12 aa long).
Figure 5
Figure 5. Stable expression analysis of ORF1, ORF1M and ORF2 in different cell lines by Western blotting and immunocytochemistry (ICC)
(A) Analysis of ORF1, ORF1M and ORF2 expression in SVG-A and HEK293T cells by Western blotting. These two cell lines were transfected with either vector alone (pCGT7) or the expression plasmids (pCGT7-ORF1 or ORF1M, pCGT7-ORF1M or pCGT7-ORF2). At 48 h posttransfection, whole-cell extracts (WCE) were prepared and analyzed by Western blot using primary mouse anti-T7 monoclonal and secondary goat anti-mouse IRDye 680LT antibodies as described in Materials and Methods. Each blot was also probed with anti-GAPDH antibody for control. Since the anti-ORF1 antibody (Ab#66) only detects ORF1 but not ORF2, therefore it was not used in these Western blots and ICC assays. In lane 1, WCE prepared from the untransfected (transfected with only the vector) cells were loaded as a negative control (− Cont.) (B) Analysis of the cellular distribution of ORF1, ORF1M and ORF2 proteins in SVG-A cells by ICC. In parallel to panel A, these three proteins were also examined by ICC on SVG-A cells using primary mouse anti-T7 monoclonal and secondary FITC-conjugated goat anti-mouse antibodies. Cells were also incubated with DAPI to stain the nucleus and examined under a fluorescence microscope as described in Materials and Methods. Arrows point to a more intense punctate localization patterns of ORF2 in the nucleus. Scale bar: 20 μM.
Figure 6
Figure 6. Detection of ORF1 and ORF2 transcripts in additional PML patients
(A) Additional PML and Non-PML tissue samples were obtained from the National NeuroAIDS Tissue Consortium (NNTC) and total RNA isolated from these samples were subjected to RT-PCR amplification using the following primers: 5′-primer (1469-1489) and 3′-primer (780-755) as described in Materials and Methods. RT-PCR products were then analyzed by agarose gel (3%) electrophoresis. The position of the primers used in RT-PCR is indicated by an arrow head. Total RNA isolated from the PML and non-PML patients was also subject to RT-PCR amplification of the GAPDH cDNA as a control. (B) Detection of JCV DNA in PML brain tissue samples. In parallel to the RT-PCR assays in panel A, JCV DNA was also isolated from the PML and non-PML brain tissue samples and was PCR-amplified using 5′-primer (277-302) and 3′-primer (1366-1346) and analyzed by agarose gel (1%) electrophoresis as described in Materials and Methods. An arrow head points to the position of the primers used in the PCR reaction. In lane 10, JCV Mad-1 DNA was also PCR amplified as a positive control (+ Cont.).
Figure 7
Figure 7. Analysis of the ORF1 protein expression in PML brain tissue samples by immunohistochemistry (IHC)
(A) Detection of the ORF1 expression in PML brain tissue sections by IHC. The formalin-fixed, paraffin-embedded and sectioned non-PML and PML brain tissue specimens were provided as “ready to stain” on slides by the NNTC. Samples were first probed with a combination of primary anti-ORF1 (Ab#66) rabbit polyclonal (1:200 dilution) and anti-VP1 (pAB597) monoclonal antibodies overnight. The following day, after washing the samples with PBS, they were incubated with Rhodamine-conjugated goat anti-mouse plus fluorescein isothiocyanate (FITC)-conjugated goat anti-rabbit secondary antibodies. Finally, slides were stained DAPI, mounted and examined under a fluorescence microscope as described under figure legend 5B. Scale bar: 23 μm. (B) Detection of ORF1 expression in SVG-A cells using Ab#66 antibody as a control. SVG-A cells were transfected with pCGT7-ORF1 expression plasmid on the glass-chamber slides and cells were then processed for ICC at 24 h posttransfection using primary anti-ORF1 (Ab#66) rabbit polyclonal (1:200 dilution) and secondary fluorescein isothiocyanate (FITC)-conjugated goat anti-rabbit antibodies to detect the stable expression of ORF1 protein; and examined under a fluorescence microscope as described under figure legend 5B. Scale bar: 30 μm.
Figure 8
Figure 8. Analysis of the ORF1 splice-deficient mutants
(A) Schematic representation of JCV Mad-1 late transcript illustrating the trans-splicing of the small fragments from the 5′-VP1 in place of Intron 1, which results in the formation of the ORF1 and ORF2 open reading frames. The G nucleotide at a cryptic splice donor site positioned at the nucleotide 1586 was mutated to either A or C as described in Materials and Methods. (B) RT-PCR analysis of the JCV late transcripts isolated from SVG-A cells transfected/infected with either JCV Mad-1 WT or its ORF1 splice-deficient mutants. Cells were transfected/infected with the following plasmid constructs: Bluescript KS (+)-JCV Mad-1 WT, Bluescript KS (+)-JCV Mad-1 (G1586A) and Bluescript KS (+)-JCV Mad-1 (G1586C) as described in Materials and Methods. At the indicated time points, total RNA was isolated from those cells and was subjected to RT-PCR amplification using the following primers: 5′-primer (1469-1489) and 3′-primer (780-755) as described in Materials and Methods. In lane 1, total RNA from untransfected cells was also used in RT-PCR reactions using the same primers as a negative control (− Cont.) and amplified products were then analyzed on a 3% agarose gel. The total RNA was also subjected to RT-PCR for amplification of GAPDH RNA as described for Fig. 6A.
Figure 9
Figure 9. Analysis of the replication properties of the ORF1 splice-deficient mutants
(A) SVG-A cells were either untransfected (− Cont.) or transfected/infected with Bluescript KS (+)-JCV Mad-1 WT or Bluescript KS (+) JCV Mad-1 (G1586A) or Bluescript KS (+)-JCV Mad-1 (G1586C) as described in Materials and Methods. At the indicated time points, low-molecular-weight DNA containing both input and replicated viral DNA was isolated and analyzed by Southern blot as described in Materials and Methods. This assay was repeated more than three times with independent assays and a representative data is shown here with short and long exposure (Expo.) times. In lane 1, 2 ng of JCV Mad-1 DNA was linearized by BamHI digestion and loaded as a positive control (+ Cont.). In lane 2, low-molecular-weight DNA was also isolated from the untransfected SVG-A cells, subjected to enzyme digestion as the other experimental samples and loaded as a negative control (− Cont.). (B) Quantitative analysis of the results. The band intensities for the replicated DNA on Southern blots were determined by using an Image J program (https://imagej.nih.gov/ij/); and statistically analyzed and graphed by using GraphPad Prism 7 program (https://www.graphpad.com/scientific-software/prism/). One way ANOVA was used to determine the statistical differences between WT and mutants. **** P< 0.0001 and * P< 0.0001 indicate the statistical differences between WT and mutants with respect to their replication efficiency as indicated. (C) Analysis of VP1 expression by Western blot for the ORF1 mutants. In parallel to the replication assays described in panel A, whole-cell extracts (WCE) prepared from untransfected and transfected/infected cells were resolved on a SDS-10% PAGE and blotted on a nitrocellulose membrane. The membrane was then probed with a primary monoclonal anti-VP1 (pAB597) (Saribas et al., 2013) and secondary IRDye 680 goat anti-mouse antibodies; and scanned on an Odyssey CLx imaging system. In lane 2, WCE from the untransfected cells was loaded as a negative control (− Cont.). The Western blot was also probed with anti-GAPDH antibody to demonstrate equal loading.
Figure 10
Figure 10. Analysis of the splicing efficiency of the truncated forms of the ORF1 and ORF2 mutants by RT-PCR
(A) Schematic representation of a JCV Mad-1 late transcript illustrating the insertion of a stop codon (TAA) at position after T524 (GTT524 TAA C525ATGG) to block the expression of the unique amino acid regions of both ORF1 and ORF2 proteins. (B) RT-PCR analysis of the JCV late transcripts isolated from SVG-A cells either untransfected (− Cont.) or transfected/infected with JCV Mad-1 WT or Mad-1 T524 stop mutant using the following primers: 5′-primer (1469-1489) and 3′-primer (780-755) as described in Materials and Methods. The total RNA was also subjected to RT-PCR for amplification of GAPDH RNA as described for Fig. 6A. Amplified products were then analyzed on a 3% agarose gel.
Figure 11
Figure 11. Analysis of the replication efficiency of the truncated forms of the ORF1 and ORF2 mutants
(A) SVG-A cells were either untransfected (− Cont.) or transfected/infected with Bluescript KS (+)-JCV Mad-1 WT or Bluescript KS (+) JCV Mad-1 (T524-Stop) mutant. At the indicated time points, the low-molecular-weight DNA containing both input and the replicated viral DNA was isolated and analyzed by Southern blotting as described under figure legend 9A. This assay was repeated more than three times with independent assays. A representative figure is shown here. In lane 1, 2 ng of JCV Mad-1 DNA digested and linearized by BamHI was loaded as a positive control (+ Cont.). (B) Quantitative analysis of the results. The band intensities for the replicated DNA on Southern blots were quantified and graphed as described for figure legend 9B. One way ANOVA was used to determine the statistical differences between WT and mutants. ** P< 0.0042 indicates the statistical difference between WT and the mutants with respect to their replication efficiency as indicated. NS: indicates no statistical difference. (C) Analysis of VP1 expression for both truncated mutants by Western blotting as described for Fig. 9C.

Similar articles

Cited by

References

    1. Adami G, Babiss LE. DNA template effect on RNA splicing: two copies of the same gene in the same nucleus are processed differently. EMBO J. 1991;10(11):3457–3465. - PMC - PubMed
    1. Almqvist PM, Mah R, Lendahl U, Jacobsson B, Hendson G. Immunohistochemical detection of nestin in pediatric brain tumors. The journal of histochemistry and cytochemistry: official journal of the Histochemistry Society. 2002;50(2):147–158. - PubMed
    1. Berger JR. PML in AIDS. Neurology. 1992;42(9):1845–1846. - PubMed
    1. Berger JR. Progressive Multifocal Leukoencephalopathy. Curr Treat Options Neurol. 2000;2(4):361–368. - PubMed
    1. Berger JR. Progressive multifocal leukoencephalopathy. Curr Neurol Neurosci Rep. 2007;7(6):461–469. - PubMed

Publication types

MeSH terms

LinkOut - more resources