

Reduced dietary intake of micronutrients with antioxidant properties negatively impacts muscle health in aged mice
- PMID: 29045021
- PMCID: PMC5803605
- DOI: 10.1002/jcsm.12237
Reduced dietary intake of micronutrients with antioxidant properties negatively impacts muscle health in aged mice
Abstract
Background: Inadequate intake of micronutrients with antioxidant properties is common among older adults and has been associated with higher risk of frailty, adverse functional outcome, and impaired muscle health. However, a causal relationship is less well known. The aim was to determine in old mice the impact of reduced dietary intake of vitamins A/E/B6/B12/folate, selenium, and zinc on muscle mass, oxidative capacity, strength, and physical activity (PA) over time.
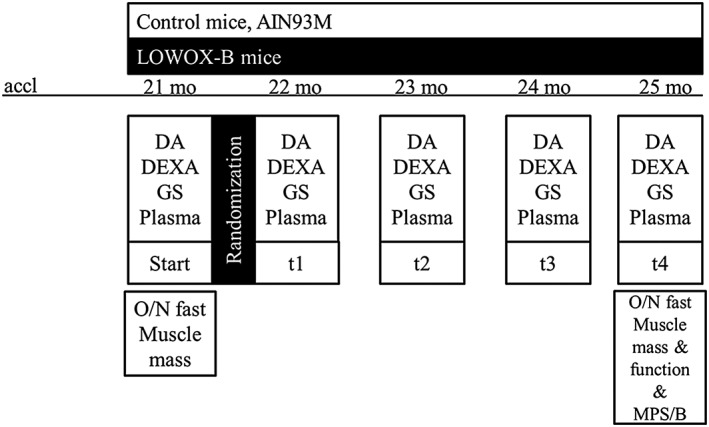
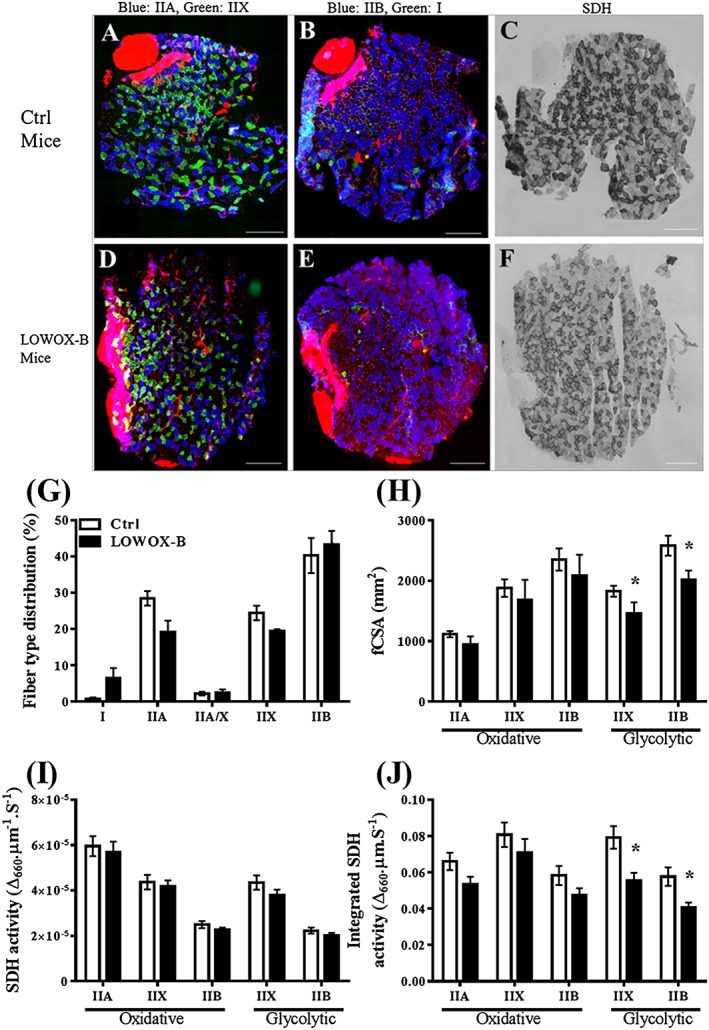
Methods: Twenty-one-month-old male mice were fed either AIN-93-M (control) or a diet low in micronutrients with antioxidant properties (=LOWOX-B: 50% of mouse recommended daily intake of vitamins A, E, B6, and B12, folate, selenium, and zinc) for 4 months. Muscle mass, grip strength, physical activity (PA), and general oxidative status were assessed. Moreover, muscle fatigue was measured of m. extensor digitorum longus (EDL) during an ex vivo moderate exercise protocol. Effects on oxidative capacity [succinate dehydrogenase (SDH) activity], muscle fibre type, number, and fibre cross-sectional area (fCSA) were assessed on m. plantaris (PL) using histochemistry.
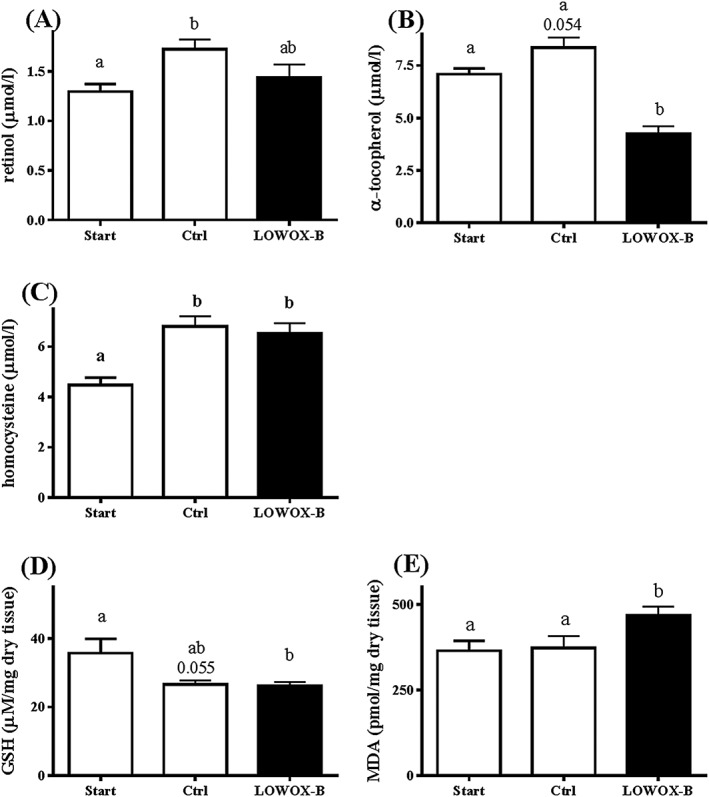
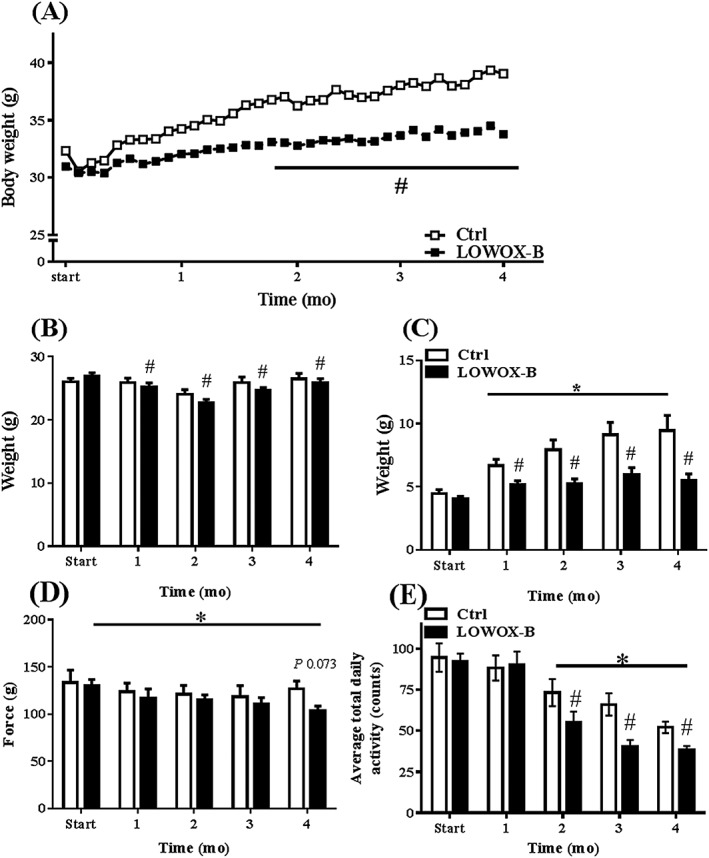
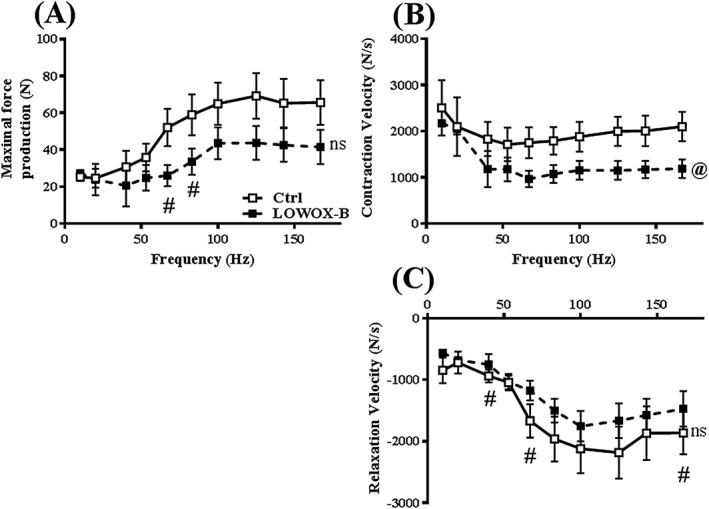
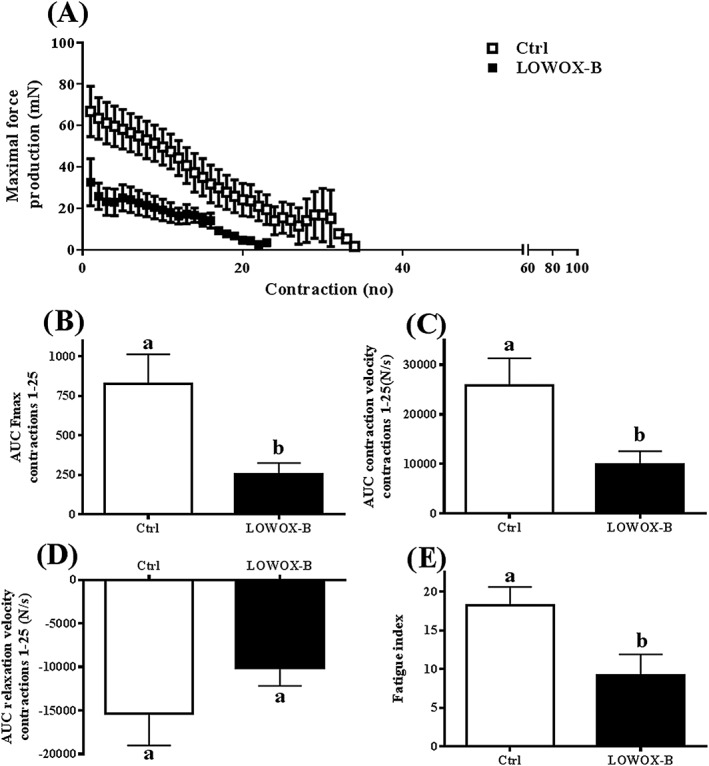
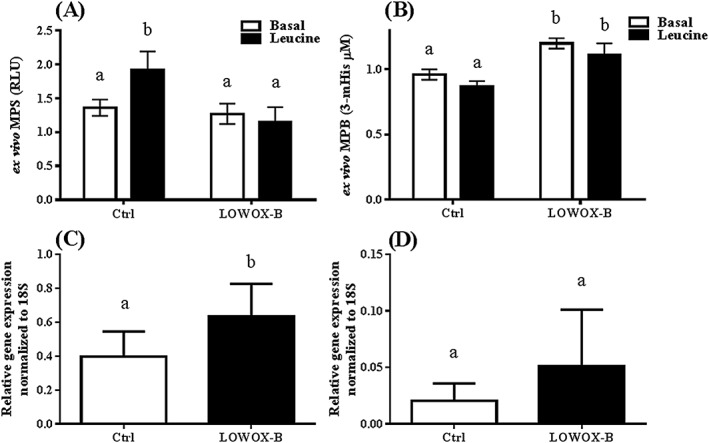
Results: After 2 months on the diet, bodyweight of LOWOX-B mice was lower compared with control (P < 0.0001), mainly due to lower fat mass (P < 0.0001), without significant differences in food intake. After 4 months, oxidative status of LOWOX-B mice was lower, demonstrated by decreased vitamin E plasma levels (P < 0.05) and increased liver malondialdehyde levels (P = 0.018). PA was lower in LOWOX-B mice (P < 0.001 vs. control). Muscle mass was not affected, although PL-fCSA was decreased (~16%; P = 0.028 vs. control). SDH activity and muscle fibre type distribution remained unaffected. In LOWOX-B mice, EDL force production was decreased by 49.7% at lower stimulation frequencies (P = 0.038), and fatigue resistance was diminished (P = 0.023) compared with control.
Conclusions: Reduced dietary intake of vitamins A, E, B6, and B12, folate, selenium, and zinc resulted in a lower oxidative capacity and has major impact on muscle health as shown by decreased force production and PA, without effects on muscle mass. The reduced fCSA in combination with similar SDH activity per fibre might explain the reduced oxidative capacity resulting in the increased fatigue after exercise in LOWOX-B mice.
Keywords: Antioxidants; Function; Muscle quality; Nutrition; Strength.
© 2017 The Authors. Journal of Cachexia, Sarcopenia and Muscle published by John Wiley & Sons Ltd on behalf of the Society on Sarcopenia, Cachexia and Wasting Disorders.
Figures
Similar articles
-
Improved muscle function and quality after diet intervention with leucine-enriched whey and antioxidants in antioxidant deficient aged mice.Oncotarget. 2016 Apr 5;7(14):17338-55. doi: 10.18632/oncotarget.7800. Oncotarget. 2016. PMID: 26943770 Free PMC article.
-
Colorectal cancer protective effects and the dietary micronutrients folate, methionine, vitamins B6, B12, C, E, selenium, and lycopene.Nutr Cancer. 2006;56(1):11-21. doi: 10.1207/s15327914nc5601_3. Nutr Cancer. 2006. PMID: 17176213
-
Nutrition Assessment of B-Vitamins in Highly Active and Sedentary Women.Nutrients. 2017 Mar 26;9(4):329. doi: 10.3390/nu9040329. Nutrients. 2017. PMID: 28346362 Free PMC article.
-
Diet and obstructive lung diseases.Epidemiol Rev. 2001;23(2):268-87. doi: 10.1093/oxfordjournals.epirev.a000806. Epidemiol Rev. 2001. PMID: 12192737 Review.
-
Monitoring micronutrients in cigarette smokers.Clin Chim Acta. 2007 Feb;377(1-2):14-38. doi: 10.1016/j.cca.2006.08.028. Epub 2006 Sep 1. Clin Chim Acta. 2007. PMID: 17045981 Review.
Cited by
-
Vitamin B12 status and skeletal muscle function among elderly: A literature review and pilot study on the effect of oral vitamin B12 supplementation in improving muscle function.Aging Med (Milton). 2024 Aug 17;7(4):480-489. doi: 10.1002/agm2.12346. eCollection 2024 Aug. Aging Med (Milton). 2024. PMID: 39234201 Free PMC article.
-
Associations of fat-soluble micronutrients and redox biomarkers with frailty status in the FRAILOMIC initiative.J Cachexia Sarcopenia Muscle. 2019 Dec;10(6):1339-1346. doi: 10.1002/jcsm.12479. Epub 2019 Aug 21. J Cachexia Sarcopenia Muscle. 2019. PMID: 31436047 Free PMC article.
-
Nutritional Interventions for Treating Cancer-Related Fatigue: A Qualitative Review.Nutr Cancer. 2019;71(1):21-40. doi: 10.1080/01635581.2018.1513046. Epub 2019 Jan 26. Nutr Cancer. 2019. PMID: 30688088 Free PMC article. Review.
-
Association of folate levels with all-cause and cause-specific mortality in patients with arthritis.Clin Rheumatol. 2025 Mar;44(3):953-968. doi: 10.1007/s10067-025-07337-8. Epub 2025 Jan 24. Clin Rheumatol. 2025. PMID: 39853557
-
Cross-Sectional Associations Between Dietary Antioxidant Vitamins C, E and Carotenoid Intakes and Sarcopenic Indices in Women Aged 18-79 Years.Calcif Tissue Int. 2020 Apr;106(4):331-342. doi: 10.1007/s00223-019-00641-x. Epub 2019 Dec 7. Calcif Tissue Int. 2020. PMID: 31813016 Free PMC article.
References
-
- Semba RD, et al. Low serum micronutrient concentrations predict frailty among older women living in the community. J Gerontol A Biol Sci Med Sci 2006;61:594–599. - PubMed
-
- Inzitari M, et al. Nutrition in the age‐related disablement process. J Nutr Health Aging 2011;15:599–604. - PubMed
-
- Bischoff‐Ferrari HA. Relevance of vitamin D in muscle health. Rev Endocr Metab Disord 2012;13:71–77. - PubMed
-
- Marshall TA, et al. Inadequate nutrient intakes are common and are associated with low diet variety in rural, community‐dwelling elderly. J Nutr 2001;131:2192–2196. - PubMed
MeSH terms
Substances
LinkOut - more resources
Full Text Sources
Other Literature Sources
Medical
