. 2018 May;18(5):1096-1109.
doi: 10.1111/ajt.14544. Epub 2017 Nov 23.

Outside-in HLA class I signaling regulates ICAM-1 clustering and endothelial cell-monocyte interactions via mTOR in transplant antibody-mediated rejection

Affiliations

Outside-in HLA class I signaling regulates ICAM-1 clustering and endothelial cell-monocyte interactions via mTOR in transplant antibody-mediated rejection

Sahar Salehi et al. Am J Transplant. 2018 May.

Abstract

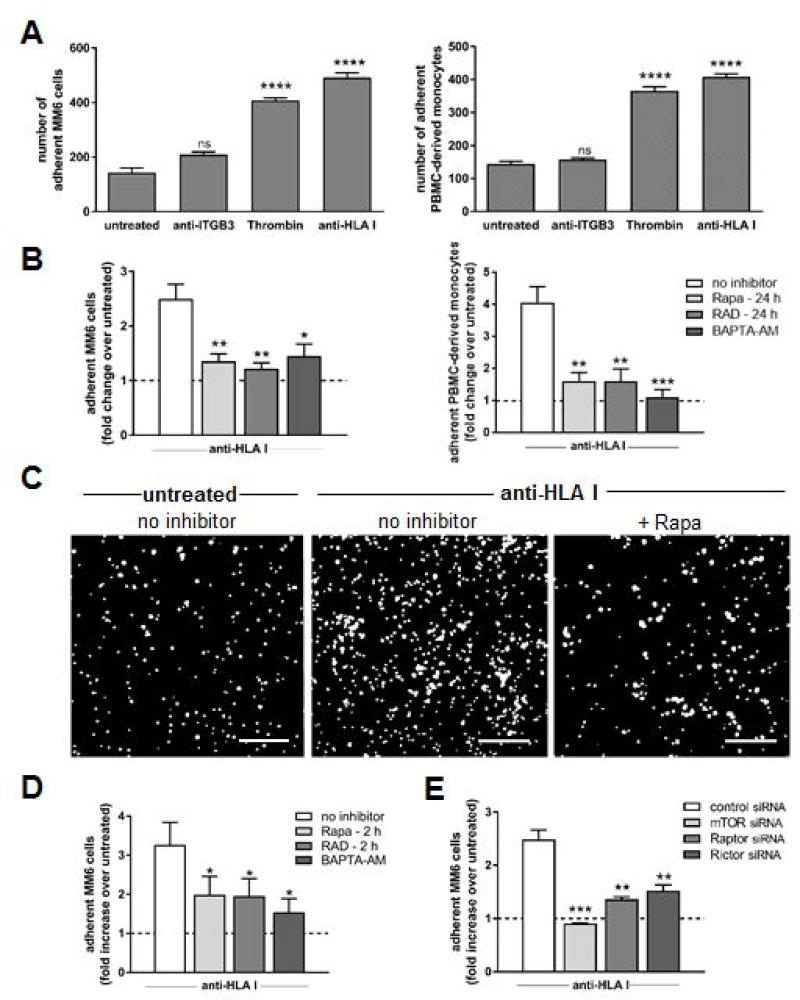
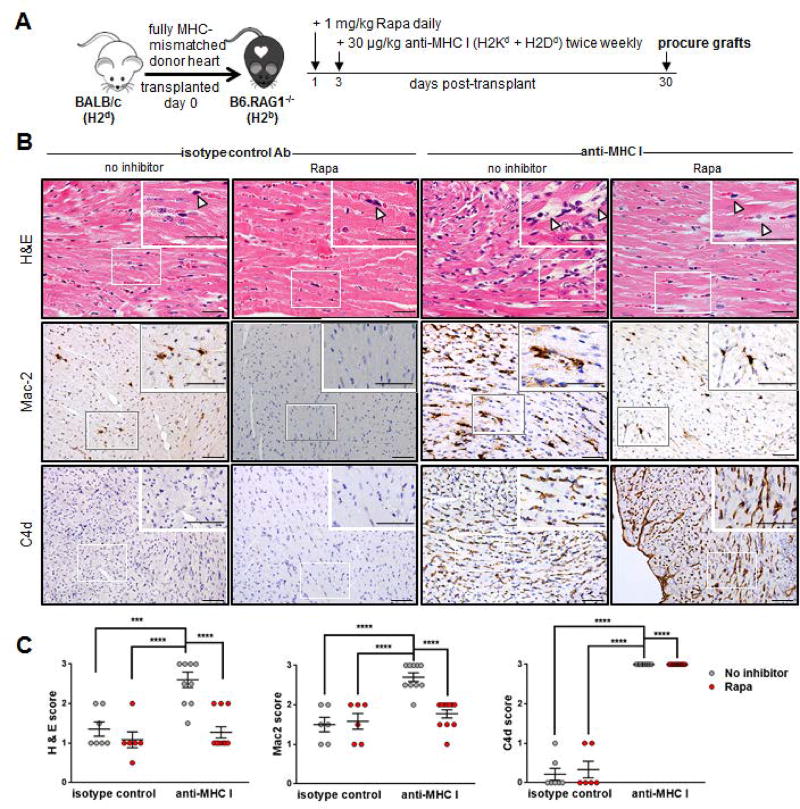
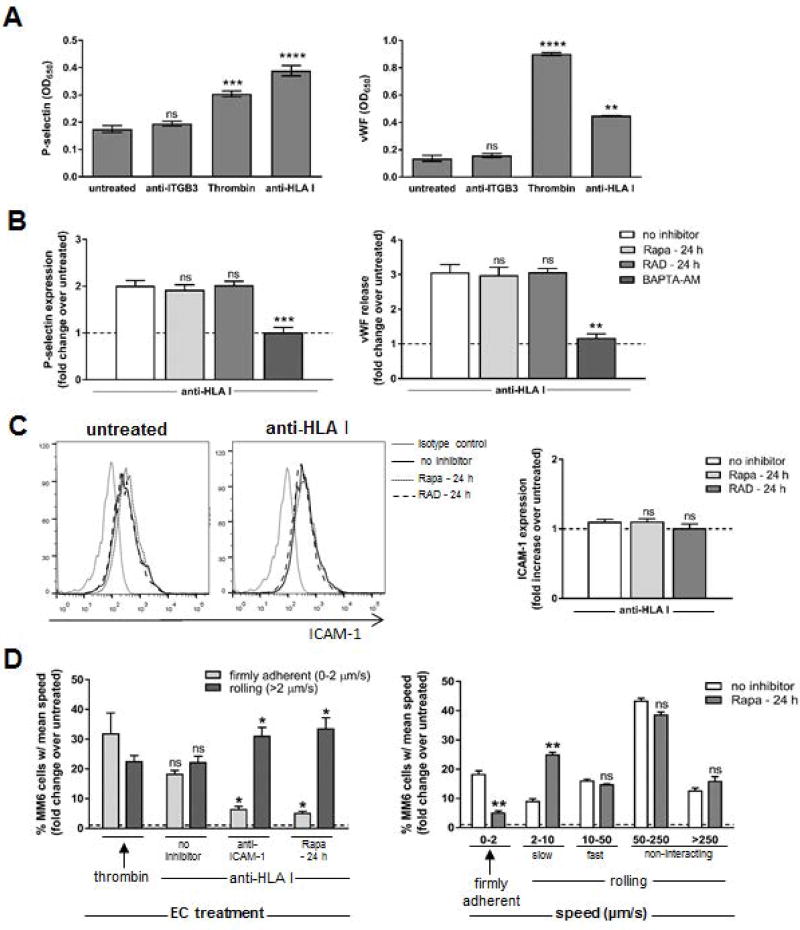
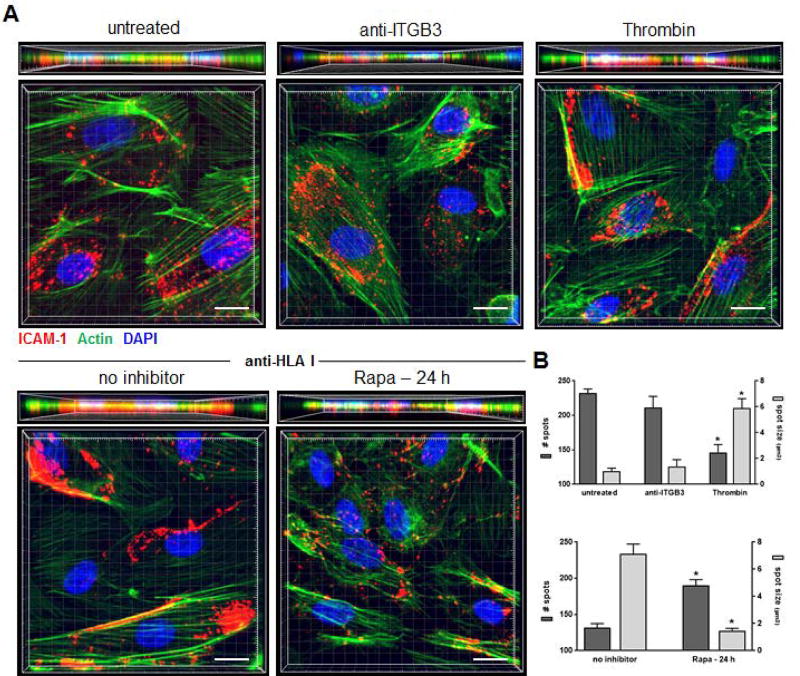
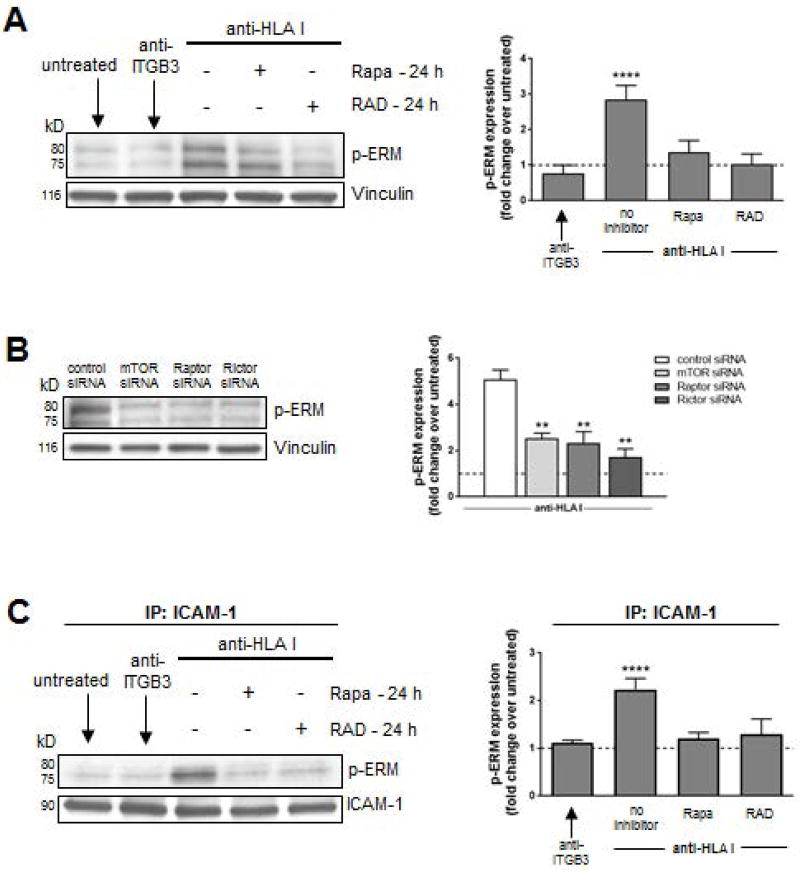
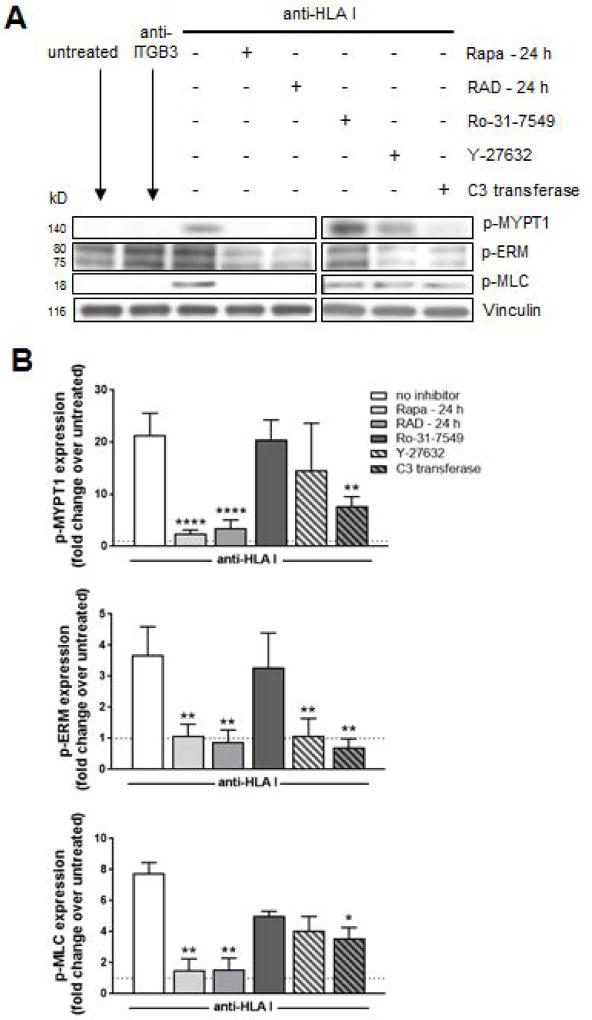
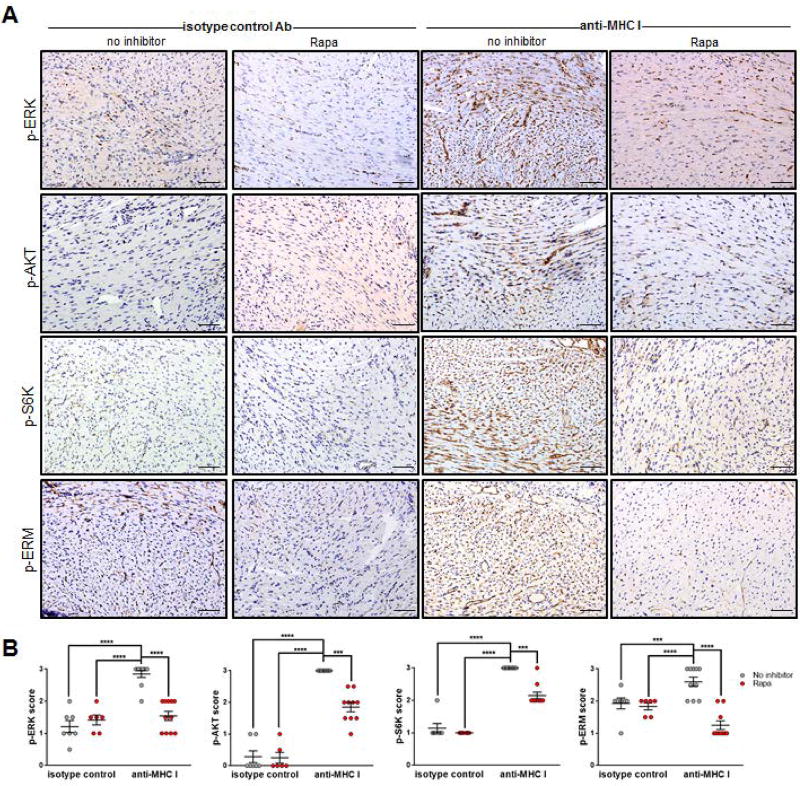
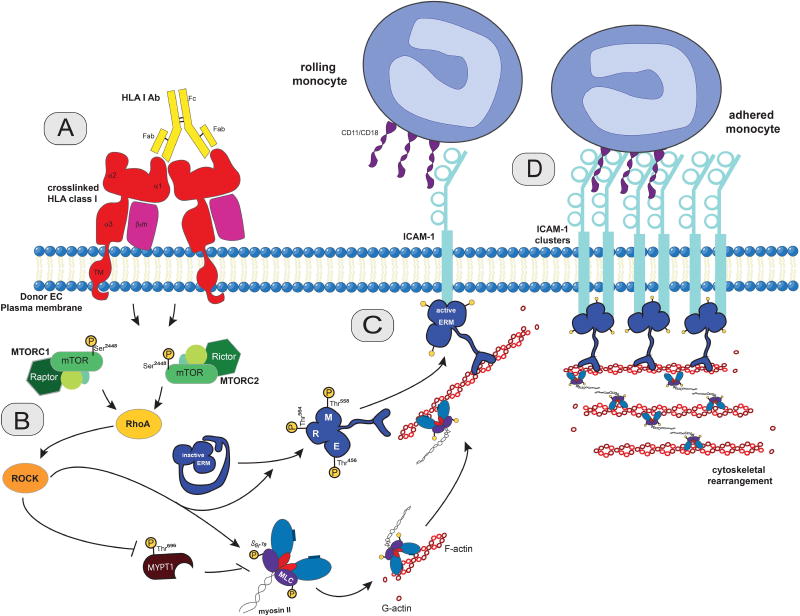
Antibody-mediated rejection (AMR) resulting in transplant allograft vasculopathy (TAV) is the major obstacle for long-term survival of solid organ transplants. AMR is caused by donor-specific antibodies to HLA, which contribute to TAV by initiating outside-in signaling transduction pathways that elicit monocyte recruitment to activated endothelium. Mechanistic target of rapamycin (mTOR) inhibitors can attenuate TAV; therefore, we sought to understand the mechanistic underpinnings of mTOR signaling in HLA class I Ab-mediated endothelial cell activation and monocyte recruitment. We used an in vitro model to assess monocyte binding to HLA I Ab-activated endothelial cells and found mTOR inhibition reduced ezrin/radixin/moesin (ERM) phosphorylation, intercellular adhesion molecule 1 (ICAM-1) clustering, and monocyte firm adhesion to HLA I Ab-activated endothelium. Further, in a mouse model of AMR, in which C57BL/6. RAG1-/- recipients of BALB/c cardiac allografts were passively transferred with donor-specific MHC I antibodies, mTOR inhibition significantly reduced vascular injury, ERM phosphorylation, and macrophage infiltration of the allograft. Taken together, these studies indicate mTOR inhibition suppresses ERM phosphorylation in endothelial cells, which impedes ICAM-1 clustering in response to HLA class I Ab and prevents macrophage infiltration into cardiac allografts. These findings indicate a novel therapeutic application for mTOR inhibitors to disrupt endothelial cell-monocyte interactions during AMR.

Keywords: alloantibody; animal models: murine; basic (laboratory) research/science; cellular biology; immunosuppressant - mechanistic target of rapamycin (mTOR); immunosuppression/immune modulation; macrophage/monocyte biology; organ transplantation in general; translational research/science; vasculopathy.


Conflict of interest statement

DISCLOSURE

The authors of this manuscript have conflicts of interest to disclose as described by the American Journal of Transplantation. EFR received funding for this research through the Pfizer Arts grant. The other authors have no conflicts of interest to disclose.

Figures

Figure 1
Figure 1. Monocyte adherence to HLA class I Ab-stimulated endothelium is suppressed when the mTOR pathway is inhibited in ECs
Primary endothelial cells (ECs) were stimulated with Ab against Integrin β3 (anti-ITGB3), HLA class I (anti-HLA I; clone W6/32) or thrombin for 5 min. CFSE-labeled MonoMac6 (MM6 cells) or human monocytes enriched from third-party peripheral blood (PBMC-derived monocytes) were pre-treated with polyclonal human IgG to block FcγR interactions, then allowed to adhere to ECs for 20 min, then un-adhered monocytes were washed off and adherent monocytes in 8–10 fields were imaged and quantified. (A) Shown are mean numbers of MM6 cells (left panel) or PBMC-derived monocytes (right panel) adherent to treated ECs over untreated ECs ± SEM from five independent experiments. ****P<0.0001, ns=not significant when comparing treated ECs to untreated ECs by two-way ANOVA with Tukey’s multiple comparisons test (B) ECs were pre-treated with Rapa, RAD or no inhibitor for 24 h, or BAPTA-AM for 30 min before monocytes were allowed to adhere. Shown are fold changes in mean number of MM6 cells (left panel) or PBMC-derived monocytes (right panel) adherent to treated ECs over untreated control ECs (dotted line) ± SEM from five independent experiments. *P<0.05, **P<0.01, ***P<0.001 for ECs given the indicated inhibitor to ECs given no inhibitor by two-way ANOVA with Tukey’s multiple comparisons test (C) Representative images showing CFSE-labeled MM6 cells adherent to the endothelial monolayer following indicated treatment. scale bars = 100 µm (D) ECs were pre-treated with no inhibitor, Rapa or RAD for 2 h (targets mTORC1 or 2 respectively), or BAPTA-AM for 30 min before MM6 cells were allowed to adhere. Shown are fold changes in mean numbers of MM6 cells adherent to treated ECs over untreated control ECs (dotted line) ± SEM from five independent experiments. *P<0.05 for ECs given the indicated inhibitor to ECs given no inhibitor by two-way ANOVA with Tukey’s multiple comparisons test (E) ECs were pre-treated with control siRNA or siRNA directed against mTOR, Raptor (mTORC1), or Rictor (mTORC2) before MM6 cells were allowed to adhere. Shown are fold changes in numbers of MM6 cells adherent to treated ECs over untreated control ECs (dotted line) ± SEM from five independent experiments. **P<0.01, ***P<0.001 for ECs given the indicated siRNA to ECs given no siRNA by two-way ANOVA with Tukey’s multiple comparisons test
Figure 2
Figure 2. Rapamycin treatment ameliorates acute injury by blocking monocyte recruitment in a murine model of cardiac antibody mediated rejection
(A) BALB/c cardiac allografts were transplanted into B6.RAG1−/− recipients and passively transfused with 30 µg/kg anti-MHC I (anti-H2Kd + anti-H2Dd) mAb or isotype control mAb biweekly beginning 3 days post-transplant. Rapa treatment at 1mg/kg/daily was initiated 1 day post-transplant. (B) Grafts were procured at day 30 post-transplant and evaluated for microvascular abnormalities by H&E, as well as intravascular activated mononuclear cells and/or complement deposition by immunohistochemical staining for MAC2 or C4d respectively. Arrow heads in top row indicate prominent nuclei of cells in distended capillaries of anti-MHC I-treated animals that was not seen in the anti-MHC I group treated with Rapa, or either group that received control mIgG mAb where arrow heads indicate flat, thin nuclei in collapsed capillaries. scale bars = 50 µm (C) Shown are mean scores ± SEM for n≥6 per group with each dot representing one animal. *P<0.05; **P<0.01; ***P<0.001; ****P<0.0001 by two-way ANOVA with Tukey’s multiple comparisons test.
Figure 3
Figure 3. mTOR regulates ICAM-1-induced firm adhesion of monocytes to HLA class I Ab-stimulated ECs
Primary endothelial cells (ECs) were pre-treated with Rapa, RAD or no inhibitor for 24 h, or BAPTA-AM for 30 min before they were stimulated with Ab against Integrin β3 (anti-ITGB3), HLA I (anti-HLA I; clone W6/32) or thrombin for 5 min. (A) EC P-selectin expression was detected by cell-based ELISA, and EC-release of von Willebrand Factor (vWF) was assessed by ELISA of supernatant. Shown are the average optical density values (OD650) ± SEM from 5 independent experiments. ***P<0.001, ****P<0.0001, ns=not significant when comparing treated ECs to untreated ECs by two-way ANOVA with Tukey’s multiple comparisons test (B) ECs were pre-treated with no inhibitor, Rapa or RAD for 24 h, or BAPTA-AM for 30 min. EC P-selectin expression was detected by cell-based ELISA, and EC-release of vWF was assessed by ELISA of supernatant. Shown are the mean fold change of protein expression from treated ECs over untreated ECs (dotted line) ± SEM from 5 independent experiments. ***P<0.001, ns=not significant when comparing ECs given the indicated inhibitor to ECs given no inhibitor by two-way ANOVA with Tukey’s multiple comparisons test (C) ICAM-1 expression was detected by flow cytometry. Shown is representative histograms and mean fold increase in ICAM-1 positive cells in each condition over untreated cells (dotted line on graph) from 2 independent experiments. ns=not significant when comparing ECs given the indicated inhibitor to ECs given no inhibitor by one-way ANOVA with Tukey’s multiple comparisons test (D) MM6 cells were pre-treated with polyclonal human IgG to block FcγR interactions, perfused at 1 dynes/cm2 over an endothelial monolayer pre-treated with Rapa for 24 h, then anti-ICAM-1 neutralizing Ab for 30 min then stimulated with anti-HLA I for 30 min. Three 5–10s videos (Videos S1–3) were collected in real-time for each condition, and mean velocity (mm/sec) of each MM6 cell over video duration was determined using ImarisTrack. Shown are average percentages of total MM6 cells observed with each indicated speed ± SEM from 5 independent experiments *P<0.05, ns=not significant by two-way ANOVA with Tukey’s multiple comparisons test (left panel) or **P<0.01; ***P<0.001, when comparing ECs treated with Rapa to ECs left untreated by Student’s T test (right panel).
Figure 4
Figure 4. mTOR is required for ICAM-1 clustering in HLA class I Ab-activated ECs
Primary endothelial cells (ECs) were pre-treated with Rapa or no inhibitor for 24 h, before they were stimulated with Ab against Integrin β3 (anti-ITGB3), HLA I (anti-HLA I; clone W6/32) or thrombin for 5 min, then CFSE-labeled MM6 cells were allowed to adhere for 20 min. ECs were stained by immunofluorescence for ICAM-1 (red), as well as Phalloidin for actin filaments (green) and DAPI to detect cell nuclei (blue). (A) Shown are representative three-dimensional volumetric confocal images of ECs following indicated treatments. scale bars=10 µm. (B) Imaris 3D analysis software was used to quantify ICAM-1 clustering. Shown are the number of individual spots per cell detected in the red channel as well as their size, and results are expressed as the mean number of spots or mean three-dimensional size (µm3) ± SEM of each treated group over untreated ECs (n≥30 cells per group). *P<0.05 by unpaired two-tailed Student’s t test.
Figure 5
Figure 5. ERM phosphorylation is impaired by mTOR inhibition in HLA class I Ab-activated ECs
ECs were pre-treated with Rapa or RAD for 24 h and stimulated with HLA I Ab (anti-HLA I; clone W6/32) for 10 min. (A) Cells were lysed and proteins were separated by SDS–PAGE followed by immunoblotting to detect phosphorylated EzrThr456/RadThr564/MoesThr558 (p-ERM) as well as Vinculin to confirm equal loading of proteins and were quantified by densitometry scan analysis using ImageJ. Results are expressed as the mean fold increase in p-ERM expression over untreated ECs ± SEM over 3 independent experiments. (B) ECs were transfected with either control siRNA, or siRNA directed against mTOR, Raptor (MTORC1), or Rictor (MTORC2) before treatment with anti-HLA I for 10 min. Cells were lysed after 48 h and proteins were separated by SDS–PAGE followed by immunoblotting to detect p-ERM as well as anti-Vinculin mAb to confirm equal loading of proteins and were quantified by densitometry scan analysis using ImageJ. Results are expressed as the mean fold increase in p-ERM expression over untreated ECs ± SEM over 3 independent experiments. (C) ECs were pretreated with Rapa or RAD for 24 h and stimulated with anti-HLA I for 10 min. Cells lysates were immunoprecipitated (IP) with anti-ICAM-1 followed by immunoblotting to detect p-ERM as above. Results are expressed as the mean fold increase in p-ERM expression over untreated ECs ± SEM over 3 independent experiments. **P<0.01; ****P<0.0001 by two-way ANOVA with Tukey’s multiple comparisons test.
Figure 6
Figure 6. mTOR regulates HLA class I Ab-induced ERM phosphorylation through the Rho pathway
ECs were pretreated with Rapa or RAD for 24 h, or Ro-31-7549 (PKC inhibitor), Y-27632 (ROCK inhibitor), or U0126 (C3 transferase; Rho inhibitor) for 4 h, then stimulated with HLA I Ab (anti-HLA I; clone W6/32) for 10 min. (A) Cells were lysed and proteins were separated by SDS–PAGE followed by immunoblotting to detect phosphorylated MYPT1Thr696 (p-MYPT1), p-ERM, and phosho-MLCSer19 (p-MLC), as well as Vinculin to confirm equal loading of proteins. Images from different parts of the same gel are separated by boxes. (B) Protein bands were quantified by densitometry scan analysis using ImageJ and results are expressed as the mean fold increase in phosphorylation above untreated with and without the indicated inhibitor ± SEM over 3 independent experiments. *P<0.05; **P<0.01; ****P<0.0001 by two-way ANOVA with Tukey’s multiple comparisons test.
Figure 7
Figure 7. Rapamycin treatment inhibits activation of anti-HLA class I mAb-induced mTOR signaling proteins in vivo
BALB/c cardiac allografts were transplanted into B6.RAG1−/− recipients, passively transfused with anti-MHC I or isotype control and treated with daily Rapa before immunohistochemical analysis of proteins involved in MHC I-induced cell survival/proliferation pathways. (A) Grafts were procured at day 30 post-transplant and evaluated for p-ERK, p-AKT, p-S6K and/or p-ERM expression by immunohistochemical staining. All phosphorylated proteins are visible in cardiac vessels and endocardium (dark brown) in cardiac vessels and endocardium. scale bars = 50 µm (C) Shown are mean scores ± SEM for n≥6 per group with each dot representing one animal. *P<0.05; **P<0.01; ***P<0.001; ****P<0.0001 by two-way ANOVA with Tukey’s multiple comparisons test.
Figure 8
Figure 8. Proposed model of outside-in HLA class I-mediated regulation of ICAM-1 clustering and EC-monocyte interactions via mTOR in transplant antibody-mediated rejection
(A) Antibody-ligation and cross-linking of HLA class I molecules on the surface of ECs initiates outside-in signaling. (B) HLA class I cross-linking triggers mTOR complex 1 (MTORC1) and complex 2 (MTORC2) signaling and downstream activation of Rho to phosphorylate ERM (p-ERM) (C) p-ERM physically associates with both the cytoskeleton (via its F-actin binding site) and ICAM-1 (via its N-terminal FERM domain). (D) This physical association results in ICAM-1 clustering at the surface of ECs and monocyte firm adhesion to ECs.

Similar articles

Cited by

References

    1. Colvin RB. Antibody-mediated renal allograft rejection: Diagnosis and pathogenesis. Journal of the American Society of Nephrology. 2007;18(4):1046–1056. - PubMed
    1. Berry GJ, Burke MM, Andersen C, Bruneval P, Fedrigo M, Fishbein MC, et al. The 2013 International Society for Heart and Lung Transplantation Working Formulation for the standardization of nomenclature in the pathologic diagnosis of antibody-mediated rejection in heart transplantation. Journal of Heart and Lung Transplantation. 2013;32(12):1147–1162. - PubMed
    1. Abrahimi P, Liu R, Pober JS. Blood Vessels in Allotransplantation. American Journal of Transplantation. 2015;15(7):1748–1754. - PubMed
    1. Fishbein GA, Fishbein MC. Morphologic and immunohistochemical findings in antibody-mediated rejection of the cardiac allograft. Human Immunology. 2012;73(12):1213–1217. - PubMed
    1. Loupy A, Toquet C, Rouvier P, Beuscart T, Bories MC, Varnous S, et al. Late Failing Heart Allografts: Pathology of Cardiac Allograft Vasculopathy and Association With Antibody-Mediated Rejection. American Journal of Transplantation. 2016;16(1):111–120. - PubMed

Publication types

MeSH terms

Substances