

Importance of the C-Terminus of Aldehyde Dehydrogenase 7A1 for Oligomerization and Catalytic Activity
- PMID: 29045138
- PMCID: PMC5928510
- DOI: 10.1021/acs.biochem.7b00803
Importance of the C-Terminus of Aldehyde Dehydrogenase 7A1 for Oligomerization and Catalytic Activity
Abstract
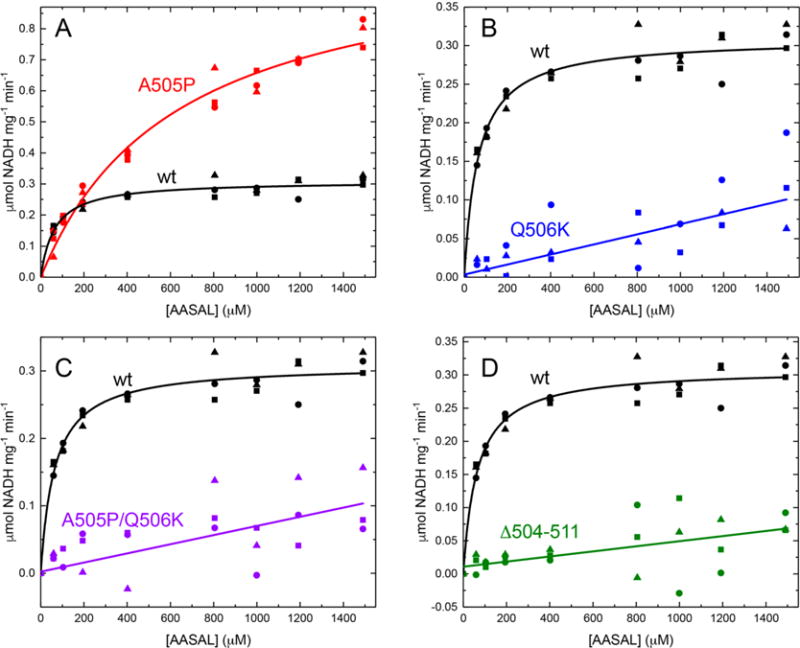
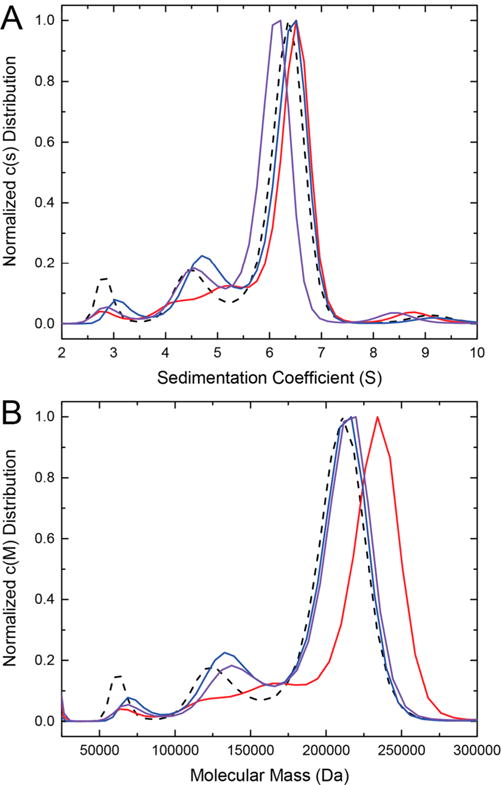
Aldehyde dehydrogenase 7A1 (ALDH7A1) catalyzes the terminal step of lysine catabolism, the NAD+-dependent oxidation of α-aminoadipate semialdehyde to α-aminoadipate. Structures of ALDH7A1 reveal the C-terminus is a gate that opens and closes in response to the binding of α-aminoadipate. In the closed state, the C-terminus of one protomer stabilizes the active site of the neighboring protomer in the dimer-of-dimers tetramer. Specifically, Ala505 and Gln506 interact with the conserved aldehyde anchor loop structure in the closed state. The apparent involvement of these residues in catalysis is significant because they are replaced by Pro505 and Lys506 in a genetic deletion (c.1512delG) that causes pyridoxine-dependent epilepsy. Inspired by the c.1512delG defect, we generated variant proteins harboring either A505P, Q506K, or both mutations (A505P/Q506K). Additionally, a C-terminal truncation mutant lacking the last eight residues was prepared. The catalytic behaviors of the variants were examined in steady-state kinetic assays, and their quaternary structures were examined by analytical ultracentrifugation. The mutant enzymes exhibit a profound kinetic defect characterized by markedly elevated Michaelis constants for α-aminoadipate semialdehyde, suggesting that the mutated residues are important for substrate binding. Furthermore, analyses of the in-solution oligomeric states revealed that the mutant enzymes are defective in tetramer formation. Overall, these results suggest that the C-terminus of ALDH7A1 is crucial for the maintenance of both the oligomeric state and the catalytic activity.
Conflict of interest statement
The authors declare no competing financial interest.
Figures


Similar articles
-
Impact of missense mutations in the ALDH7A1 gene on enzyme structure and catalytic function.Biochimie. 2021 Apr;183:49-54. doi: 10.1016/j.biochi.2020.09.016. Epub 2020 Sep 19. Biochimie. 2021. PMID: 32956737 Free PMC article. Review.
-
Structural and biochemical consequences of pyridoxine-dependent epilepsy mutations that target the aldehyde binding site of aldehyde dehydrogenase ALDH7A1.FEBS J. 2020 Jan;287(1):173-189. doi: 10.1111/febs.14997. Epub 2019 Jul 25. FEBS J. 2020. PMID: 31302938 Free PMC article.
-
Structural Basis of Substrate Recognition by Aldehyde Dehydrogenase 7A1.Biochemistry. 2015 Sep 8;54(35):5513-22. doi: 10.1021/acs.biochem.5b00754. Epub 2015 Aug 19. Biochemistry. 2015. PMID: 26260980 Free PMC article.
-
Impact of disease-Linked mutations targeting the oligomerization interfaces of aldehyde dehydrogenase 7A1.Chem Biol Interact. 2017 Oct 1;276:31-39. doi: 10.1016/j.cbi.2017.01.002. Epub 2017 Jan 10. Chem Biol Interact. 2017. PMID: 28087462 Free PMC article.
-
The genotypic spectrum of ALDH7A1 mutations resulting in pyridoxine dependent epilepsy: A common epileptic encephalopathy.J Inherit Metab Dis. 2019 Mar;42(2):353-361. doi: 10.1002/jimd.12045. Epub 2019 Feb 22. J Inherit Metab Dis. 2019. PMID: 30043187 Free PMC article. Review.
Cited by
-
NAD+ promotes assembly of the active tetramer of aldehyde dehydrogenase 7A1.FEBS Lett. 2018 Oct;592(19):3229-3238. doi: 10.1002/1873-3468.13238. Epub 2018 Sep 18. FEBS Lett. 2018. PMID: 30184263 Free PMC article.
-
Impact of missense mutations in the ALDH7A1 gene on enzyme structure and catalytic function.Biochimie. 2021 Apr;183:49-54. doi: 10.1016/j.biochi.2020.09.016. Epub 2020 Sep 19. Biochimie. 2021. PMID: 32956737 Free PMC article. Review.
-
Structural analysis of pathogenic mutations targeting Glu427 of ALDH7A1, the hot spot residue of pyridoxine-dependent epilepsy.J Inherit Metab Dis. 2020 May;43(3):635-644. doi: 10.1002/jimd.12184. Epub 2019 Dec 1. J Inherit Metab Dis. 2020. PMID: 31652343 Free PMC article.
-
Biochemical, structural, and computational analyses of two new clinically identified missense mutations of ALDH7A1.Chem Biol Interact. 2024 May 1;394:110993. doi: 10.1016/j.cbi.2024.110993. Epub 2024 Apr 9. Chem Biol Interact. 2024. PMID: 38604394 Free PMC article.
-
Structural and biochemical consequences of pyridoxine-dependent epilepsy mutations that target the aldehyde binding site of aldehyde dehydrogenase ALDH7A1.FEBS J. 2020 Jan;287(1):173-189. doi: 10.1111/febs.14997. Epub 2019 Jul 25. FEBS J. 2020. PMID: 31302938 Free PMC article.
References
-
- van Karnebeek CD, Tiebout SA, Niermeijer J, Poll-The BT, Ghani A, Coughlin CR, 2nd, Van Hove JL, Richter JW, Christen HJ, Gallagher R, Hartmann H, Stockler-Ipsiroglu S. Pyridoxine-dependent epilepsy: An expanding clinical spectrum. Pediatr Neurol. 2016;59:6–12. - PubMed
-
- Stockler S, Plecko B, Gospe SM, Jr, Coulter-Mackie M, Connolly M, van Karnebeek C, Mercimek-Mahmutoglu S, Hartmann H, Scharer G, Struijs E, Tein I, Jakobs C, Clayton P, Van Hove JL. Pyridoxine dependent epilepsy and antiquitin deficiency: clinical and molecular characteristics and recommendations for diagnosis, treatment and follow-up. Mol Genet Metab. 2011;104:48–60. - PubMed
-
- Mills PB, Struys E, Jakobs C, Plecko B, Baxter P, Baumgartner M, Willemsen MA, Omran H, Tacke U, Uhlenberg B, Weschke B, Clayton PT. Mutations in antiquitin in individuals with pyridoxine-dependent seizures. Nat Med. 2006;12:307–309. - PubMed
-
- Koppaka V, Thompson DC, Chen Y, Ellermann M, Nicolaou KC, Juvonen RO, Petersen D, Deitrich RA, Hurley TD, Vasiliou V. Aldehyde dehydrogenase inhibitors: a comprehensive review of the pharmacology, mechanism of action, substrate specificity, and clinical application. Pharmacol Rev. 2012;64:520–539. - PMC - PubMed
Publication types
MeSH terms
Substances
Supplementary concepts
Grants and funding
LinkOut - more resources
Full Text Sources
Other Literature Sources
Miscellaneous
