

Quantitative Liver MRI-Biopsy Correlation in Pediatric and Young Adult Patients With Nonalcoholic Fatty Liver Disease: Can One Be Used to Predict the Other?
- PMID: 29045180
- PMCID: PMC6044727
- DOI: 10.2214/AJR.17.18446
Quantitative Liver MRI-Biopsy Correlation in Pediatric and Young Adult Patients With Nonalcoholic Fatty Liver Disease: Can One Be Used to Predict the Other?
Abstract
Objective: The purpose of this study is to determine the relationships between quantitative liver MRI measurements and liver biopsy findings in pediatric and young adult patients with nonalcoholic fatty liver disease (NAFLD).
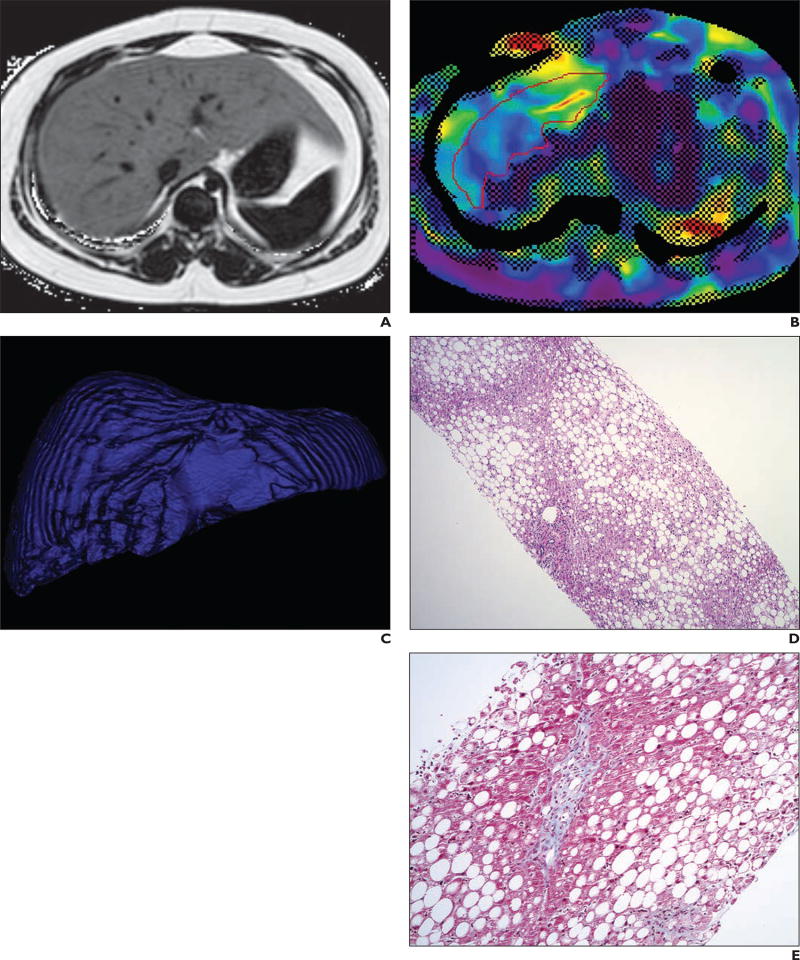
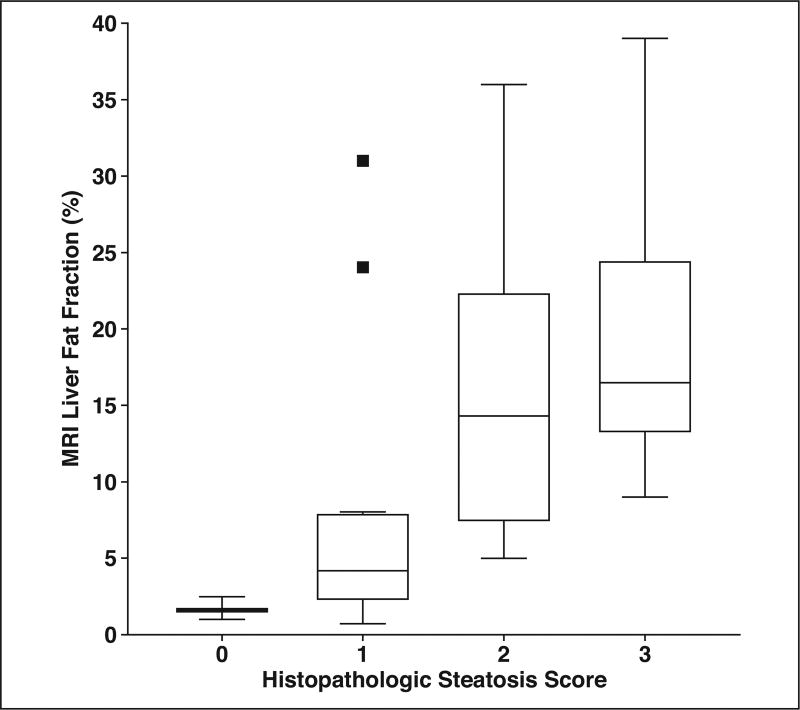
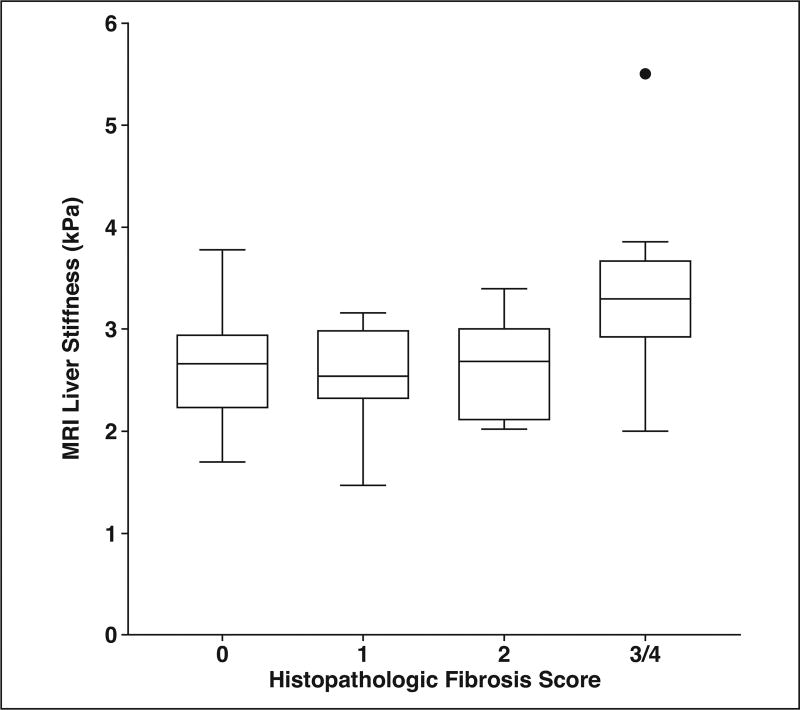
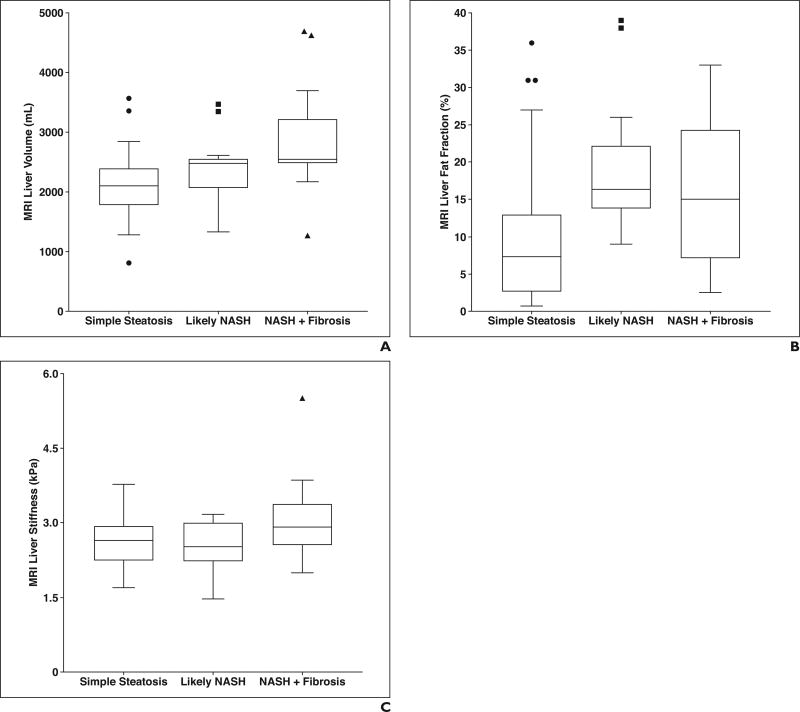
Materials and methods: Data were obtained from a registry that prospectively enrolls pediatric and young adult patients with biopsy-confirmed NAFLD at our tertiary medical center with parent or guardian and subject informed consent, as appropriate. Patients enrolled between November 2007 and June 2016 with a quantitative liver MRI examination within 6 months of biopsy were included (n = 69). Liver stiffness (kilopascals), volume (milliliters), and fat fraction (percentage) were extracted from MRI records. Multiple linear regression was used to determine the relationships between NAFLD activity score and quantitative MRI measures, and between MRI liver stiffness and histopathologic scores (steatosis, lobular inflammation, portal inflammation, hepatocyte ballooning, and fibrosis). Histopathologic data were extracted from medical records, with severity graded by hepatopathologists using Non-alcoholic Steatohepatitis (NASH) Clinical Research Network criteria. Ordinal logistic regression was used to assess the relationship between categoric NAFLD severity (simple steatosis vs NASH vs NASH with significant fibrosis) and MRI measures.
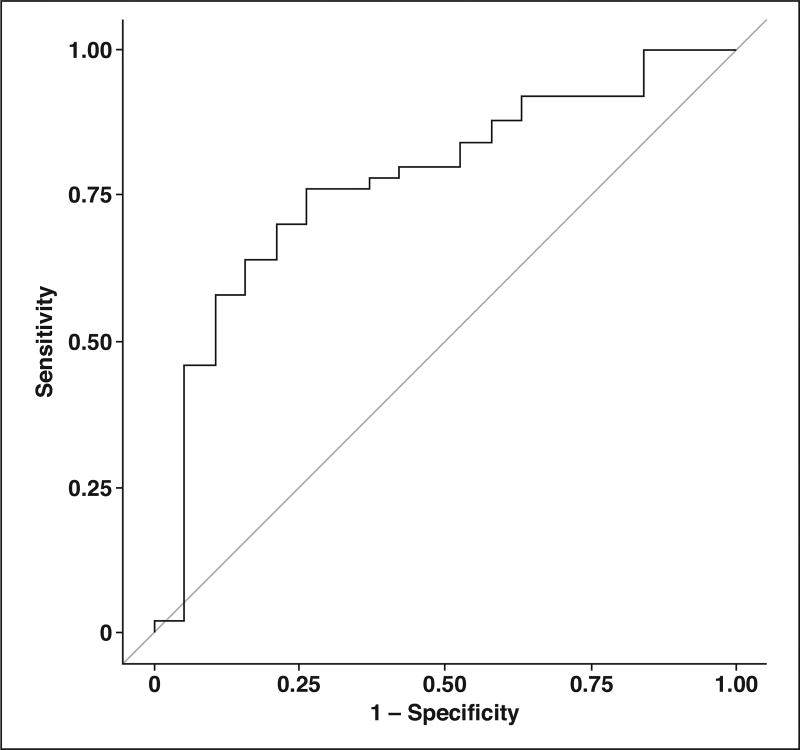
Results: The mean (± SD) patient age at the time of MRI was 14.3 ± 2.8 years (range, 8-21 years); 25 (36.2%) patients were female. Liver biopsy was performed within a mean of 64.4 days of the MRI examination. There was a positive correlation between histopathologic steatosis and MRI liver fat fraction (ρ = 0.57; p < 0.0001). MRI fat fraction was the only significant imaging predictor of NAFLD activity score (p = 0.017). Fibrosis score was the only significant histopathologic predictor of MRI liver stiffness (p = 0.001). MRI liver volume was the only imaging predictor of categoric NAFLD severity (odds ratio = 1.001; 95% CI, 1.000-1.002; p = 0.007).
Conclusion: There was significant positive correlation between histopathologic and MRI liver fat measurements in our cohort. MRI liver stiffness did not predict the severity of fatty liver disease in children and young adults.
Keywords: MRI; biopsy; children; nonalcoholic fatty liver disease; quantitative.
Figures
References
-
- Nobili V, Alkhouri N, Alisi A, et al. Nonalcoholic fatty liver disease: a challenge for pediatricians. JAMA Pediatr. 2015;169:170–176. - PubMed
-
- Vos MB, Abrams SH, Barlow SE, et al. NASPGHAN clinical practice guideline for the diagnosis and treatment of nonalcoholic fatty liver disease in children: recommendations from the Expert Committee on NAFLD (ECON) and the North American Society of Pediatric Gastroenterology, Hepatology and Nutrition (NASPGHAN) J Pediatr Gastroenterol Nutr. 2017;64:319–334. - PMC - PubMed
-
- Wong RJ, Aguilar M, Cheung R, et al. Nonalcoholic steatohepatitis is the second leading etiology of liver disease among adults awaiting liver transplantation in the United States. Gastroenterology. 2015;148:547–555. - PubMed
MeSH terms
Grants and funding
LinkOut - more resources
Full Text Sources
Other Literature Sources
Medical
