

Effect of antihypertensive treatment on 24-h blood pressure variability: pooled individual data analysis of ambulatory blood pressure monitoring studies based on olmesartan mono or combination treatment
- PMID: 29045341
- PMCID: PMC5862001
- DOI: 10.1097/HJH.0000000000001608
Effect of antihypertensive treatment on 24-h blood pressure variability: pooled individual data analysis of ambulatory blood pressure monitoring studies based on olmesartan mono or combination treatment
Abstract
Objective: To evaluate the impact of olmesartan alone or combined with one to three antihypertensive drugs on 24-h blood pressure variability (BPV) and on distribution of BP reduction in a pooled individual data analysis of 10 double-blind, randomized, ambulatory BP monitoring (ABPM) studies.
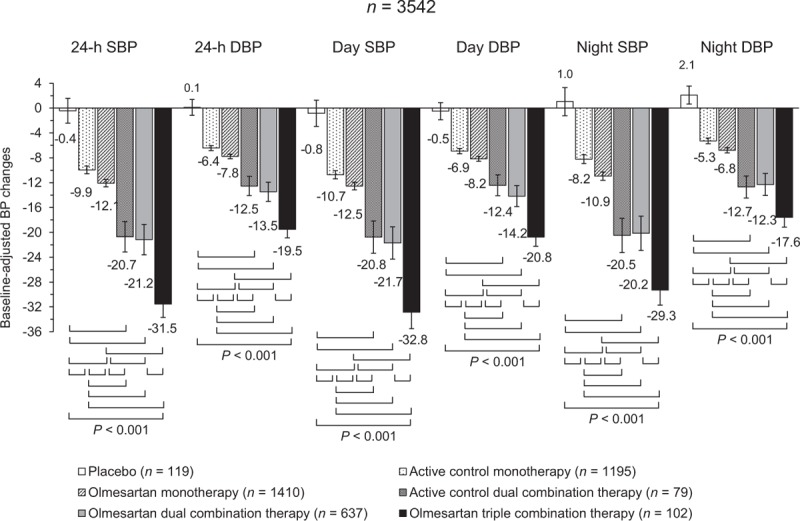
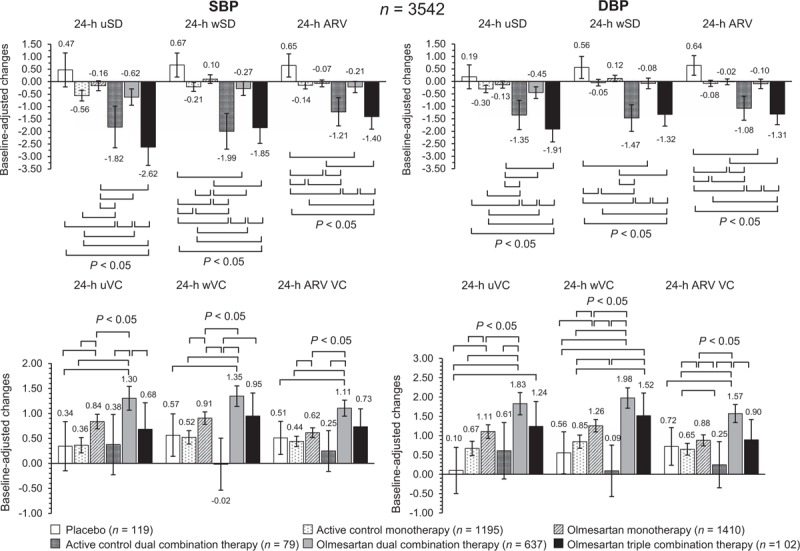
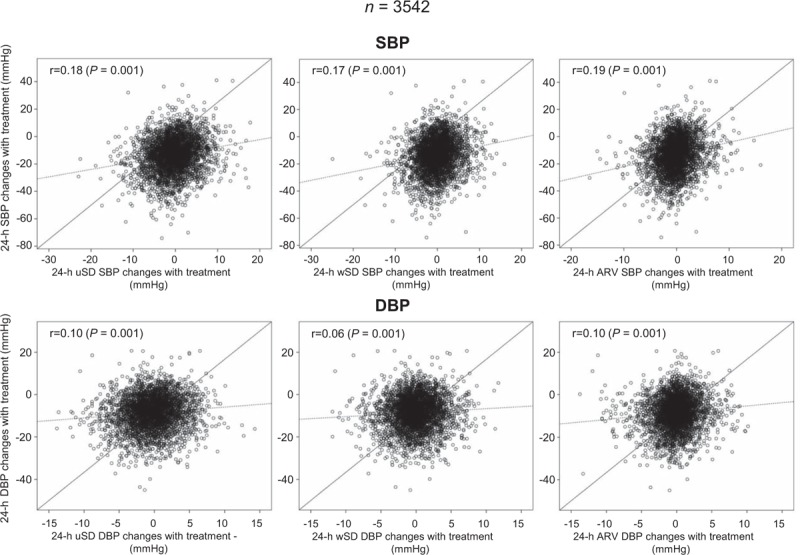
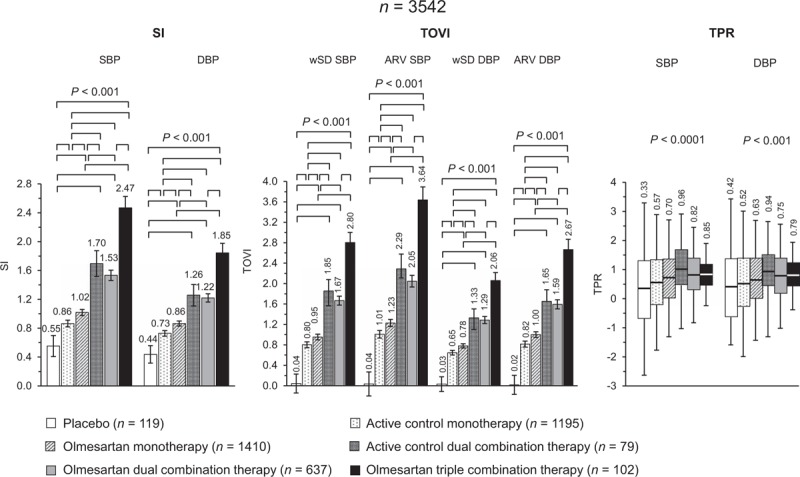
Methods: ABPMs were performed before and after 6-12 weeks of treatment with placebo (n = 119), active control monotherapy [n = 1195, angiotensin-converting enzyme inhibitors (ACEIs), angiotensin II receptor blockers (ARBs), dihydropyridine calcium channel blockers (DCCBs)] olmesartan monotherapy (n = 1410), active control dual combination [n = 79, DCCB + thiazide diuretic (TD)], olmesartan dual combination (n = 637, DCCB or TD), and triple combination therapy (n = 102, DCCB+TD). 24-h BPV was calculated as unweighted or weighted SD of the mean BP, and average real variability. BP control was assessed by smoothness index and treatment-on-variability index.
Results: The greatest effect on 24-h systolic BPV/diastolic BPV was observed under olmesartan triple [-2.6/-1.9; -1.9/-1.3; -1.4/-1.3 mmHg] and active control dual combination [-1.8/-1.4; -1.9/-1.5; -1.2/-1.1 mmHg]. Smoothness indexes and treatment-on-variability indexes were significantly (P = 0.0001) higher under olmesartan dual (1.53/1.22, 1.67/1.29, 2.05/1.59), olmesartan triple (2.47/1.85, 2.80/2.06, 3.64/2.67), or active control dual combination (1.70/1.26, 1.85/1.33, 2.29/1.65) than under monotherapies (control: 0.86/0.73, 0.80/0.65, 1.01/0.82; olmesartan: 1.02/0.86, 0.95/0.78, 1.23/1.00). They were also greater in patients receiving high-dose olmesartan monotherapy or high-dose olmesartan dual combination than in the corresponding low-dose group.
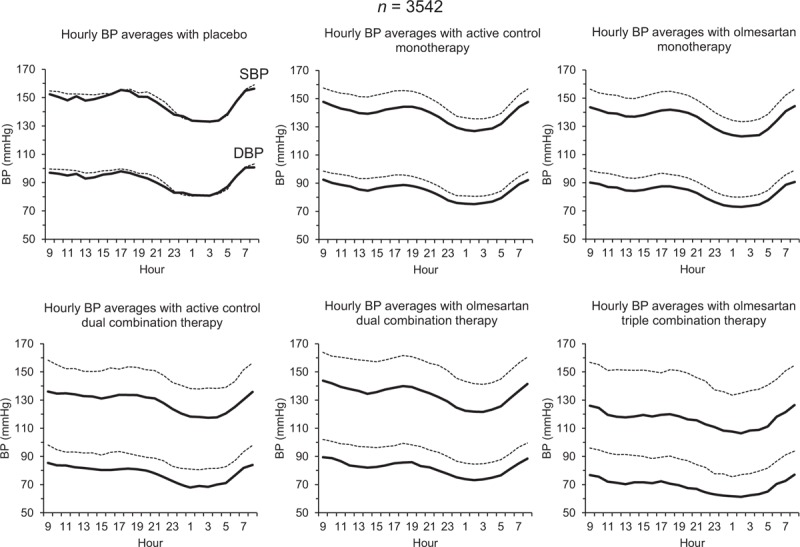
Conclusion: Olmesartan plus a DCCB and/or a TD produces a larger, more sustained, and smoother BP reduction than placebo and monotherapies, a desirable feature for a more effective prevention of the cardiovascular consequences of uncontrolled hypertension.
Figures
References
-
- Mancia G, Parati G, Hennig M, Flatau B, Omboni S, Glavina F, et al. ELSA Investigators. Relation between blood pressure variability and carotid artery damage in hypertension: baseline data from the European Lacidipine Study on Atherosclerosis (ELSA). J Hypertens 2001; 19:1981–1989. - PubMed
-
- Sega R, Corrao G, Bombelli M, Beltrame L, Facchetti R, Grassi G, et al. Blood pressure variability and organ damage in a general population: results from the PAMELA study (Pressioni Arteriose Monitorate E Loro Associazioni). Hypertension 2002; 39:710–714. - PubMed
-
- Shintani Y, Kikuya M, Hara A, Ohkubo T, Metoki H, Asayama K, et al. Ambulatory blood pressure, blood pressure variability and the prevalence of carotid artery alteration: the Ohasama study. J Hypertens 2007; 25:1704–1710. - PubMed
-
- Madden JM, O’Flynn AM, Fitzgerald AP, Kearney PM. Correlation between short-term blood pressure variability and left-ventricular mass index: a meta-analysis. Hypertens Res 2016; 39:171–177. - PubMed
-
- Kikuya M, Hozawa A, Ohokubo T, Tsuji I, Michimata M, Matsubara M, et al. Prognostic significance of blood pressure and heart rate variabilities: the Ohasama study. Hypertension 2000; 36:901–906. - PubMed
Publication types
MeSH terms
Substances
LinkOut - more resources
Full Text Sources
Other Literature Sources
Medical
