. 2017 Oct 26;550(7677):475-480.
doi: 10.1038/nature24271. Epub 2017 Oct 18.

Inflammatory memory sensitizes skin epithelial stem cells to tissue damage

Affiliations

Inflammatory memory sensitizes skin epithelial stem cells to tissue damage

Shruti Naik et al. Nature. .

Erratum in

Abstract

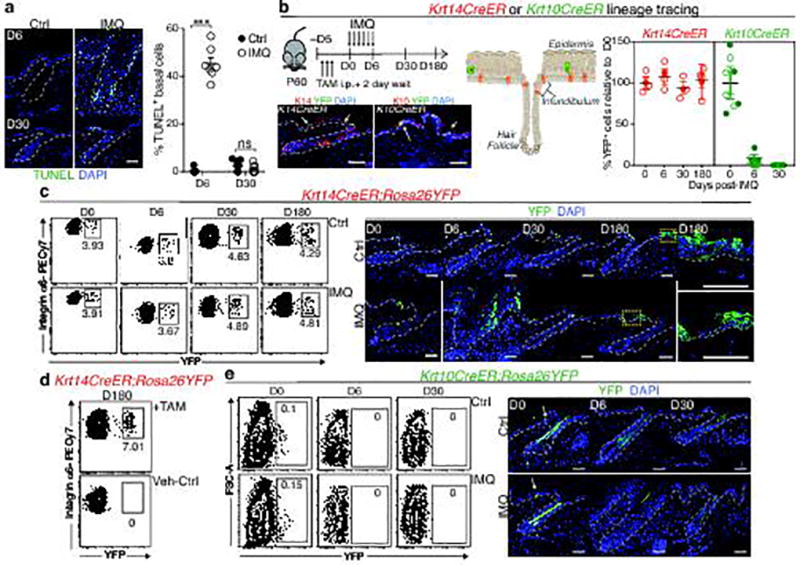
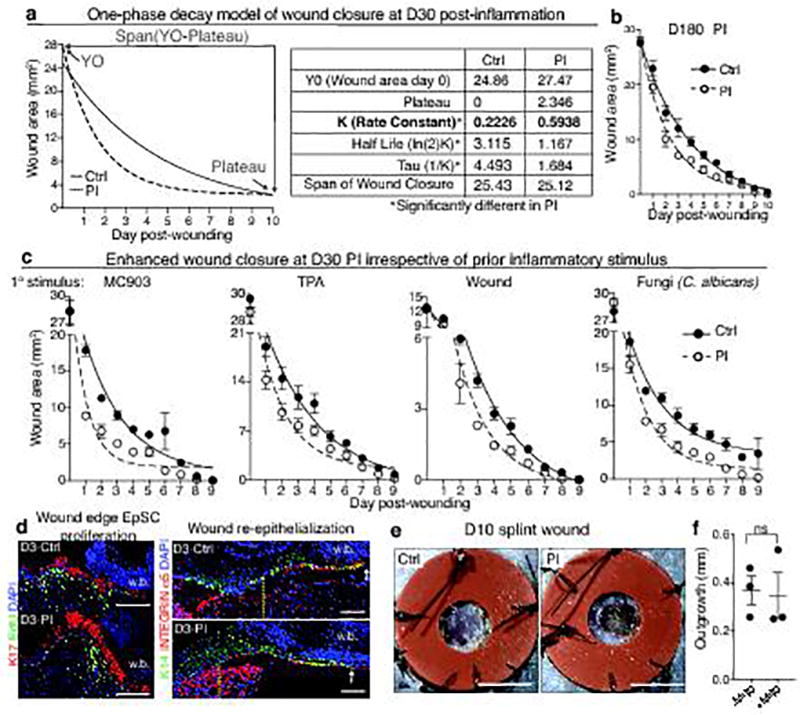
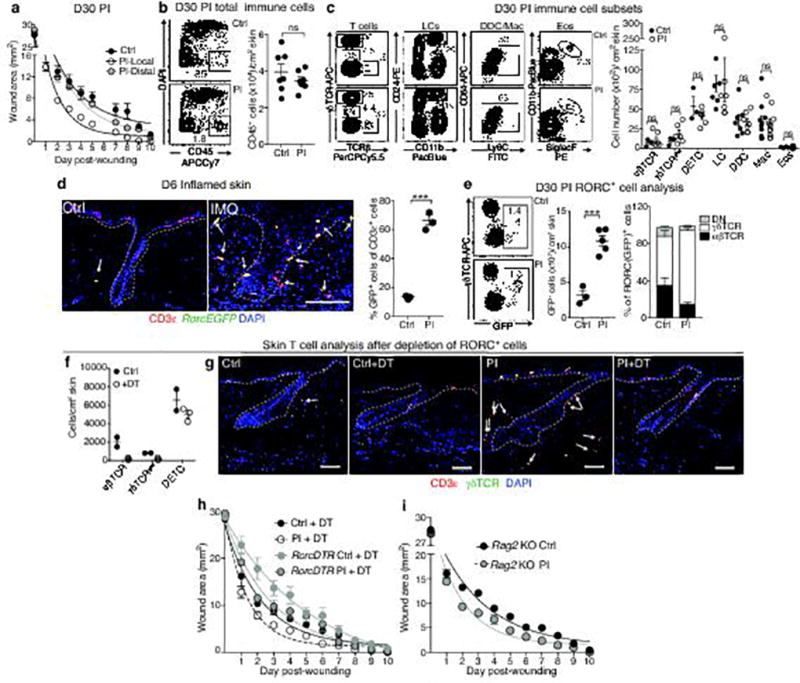
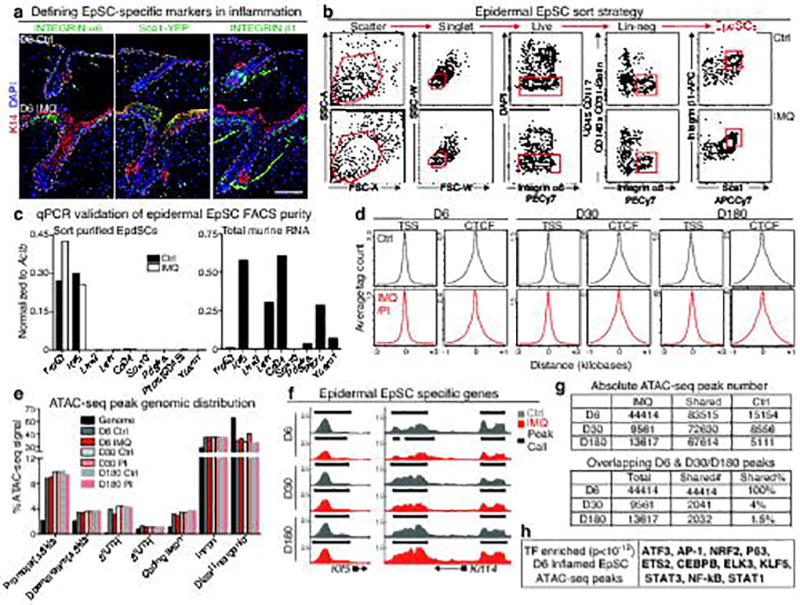
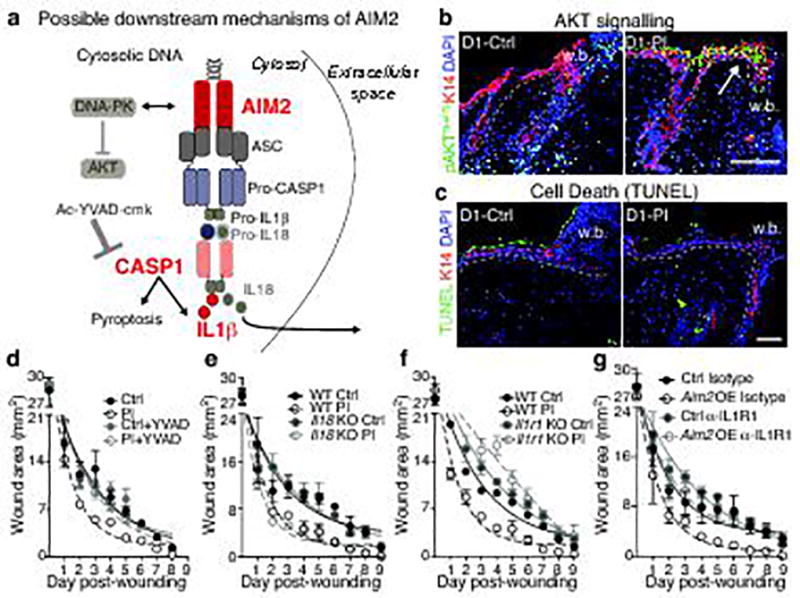
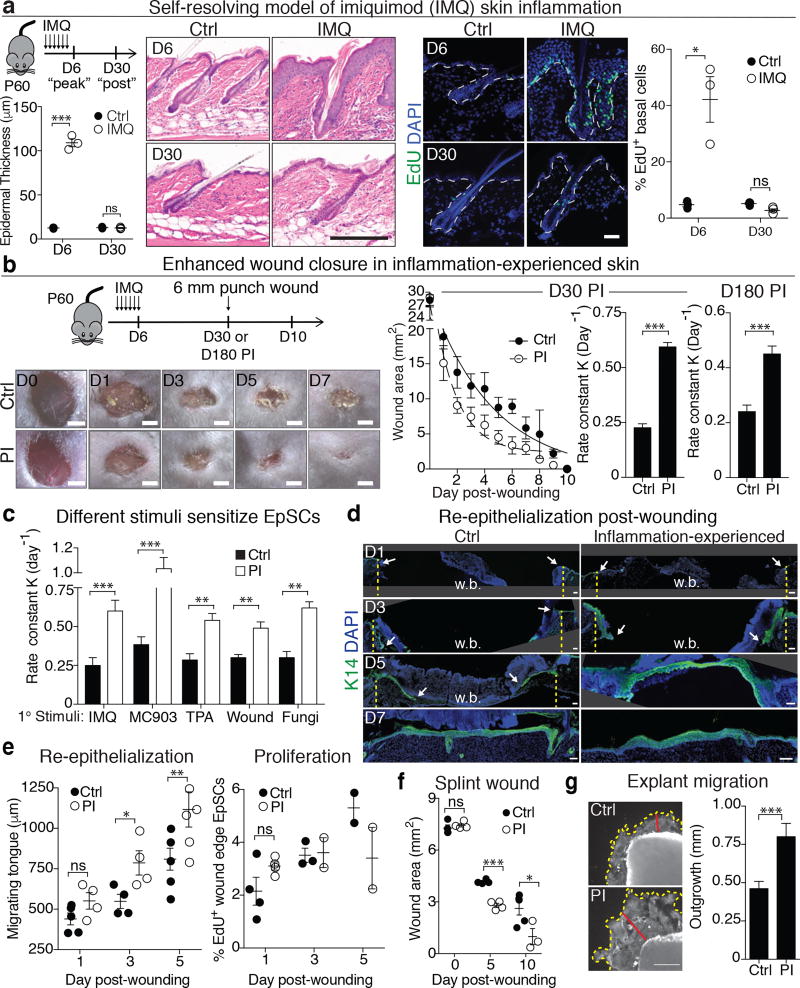
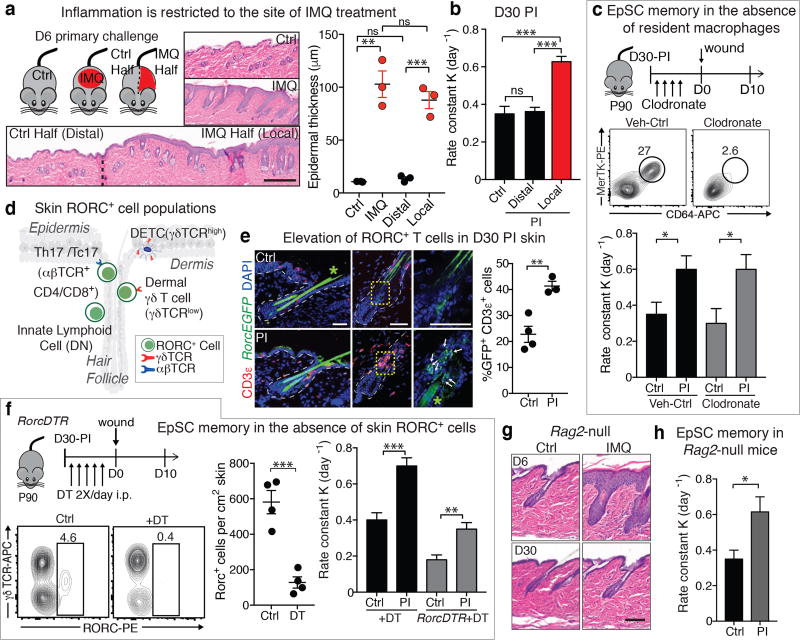
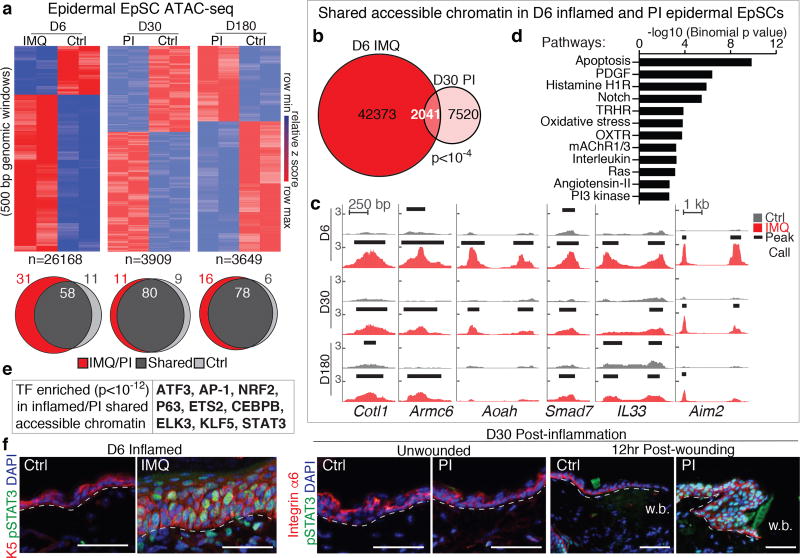
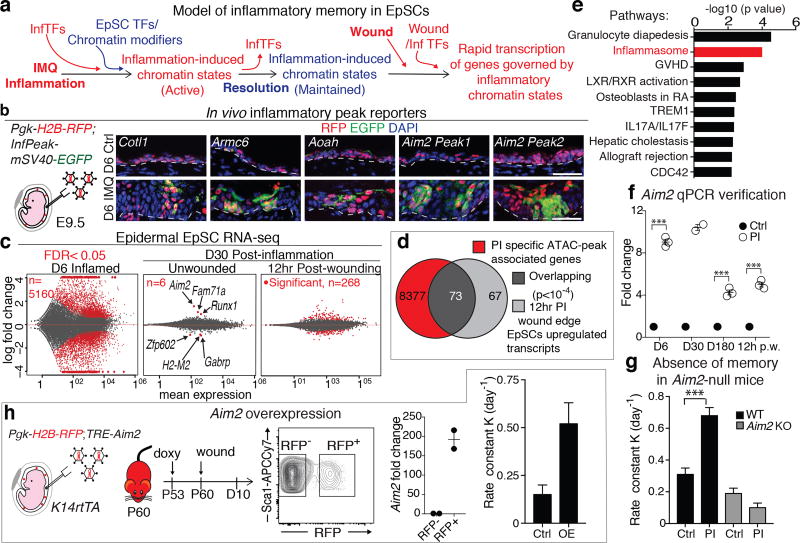
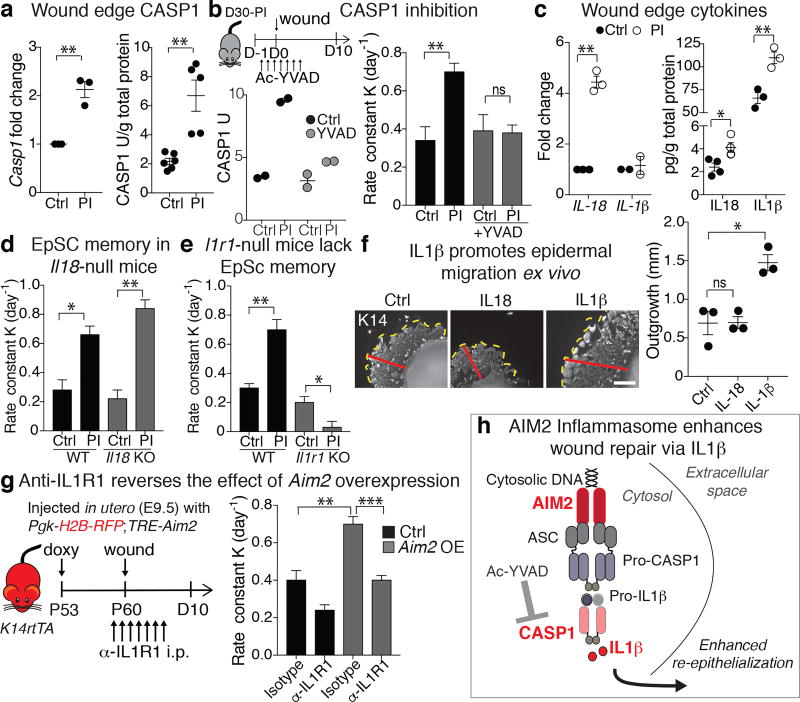
The skin barrier is the body's first line of defence against environmental assaults, and is maintained by epithelial stem cells (EpSCs). Despite the vulnerability of EpSCs to inflammatory pressures, neither the primary response to inflammation nor its enduring consequences are well understood. Here we report a prolonged memory to acute inflammation that enables mouse EpSCs to hasten barrier restoration after subsequent tissue damage. This functional adaptation does not require skin-resident macrophages or T cells. Instead, EpSCs maintain chromosomal accessibility at key stress response genes that are activated by the primary stimulus. Upon a secondary challenge, genes governed by these domains are transcribed rapidly. Fuelling this memory is Aim2, which encodes an activator of the inflammasome. The absence of AIM2 or its downstream effectors, caspase-1 and interleukin-1β, erases the ability of EpSCs to recollect inflammation. Although EpSCs benefit from inflammatory tuning by heightening their responsiveness to subsequent stressors, this enhanced sensitivity probably increases their susceptibility to autoimmune and hyperproliferative disorders, including cancer.


Figures

Extended Data Fig. 1
Extended Data Fig. 1. Lineage tracing of skin stem cells and progeny during and after acute skin inflammation
a, Epifluorescence images and corresponding quantifications of TUNEL+ basal cells at D6 of imiquimod treatment (or vehicle Ctrl) and at D30 following treatment (n=7. P<0.0001, non-significant (ns, P>0.05)). b, Schematic, immunofluorescence images, and quantifications of tamoxifen(TAM)-induced (corn oil control, Ctrl) RosaYFP reporter lineage tracing with: Krt14CreER, expressed by K14+ EpSCs and Krt10CreER, expressed by K10+ terminally differentiating cells., intraperitoneal (i.p.) (n=4. all time points P>0.05). Plots depict percentage of YFP+ cells relative to pre-imiquimod (D0) baselines (corresponding flow cytometric plots in Extended Data Fig. 1c,e). Arrows mark examples of YFP+ cells. c, Lineage tracing of Krt14CreER; RosaYFP at indicated times. Left, flow cytometric analysis of Integrin-α6+Sca1+CD34YFP+ epidermal keratinocytes. Right, immunofluorescence of tamoxifen-activated EpSCs, lineage traced by YFP+ to include progeny (n=3). d, Flow cytometry of Krt14CreER;Rosa YFP cells from the skin epidermis of animals that were lineage traced starting from IMQ treatment and analyzed at D180 (n=2). e, Analysis of Krt10CreER;RosaYFP skins, lineage-traced beginning during IMQ or Ctrl treatment (n=3). Top, flow cytometric analysis of side YFP+ cells. Bottom, representative immunofluorescence images. All scale bars= 50 µm. Dotted lines demarcate the dermo-epidermal border. Arrows mark representative YFP+ keratinocytes; DAPI (blue), 4’,6-diamidino-2-phenylindole. All plots represent mean ± SEM. n=x biologically independent animals per group. Significance for all plots was determined using two-tailed t-test at 95% confidence interval. All experiments have been replicated ≥ 2 times.
Extended Data Fig. 2
Extended Data Fig. 2. Enhanced wound repair in post-inflamed epidermis
a, One phase decay modeling of wound repair in D30 inflammation-experienced (post-inflamed, PI) or vehicle treated control (Ctrl) mice (see Fig. 1b). Note: relative to two or three phase decay models (not shown), the data (shown at right) best fit this model, and was therefore used for all subsequent wound repair data. b, Temporal wound closure analysis overlaid with one phase decay analysis at D180 post-inflammation (n=3). c, Temporal wound closure analysis overlaid with one phase decay analysis of skins at D30 post-treatment with a variety of different inflammation-inducing agents: Calcipotriol (MC903), 12-O-Tetradecanoylphorbol-13-acetate (TPA), epidermal abrasion (Wound), or 106 Candida albicans infection (n=4). See Fig. 1c for rate constants. d, Immunofluorescence images of wound edge labeled with the following antibodies: anti-EdU to mark proliferating cells, anti-K17 to mark wound-sensitized keratinocytes, integrin α5 to mark the migrating wound tongue that re-epithelializes the wound bed and K14, which marks the epidermal progenitors, expanded at the wound site. Vertical dotted lines mark the initial wound edge; arrows mark the edge of the extended epithelial tongue (n=3). Wound bed (w.b.). Scale bars=100 µm. See Fig. 1e for quantifications. e, Representative images of silicone splinted 3 mm full thickness wounds from D30 Ctrl or PI animals (n=4). Scale bars=3 mm. See Fig. 1f for quantifications. f, Migration assays were performed on skin explants (see Fig. 1g), in the presence or absence of mitomycin C for 5 days under conditions that quantitatively abrogate keratinocyte cell proliferation. Note that epidermal migration rates are similar irrespective of whether cell proliferation was impaired (n=3, 3 technical replicates per animal. two-tailed t-test, P>0.05). All plots represent mean± S.E.M. For individual data points in b and c see source data. n=x biologically independent animals per group. All experiments have been replicated ≥ 2 times.
Extended Data Fig. 3
Extended Data Fig. 3. The wound-healing advantage conferred to EpSCs is confined to the site of inflammation and is occurs even when skin RORC+ cells are ablated
a, Temporal wound closure analysis overlaid with one phase decay analysis of inflammation-experienced (PI) and vehicle control (Ctrl) skins, comparing the wound closure rates at sites distal and local to the topical application. Wound healing was initiated at D30 after IMQ treatment, a time when morphological signs of epidermal homeostasis were restored (n=3). Plot display data combined from 3 independent experiments, see rate constants in Fig. 2b. b, c, Flow cytometric analysis of total immune (CD45+) cells, αβTCR, γδTCRlow (Dermal γδT cells), Dendritic epidermal T cells (DETC), Langerhans cells (LC), dermal dendritic cells (DDC), macrophages (Mac), and eosinophils (Eos) from control and D30 post-inflamed skins. Quantifications shown at right (n≥3). d, Immunofluorescence images and quantification of T cells from RorcEGFP mice at the peak (D6) of inflammation (see Fig. 2e for post-inflammation). (n=3. P=0.0056). Arrows point to RORC+ CD3ε+ cells, thought to be the major drivers of IMQ-induced inflammation. Dotted lines demarcate dermo-epidermal borders. e, Flow cytometric analysis of frequency and cellular distribution of RORC+ cells at D30 post-inflammation (n=4 P=0.0005). Proportion of αβTCR, γδTCRlow and double negative (innate lymphoid cells) within RORC (GFP)+ gate displated adjacent to total GFP+ cell quantification. f, Depletion of RORC+ cells does not result in a compensatory increase in other skin T cell populations (n=2). g, Immunofluorescence of skin sections showing effective DT-mediated ablation of all CD3ε+RORC+ cells (yellow) in RorcCre;Rosa-LSL-iDTR (RorcDTR) mice (n=3). These mice activate DTR from the Rosa26 locus only in RORC+ cells, enabling their selective ablation. DT, diphtheria toxin; DTR, DT receptor. h, Wounds heal faster in post-inflamed skin despite ablation of skin RORC+ cells (n=3). For corresponding rate constants in e–g, see Fig. 2f. i, Despite absence of T and B lymphocytes, Rag2-null mice still mount a response to IMQ and display accelerated wound-healing after return to homeostasis at D30 PI (n=3). KO, knockout. For rate constants see Fig. 2h. Scale bar: d, 100 µm and g, 50 µm. non-significant (ns, P>0.05). All plots represent mean± S.E.M. For individual data points in a, h, and i see source data. n=x biologically independent animals per group. Significance for all plots was determined using a two-tailed t-test at 95% confidence interval. All experiments have been replicated ≥ 2 times.
Extended Data Fig. 4
Extended Data Fig. 4. Analysis of accessible chromatin in EpSCs during and after inflammation
a, Immunofluorescence analysis of basal epidermal stem cell (EpSC) specific markers in inflamed and control skin. Scale bars=100 µm. b, Fluorescence activated cell sorting (FACS) strategy for isolation of EpSCs (Integrins α6+β1+Sca1+), with exclusion of CD45+, CD31+, CD117+, and CD140a+ non-epidermal cells, as well as dead (DAPI+), and doublets (side-scatter-width, SSC-Whigh and forward-scatter-width, FSC-Whigh). c, Quantitative PCR validation of EpSC purity (left) using total murine RNA as a control (right). Trp63 and Klf5 are specific for EpSCs; the others are not expressed by EpSCs (n=3 mice pooled per group). d, Density plots depicting enrichment of ATAC-seq signals at transcription start sites (TSS) ±3 kb and around CTCF factor binding sites. X-axis depicts respective distance ±1 kb from each of these domains. e, Distribution of ATAC-seq peaks within defined genomic regions. UTR, untranslated regions of predicted mRNAs. f, Genomic browser shots of peaks enriched in EpSC-specific genes Klf5 and Krt14 and unaffected by IMQ. Arrows denote direction of transcription. g, (Top) Absolute numbers of ATAC-seq peaks from D6 inflamed, D30/D180 post-inflamed, and control EpSCs. (Bottom) Numbers and frequencies of ATAC-seq peaks that are shared in D6 inflamed and either D30 or D180 post-inflamed EpSCs. h, Transcription factor motif enrichment (cumulative binomial distributions, P<10−12) within the ATAC-seq peaks of D6 inflamed EpSCs n≥3. For further details regarding this figure, see Fig. 3a–e. n=x biologically independent animals per group. All experiments have been replicated ≥ 2 times.
Extended Data Fig. 5
Extended Data Fig. 5. Enrichment of inflammasome transcripts in wound edge EpSCs of inflammation-experienced skin
a,b, Fluorescence activated cell sorting (FACS) strategy and qPCR verification of wound-edge EpdSCs purity from skins that were either treated with IMQ or vehicle and then allowed to return to homeostasis prior to wounding at D30 (n=3 pooled mice per group). Relevant antibodies and exclusion of dead cells and doublets were described in the legend to Extended data Fig. 4. c, Matched ATAC-seq and RNA-seq analysis reveal that 91% of differentially expressed genes in D6 inflamed versus control EpSCs are associated with newly acquired ATAC-seq peaks. For further data regarding experiments in a–c, see Fig. 4c–e. d, Sustained Aim2 transcription at D30 post-inflammation in mice depleted of RORC+ cells. n=3. See also Fig. 4f. n=6 (two tailed t-test with 95% confidence interval, P=0.0028) e, Aim2-null mice do not show enhanced wound healing post-inflammation. n=3. For further data, see Fig. 4g. f, Aim2 induction in EpSCs is sufficient to augment wound healing in naïve mice. n=4. For further data, see Fig. 4h. For individual data points in e and f see source data. All plots represent mean ± SEM. KO, knockout; OE, overexpression. n=x biologically independent animals per group. Experiments a–e replicated ≥2 times, f was performed one time.
Extended Data Fig. 6
Extended Data Fig. 6. Dissecting AIM2’s downstream effectors
a, Model depicting possible effectors downstream of AIM2. b, c, AKTSer473 expression and TUNEL labeling, respectively, in control and D30 post-inflamed wounds (n=3). d, See Fig. 5b for schematic and further data relating to the experiment. Ac-YVAD-cmk reduces re-epithelialization rates of wounded, post-inflamed skin to naïve, vehicle control levels (n=3). e, Absence of Il18 does not hamper the enhanced injury response of post-inflamed skin (n=3). For further data, see Fig. 5d. f, Absence of IL1β-signaling, achieved in Il1r1-null mice, abrogates the enhanced injury response of post-inflamed skin (n=4). For further data, see Fig. 5e. g, Anti-IL1R1 treatment reverses the wound repair advantage conferred by epidermal Aim2 overexpression in naïve mice (n=4). For further data see Fig. 5g. For individual data points in d–g see source data. KO, knockout; OE, overexpression. Scale bars = b, 100 µm and c, 50 µm. n=3. All plots represent mean ± SEM. n=x biologically independent animals per group. Experiments a–f have been replicated ≥ 2 times, g was performed one time.
Figure 1
Figure 1. Enhanced epidermal wound repair post-inflammation
a, IMQ treatment schematic and corresponding histopathology (n=3, P<0.0001). EdU+ basal epidermal and upper hair follicle (infundibulum) cells (n=3, P=0.01) DAPI, 4’,6-diamidino-2-phenylindole. b, Accelerated wound-healing in 30D (n=17, P<0.0001) and 180D (n=5, P=0.0003) post-inflamed (PI) versus Ctrl skin (images n=3). Rate calculated from wound area: D30 see adjacent graph; D180 see Extended Data Fig. 2b; individual data points see source data. c, Accelerated closure irrespective of initial inflammatory stimulus (n≥4). MC903 (P=0.0001), Calcipotriol; TPA, 12-O-Tetradecanoylphorbol-13-acetate (P=0.0014); Wound, epidermal abrasion (P=0.0027); Fungi, 106 Candida albicans infection (P=0.0029). Rate calculated from wound area in Extended Data Fig. 2c. d, Accelerated re-epithelialization in inflammation-experienced skin (n=3). Lines denote initial wound edges and arrows mark wound bed (w.b.). e, Quantifications of Integrin-α5+, K14+ epidermal tongue (n=4. D3 P=0.034, D5 P=0.037) and K14+, K17+,EdU+ proliferating wound-edge basal cells (n≥2). f, Wound closure of silicone-splinted, 3 mm full-thickness wounds (n=3. D5 P<0.0001, D10 P=0.0374). g, Analysis of K14+ keratinocyte D10 ex vivo explants outgrowth. Yellow and red lines mark outgrowth boundary and distance, respectively (n≥14. P=0.0006). Scale bars: (a-EdU), 50 µm; (a-histology), d 200 µm; b, 2 mm; g, 500 µm. Plots depict mean ± SEM. n=x biologically independent animals. Experiments replicated ≥ 2 times and significance determined using two-tailed t-test (95% confidence). Non-significant (ns, P>0.05).
Figure 2
Figure 2. Resident skin macrophages and T cells are dispensable for enhanced wound closure post-inflammation
a, Epidermal hyperthickening is confined to initial inflammation site. (n=3, ≥3 images/animal. **P=0.0019, ***P=0.0009). b, D30 wound closure is accelerated only at sites of prior IMQ treatment. n=12. P<0.0001. c, Clodronate liposome mediated resident macrophage depletion before wounding does not alter wound repair advantage post-inflammation (PI) (Flow n=2. wound rate n≥4. Ctrl P=0.0419, Clodronate P=0.0266). d, Skin RORC+ cell populations. e, RORC+ T cells (white arrows) are elevated at D30 PI (n≥3, 3 images/animal. P=0.0056). Experiments performed with RorcEGFP mice. Lines denote dermo-epidermal border, *denotes autofluorescence, and yellow box denotes magnified area in adjacent panel. f, Wounds heal faster in PI skin despite ablation of skin RORC+ cells (Flow cytometry, n=4, P=0.0008). Schematic of RORC+ cell depletion and wound repair using Rosa-LSL-iDTR (Ctrl) and RorcCre;Rosa-LSL-iDTR (RorcDTR) mice (n=5. Ctrl P=0.005, RorcDTR P=0.0053). DT, diphtheria toxin; DTR, DT receptor. g, Rag2-null mice mount a IMQ response (n=3, 3 images/ animal) and h, display accelerated wound-healing at D30 PI (n=5. P=0.0136). KO, knockout. Rate calculated from wound area: b, Extended Data Fig. 3a; c, see source data; g Extended Data Fig. 3h; h, Extended Data Fig. 3i. Plots depict mean ± SEM. Scale bars: a, 200 µm; e, g, 50 µm. n=x biologically independent animals. Experiments replicated ≥ 2 times and significance was determined using a two-tailed t-test (95% confidence). Non-significant (ns, P>0.05).
Figure 3
Figure 3. EpSCs possess memory of inflammation at the chromatin level
a, Heatmaps (two tailed t-test, P<0.05) and Venn diagrams of ATAC-seq signals (500 bp genomic windows) of D6 inflamed versus naïve EpSCs (n=3). Numbers of genomic windows displayed (n) below heatmaps; peak percentages are indicated on diagrams. b, Venn diagram of ATAC-seq peaks (numbers indicated on diagram) unique to D6 IMQ and D30 post-IMQ EpSCs (random permutation, P<10−4). c, Snapshot of genomic loci whose chromatin-accessible peaks are opened by inflammation at D6 and persist up to 180D following resolution. d, PANTHER pathways analysis of 2041 shared, inflammation-induced peaks between D6 IMQ and D30 post-IMQ EpSCs. e, Transcription factor motif enrichment within shared peaks in (b) (n=3. cumulative binomial distributions, P<10−12). f, Epidermal STAT3 activation (pSTAT3Y705) in D6 inflamed and D30-PI skin 12hrs post-wounding, but not in D30-PI unwounded skin (n=3).Wound bed (w.b.). Scale bars: 50 µm. n=x biologically independent animals. Experiments replicated ≥ 2 times.
Figure 4
Figure 4. EpSC memory encodes inflammatory sensors that rapidly reactivate to enhance secondary wound responses
a, Model of EpSC inflammatory memory. InfTFs, inflammation induced transcription factors. b, Persisting accessible chromatin domains induced by inflammation, can drive inflammation-specific EGFP reporter activity in EpSCs in vivo. n=2. Schematic of in utero lentiviral transduction of skin epithelium. Pgk-H2B-RFP expression marks transduced EpSCs. Scale bar, 50 µm. Lines demarcate dermo-epidermal border. c, Differences between transcriptomes of D6 inflamed or D30 post-inflamed (PI) ± wounding, relative to respective control EpSCs. Shown are MA plots, number (n) of significant differentially expressed transcripts (FDR<0.05) noted on the figure and depicted by red dots (n=4). d, Of 140 transcripts upregulated rapidly after wounding of PI versus control skin (grey), 73 (dark grey) were encoded by genes (red) associated with chromatin accessible domains that were unique to post-inflamed EpSCs. (random permutation, P<10−4). e, Ingenuity Pathways Analysis of up-regulated transcripts in post-inflamed 12 hr wound edge EpSCs relative to control (n=4. right-tailed fisher exact test, P values plotted). f, Elevated Aim2 transcription associated with inflammation, memory and rapid wound response in post-inflamed skin, post-wounding (p.w.), (n≥2. two tailed t-test, D6 and 12hr p.w. P=<0.0001, D180 P= 0.0001). g, Aim2-null mice do not show enhanced wound healing post-inflammation (n≥2. two tailed t-test, WT P=0.0002). h, Epithelial Aim2 overexpression is sufficient to augment wound healing in naïve mice (n=2). Plots depict mean ± SEM. Rate calculated from wound area: g, Extended Data Fig. 4e; h, Extended Data Fig. 4f. KO, knockout, TRE, tetracycline response element, OE, Overexpression. n=x biologically independent animals. Experiments replicated ≥ 2 times.
Figure 5
Figure 5. Dissecting the downstream effectors of the AIM2 inflammasome in enhancing wound re-epithelialization of inflammation-experienced skin
a, Elevated levels of Casp1 transcript (P=0.0025) and CASP1 activity (P=0.0014) in D30 post-inflamed skin, 12hr after wounding (n=3). b, Schematic depicts the experiment. Ac-YVAD-cmk reduces CASP1 activity (left) and wound repair rate (right) post-inflammation to control wound levels (CASP1 activity n=2, wound repair, n=5. P=0.0018, non-significant (ns, P>0.05)). c, Elevated levels of Il18 transcripts (n=3, P=0.0014), IL18 (n=4, P=0.0202) and IL1β protein (n=3, P=0.0073) in PI skin post-wounding, but not Il1β transcripts (n=2). d, Enhanced injury response of post-inflamed skin in the absence of Il18 (n=3. Wildtype (WT) P=0.0146; knockout (KO) P=0.0019). e, Absence of IL1β-signaling, achieved in Il1r1-null mice, abrogates the enhanced injury response of post-inflamed skin (n=4. WT P=0.0155; KO P=0.0086) f, Recombinant IL1β, but not IL18 (50 ng/ml), accelerates outgrowth of K14+ keratinocytes in D5 ex vivo skin explants. Dotted and red lines mark outgrowth border and distance, respectively (n=3; 3 technical replicates/mouse. P=0.0128). Scale bars: 500 µm. g, Anti-IL1R1 treatment reverses the wound repair advantage conferred by epidermal Aim2 overexpression in naïve mice. intraperitoneal (i.p.) (n=3. Control IgG P=0.0055, α-IL1R1 P=0.0007). h, Summary of the downstream AIM2 effectors in post-inflamed skin, ASC, Apoptosis-associated speck-like protein containing a CARD. Rate calculated from wound area: b, Extended Data Fig. 6d; d, Extended Data Fig. 6e; e, Extended Data Fig. 6f; g, Extended Data Fig. 6g. Plots depict mean ± SEM. n=x biologically independent animals. Experiments a–f replicated ≥ 2 times, g was performed 1 time. Significance determined using two-tailed t-test (95% confidence). Non-significant (ns, P>0.05).

Comment in

References

    1. Blanpain C, Fuchs E. Plasticity of epithelial stem cells in tissue regeneration. Science. 2014;344:1242281–1242281. - PMC - PubMed
    1. Alcolea MP, Jones PH. Lineage Analysis of Epidermal Stem Cells. Cold Spring Harbor Perspectives in Medicine. 2014;4:a015206–a015206. - PMC - PubMed
    1. Adam RC, et al. Pioneer factors govern super-enhancer dynamics in stem cell plasticity and lineage choice. Nature. 2015;521:366–370. - PMC - PubMed
    1. Hsu Y-C, Li L, Fuchs E. Emerging interactions between skin stem cells and their niches. Nat. Med. 2014;20:847–856. - PMC - PubMed
    1. Kanneganti T-D, et al. Bacterial RNA and small antiviral compounds activate caspase-1 through cryopyrin/Nalp3. Nature. 2006;440:233–236. - PubMed

Publication types

MeSH terms