. 2017 Nov 2;551(7678):45-50.
doi: 10.1038/nature24287. Epub 2017 Oct 18.

The dynamics of molecular evolution over 60,000 generations

Affiliations

The dynamics of molecular evolution over 60,000 generations

Benjamin H Good et al. Nature. .

Abstract

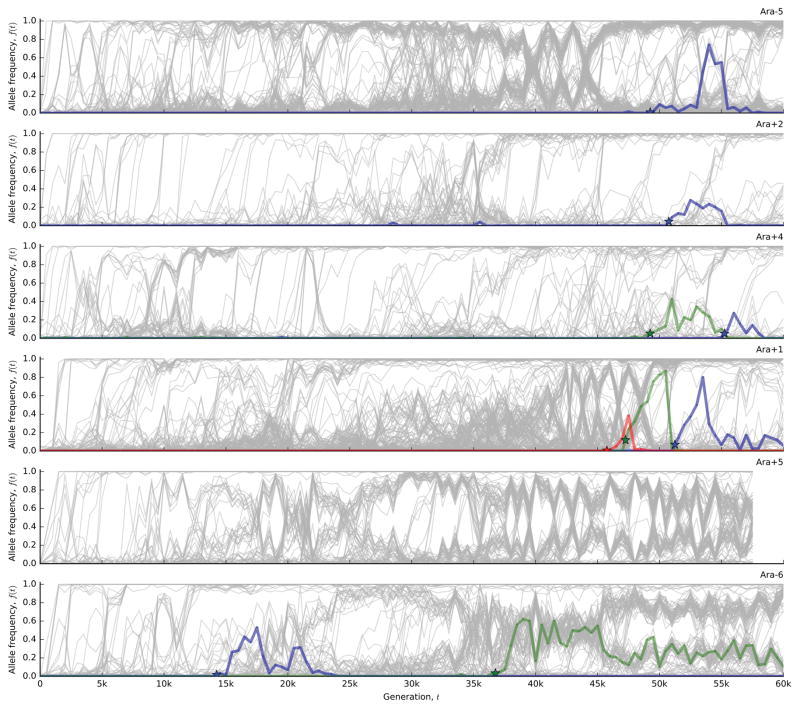
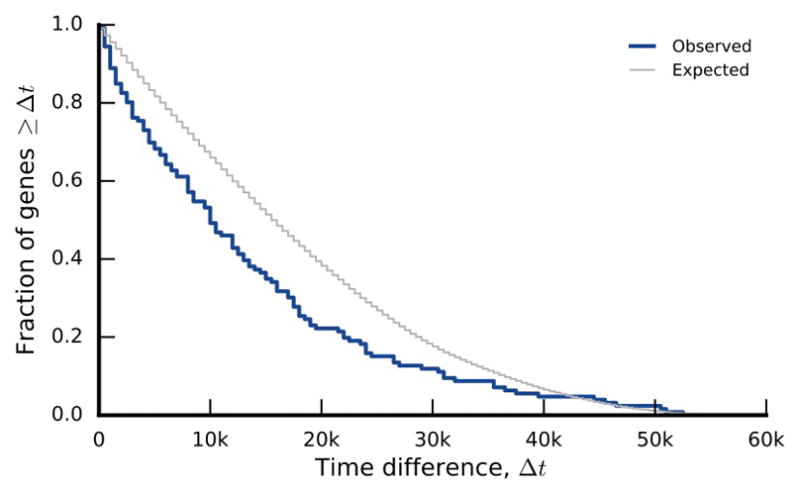
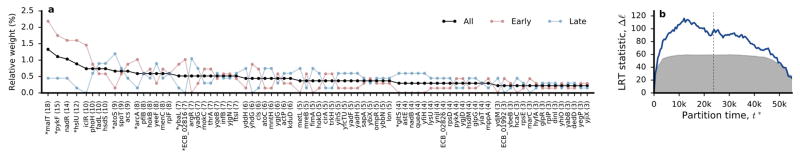
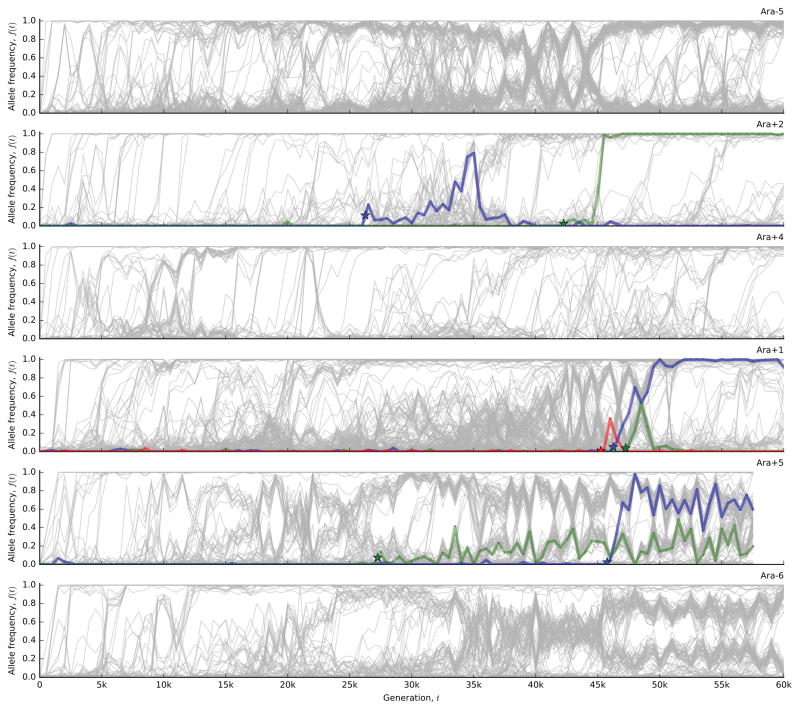
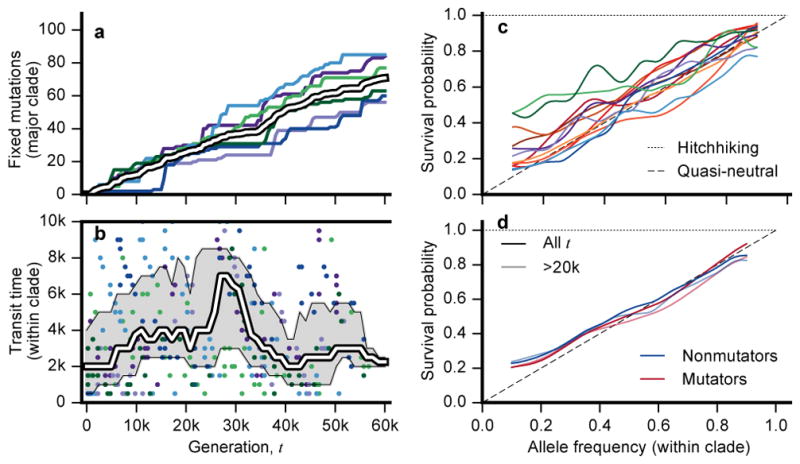
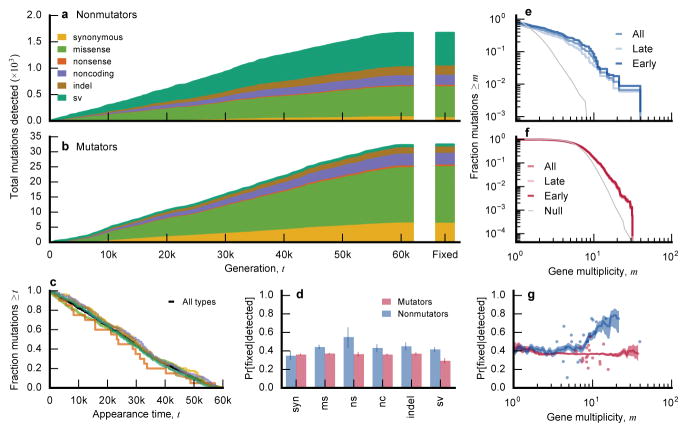
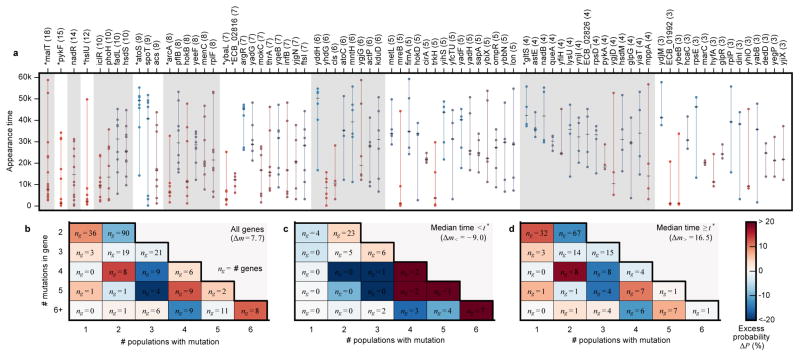
The outcomes of evolution are determined by a stochastic dynamical process that governs how mutations arise and spread through a population. However, it is difficult to observe these dynamics directly over long periods and across entire genomes. Here we analyse the dynamics of molecular evolution in twelve experimental populations of Escherichia coli, using whole-genome metagenomic sequencing at five hundred-generation intervals through sixty thousand generations. Although the rate of fitness gain declines over time, molecular evolution is characterized by signatures of rapid adaptation throughout the duration of the experiment, with multiple beneficial variants simultaneously competing for dominance in each population. Interactions between ecological and evolutionary processes play an important role, as long-term quasi-stable coexistence arises spontaneously in most populations, and evolution continues within each clade. We also present evidence that the targets of natural selection change over time, as epistasis and historical contingency alter the strength of selection on different genes. Together, these results show that long-term adaptation to a constant environment can be a more complex and dynamic process than is often assumed.


Conflict of interest statement

The authors declare no competing financial interests.

Figures

Extended Data Figure 1
Extended Data Figure 1. Between-line variability in the rate of mutation accumulation
a, coarse-grained mutation gains ΔMp,k (Supplementary Information section 5.1) for the six nonmutator populations, plotted using the same color scheme as Fig. 2. For comparison, the original mutation trajectories Mp(t) are shown in light grey. b, between-line variability in ΣkΔMp,k, with and without the Ara+1 population. Observed values are indicated as symbols, while the solid lines show the corresponding null distribution obtained by randomly permuting ΔMp,k across the six populations.
Extended Data Figure 2
Extended Data Figure 2. Nonsynonymous vs synonymous mutations
The ratio of nonsynonymous to synonymous mutations (dN/dS) in the entire pool of detected mutations, as well as the subset that fixed within their respective clades. Symbols denote individual populations, while bars denote pooled estimates across either the nonmutator or mutator populations. In panel a, this ratio is normalized by the relative number of synonymous and nonsynonymous sites. Panel b corrects for the observed spectrum of single-nucleotide mutations in each population.
Extended Data Figure 3
Extended Data Figure 3. Parallelism at the nucleotide level
The distribution of nucleotide multiplicity (Supplementary Information section 6.2) for the nonmutator (a) and mutator (b) populations. Observed data are shown in colored lines, while the null expectations are shown in grey for comparison.
Extended Data Figure 4
Extended Data Figure 4. Mutations in hslU
Mutations that arose in the hslU gene in the six nonmutator populations. The inferred appearance times are indicated by the star symbols.
Extended Data Figure 5
Extended Data Figure 5. Mutations in atoS
Mutations that arose in the atoS gene in the six nonmutator populations. The inferred appearance times are indicated by the star symbols.
Extended Data Figure 6
Extended Data Figure 6. Temporal similarity among two-hit genes
The distribution of the difference between the earliest and latest appearance times in genes with exactly two detected mutations in the nonmutator lines. The null distribution is obtained by randomly permuting appearance times among the 2-hit genes.
Extended Data Figure 7
Extended Data Figure 7. Realized mutation spectrum in different time windows
a, Fraction of mutations contributed by each gene in Fig. 6a, including time windows before and after the median appearance time of all mutations in those genes. b, Differences between the early and late distributions in (a) as a function the partition time t*. Dashed line denotes the median appearance time used to divide in (a). Solid line shows the value of the likelihood ratio test (LRT) between these two distributions for different choices of t* (Supplementary Information 6.3.2). Shaded region represents a 95% confidence interval obtained by randomly permuting appearance times across the subset of genes in (a) for 10,000 bootstrap iterations.
Extended Data Figure 8
Extended Data Figure 8. Mutations in argR
Mutations that arose in the argR gene in the six nonmutator populations. The inferred appearance times are indicated by the star symbols.
Extended Data Figure 9
Extended Data Figure 9. Missed opportunities
Net missed opportunities in the nonmutator populations as a function of the partition time t*. Lines denote the net missed opportunities for genes with median appearance times before and after t*, as defined by the formula in Supplementary Information section 6.3.3. Shaded regions denote one-sided 95% confidence intervals obtained by bootstrap resampling from the corresponding null model 10,000 times (see Supplementary Information section 6.3.3).
Figure 1
Figure 1. The dynamics of molecular evolution
Allele frequency trajectories of all de novo mutations detected in the 12 LTEE populations.
Figure 2
Figure 2. Rates of molecular evolution
a, Competitive fitness through time (Supplementary Information 2). b, Number of mutations in each population as a function of time, measured by total derived allele frequency, Mp(t). The average of the nonmutator populations is shown in white. c, Average rate of change of Mp(t) for nonmutators in 5,000-generation sliding windows. Shaded region depicts a 95% confidence interval obtained by bootstrapping replicate populations 10,000 times. d, Number of fixed mutations versus Mp(t) in nonmutators.
Figure 3
Figure 3. Long-term coexistence of competing clades
a, Output of the clade-aware HMM for population Ara–6. Major and minor clades (solid black lines) are defined by the clade frequencies at the final timepoint, while the basal clade contains mutations shared by major and minor clades. Colored lines indicate mutations within the corresponding clade in each panel; all other mutations are shown in grey. b, Estimated clade frequencies for all 12 populations (major clade in purple, minor clade in pink). Individual mutations are shown in grey.
Figure 4
Figure 4. Evolutionary dynamics within clades
a, Number of mutations fixed within the basal or major clade through time in the nonmutator populations. Colors are the same as Fig. 2, and the ensemble average is in white. b, The transit time of each mutation in (a) as a function of its appearance time. White line shows the median across the six populations in non-overlapping 5-percentile windows, and the interquartile range of each window is in grey. c, Fixation probability as a function of current mutation frequency within its parent clade, along with expectations under quasi-neutral and hitchhiking models. Fixation probabilities are estimated using sliding frequency windows (Supplementary Information 5.3.2). d, Pooled version of (c) for mutator and nonmutator populations. Lighter lines include only timepoints from generation 20,000 and later.
Figure 5
Figure 5. Parallelism
a, b, Cumulative distribution of detected mutations of each type in nonmutator (a) and mutator (b) populations over time (sv = structural variants, including IS-mediated mutations). Bars at right depict the distribution of mutations that fixed within their respective clades. c, Distribution of appearance times for each variant type in nonmutators. d, Fraction of detected mutations of each type that fixed in nonmutator and mutator populations (blue and red, respectively). Error bars denote the 14th and 84th percentiles of the beta posterior distribution; numbers above bars indicate the sample size of mutations of each type. e, f, Fraction of all mutations (excluding synonymous mutations) in nonmutator (e) and mutator (f) populations in genes with multiplicity mi≥m. The grey line is the null distribution, obtained by randomly distributing the mutations across genes. g, Average conditional fixation probability of a mutation as a function of its gene multiplicity (in sliding windows of 0.2 log10 units) in nonmutator (blue) and mutator (red) populations. Shaded confidence intervals denote the 14th and 84th percentiles of the beta posterior distribution of each window. Fixation probabilities of the 20 most-frequently mutated genes are shown as dots.
Figure 6
Figure 6. Epistasis and contingency
a, Genes mutated ≥3 times in nonmutators with multiplicities significant at 5% FDR. Circles indicate the appearance time of each mutation, connected by a vertical line for visualization. Each gene is colored according to its median appearance time (hatch-mark). Genes with significantly non-random appearance times are marked by asterisks. b, c, d, The distribution of dispersion configurations of a gene (i.e., the total number of mutations versus the number of different populations in which they appeared) for (b) all genes and (c, d) those with median mutation appearance times before or after t* = 17,500 generations, which was chosen to maximize the number of “missed opportunities” (Supplementary Information 6.3.3).

Comment in

References

    1. Lang GI, et al. Pervasive genetic hitchhiking and clonal interference in forty evolving yeast populations. Nature. 2013;500:571–574. - PMC - PubMed
    1. Kvitek DJ, Sherlock G. Whole genome, whole population sequencing reveals that loss of signaling networks is the major adaptive strategy in a constant environment. PLoS Genetics. 2013;9:e1003972. - PMC - PubMed
    1. Barrick JE, et al. Genome evolution and adaptation in a long-term experiment with Escherichia Coli. Nature. 2009;461:1243–1247. - PubMed
    1. Tenaillon O, et al. Tempo and mode of genome evolution in a 50,000-generation experiment. Nature. 2016;536:165–170. - PMC - PubMed
    1. Miller CR, Joyce P, Wichman HA. Mutational effects and population dynamics during viral adaptation challenge current models. Genetics. 2011;187:185–202. - PMC - PubMed

Publication types