. 2017 Oct 18;12(10):e0185809.
doi: 10.1371/journal.pone.0185809. eCollection 2017.

More than 75 percent decline over 27 years in total flying insect biomass in protected areas

Affiliations

More than 75 percent decline over 27 years in total flying insect biomass in protected areas

Caspar A Hallmann et al. PLoS One. .

Abstract

Global declines in insects have sparked wide interest among scientists, politicians, and the general public. Loss of insect diversity and abundance is expected to provoke cascading effects on food webs and to jeopardize ecosystem services. Our understanding of the extent and underlying causes of this decline is based on the abundance of single species or taxonomic groups only, rather than changes in insect biomass which is more relevant for ecological functioning. Here, we used a standardized protocol to measure total insect biomass using Malaise traps, deployed over 27 years in 63 nature protection areas in Germany (96 unique location-year combinations) to infer on the status and trend of local entomofauna. Our analysis estimates a seasonal decline of 76%, and mid-summer decline of 82% in flying insect biomass over the 27 years of study. We show that this decline is apparent regardless of habitat type, while changes in weather, land use, and habitat characteristics cannot explain this overall decline. This yet unrecognized loss of insect biomass must be taken into account in evaluating declines in abundance of species depending on insects as a food source, and ecosystem functioning in the European landscape.


Conflict of interest statement

Competing Interests: The authors have declared that no competing interests exist.

Figures

Fig 1
Fig 1. Examples of operating malaise traps in protected areas in western Germany, in habitat cluster 1 (A) and cluster 2 (B) (see Materials and methods).
Fig 2
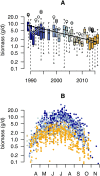
Fig 2. Temporal distribution of insect biomass.
(A) Boxplots depict the distribution of insect biomass (gram per day) pooled over all traps and catches in each year (n = 1503). Based on our final model, the grey line depicts the fitted mean (+95% posterior credible intervals) taking into account weather, landscape and habitat effects. The black line depicts the mean estimated trend as estimated with our basic model. (B) Seasonal distribution of insect biomass showing that highest insect biomass catches in mid summer show most severe declines. Color gradient in both panels range from 1989 (blue) to 2016 (orange).
Fig 3
Fig 3. Seasonal decline and phenology.
(A) Seasonal decline of mean daily insect biomass as estimated by independent month specific log-linear regressions (black bars), and our basic mixed effects model with interaction between annual rate of change and a quadratic trend for day number in season. (B), Seasonal phenology of insect biomass (seasonal quantiles of biomass at 5% intervals) across all locations revealing substantial annual variation in peak biomass (solid line) but no direction trend, suggesting no phenological changes have occurred with respect to temporal distribution of insect biomass.
Fig 4
Fig 4. Temporal distribution of insect biomass at selected locations.
(A) Daily biomass (mean ±1 se) across 26 locations sampled in multiple years (see S4 Fig for seasonal distributions). (B) Distribution of mean annual rate of decline as estimated based on plot specific log-linear models (annual trend coefficient = −0.053, sd = 0.002, i.e. 5.2% annual decline).
Fig 5
Fig 5. Marginal effects of temporal changes in considered covariates on insect biomass.
Each bar represents the rate of change in total insect biomass, as the combined effect of the relevant coefficient (Table 4) and the temporal development of each covariate independently (S2 and S3 Figs).

References

    1. Öckinger E, Smith HG. Semi-natural grasslands as population sources for pollinating insects in agricultural landscapes. Journal of Applied Ecology. 2007;44(1):50–59.
    1. Ollerton J, Winfree R, Tarrant S. How many flowering plants are pollinated by animals? Oikos. 2011;120(3):321–326. 10.1111/j.1600-0706.2010.18644.x - DOI
    1. Mattson WJ, Addy ND. Phytophagous insects as regulators of forest primary production. Science. 1975;190(4214):515–522. 10.1126/science.190.4214.515 - DOI
    1. Yang LH, Gratton C. Insects as drivers of ecosystem processes. Current Opinion in Insect Science. 2014;2:26–32. 10.1016/j.cois.2014.06.004 - DOI - PubMed
    1. Morse H D. The insectivorous bird as an adaptive strategy. Annual Review of Ecology and Systematics. 1971; p. 177–200. 10.1146/annurev.es.02.110171.001141 - DOI