. 2018 Jan 1;114(1):138-157.
doi: 10.1093/cvr/cvx206.

Loss of Protein Kinase Novel 1 (PKN1) is associated with mild systolic and diastolic contractile dysfunction, increased phospholamban Thr17 phosphorylation, and exacerbated ischaemia-reperfusion injury

Affiliations

Loss of Protein Kinase Novel 1 (PKN1) is associated with mild systolic and diastolic contractile dysfunction, increased phospholamban Thr17 phosphorylation, and exacerbated ischaemia-reperfusion injury

Asvi A Francois et al. Cardiovasc Res. .

Abstract

Aims: PKN1 is a stress-responsive protein kinase acting downstream of small GTP-binding proteins of the Rho/Rac family. The aim was to determine its role in endogenous cardioprotection.

Methods and results: Hearts from PKN1 knockout (KO) or wild type (WT) littermate control mice were perfused in Langendorff mode and subjected to global ischaemia and reperfusion (I/R). Myocardial infarct size was doubled in PKN1 KO hearts compared to WT hearts. PKN1 was basally phosphorylated on the activation loop Thr778 PDK1 target site which was unchanged during I/R. However, phosphorylation of p42/p44-MAPK was decreased in KO hearts at baseline and during I/R. In cultured neonatal rat ventricular cardiomyocytes (NRVM) and NRVM transduced with kinase dead (KD) PKN1 K644R mutant subjected to simulated ischaemia/reperfusion (sI/R), PhosTag® gel analysis showed net dephosphorylation of PKN1 during sI and early R despite Thr778 phosphorylation. siRNA knockdown of PKN1 in NRVM significantly decreased cell survival and increased cell injury by sI/R which was reversed by WT- or KD-PKN1 expression. Confocal immunofluorescence analysis of PKN1 in NRVM showed increased localization to the sarcoplasmic reticulum (SR) during sI. GC-MS/MS and immunoblot analysis of PKN1 immunoprecipitates following sI/R confirmed interaction with CamKIIδ. Co-translocation of PKN1 and CamKIIδ to the SR/membrane fraction during sI correlated with phospholamban (PLB) Thr17 phosphorylation. siRNA knockdown of PKN1 in NRVM resulted in increased basal CamKIIδ activation and increased PLB Thr17 phosphorylation only during sI. In vivo PLB Thr17 phosphorylation, Sarco-Endoplasmic Reticulum Ca2+ ATPase (SERCA2) expression and Junctophilin-2 (Jph2) expression were also basally increased in PKN1 KO hearts. Furthermore, in vivo P-V loop analysis of the beat-to-beat relationship between rate of LV pressure development or relaxation and end diastolic P (EDP) showed mild but significant systolic and diastolic dysfunction with preserved ejection fraction in PKN1 KO hearts.

Conclusion: Loss of PKN1 in vivo significantly reduces endogenous cardioprotection and increases myocardial infarct size following I/R injury. Cardioprotection by PKN1 is associated with reduced CamKIIδ-dependent PLB Thr17 phosphorylation at the SR and therefore may stabilize the coupling of SR Ca2+ handling and contractile function, independent of its kinase activity.

Keywords: Protein kinase Novel 1 (PKN1) • Cardioprotection • Infarction • CamKIIδ • Phospholamban.


Figures

Figure 1
Figure 1
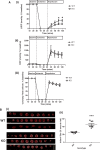
Ischaemia-Reperfusion Injury (Infarct size) is Increased in PKN1 Knockout hearts. (PanelA) Haemodynamics in WT and PKN1 KO Hearts. Hearts were stabilized during 30 min aerobic perfusion followed by 30 min global ischaemia followed by 120 min reperfusion. (i–iii): Haemodynamic parameters of isolated buffer-perfused hearts from matched littermate wild type (WT) and PKN1 knockout (KO). Values are presented as mean ± SEM (n = 8) for left ventricular developed pressure (LVDP), end diastolic pressure (EDP), and coronary flow (CF) recorded following 30 min stabilization, 30 min global ischaemia, and 120 min reperfusion. LVDP was significantly reduced in the PKN1 KO hearts. Statistical analysis was by Two-Way ANOVA with a Bonferroni post-hoc test, where significance is expressed as *P ≤ 0.05 vs. WT. (PanelB) (i): Representative images showing triphenyl tetrazolium chloride (TTC) staining of individual WT and PKN1 KO heart slices. Viable tissue is stained red and non-viable (necrotic) tissue appears white. (ii): Infarct volume as a percentage of area at risk (total heart volume) in age matched male littermate WT and PKN1 KO hearts subjected to 30 min global ischaemia and 2 h reperfusion. Results are expressed as mean ± SEM (n = 8). Statistical analysis was by One Way ANOVA with a Newman-Keuls post-hoc test, where ***P ≤ 0.001.
Figure 2
Figure 2
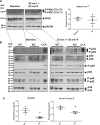
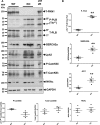
PKN1 Thr778 Phosphorylation is Unchanged During Ischaemia-reperfusion, but p42/p44-MAPK Phosphorylation is Reduced in PKN1 Knockout Hearts. (PanelA) Wild type c57BL/6 mouse hearts were perfused in Langendorff mode and were subjected to 30 min global ischaemia and 20 min reperfusion. Hearts were harvested after 30 min of baseline perfusion or 30 min SI + 20 min reperfusion by freeze-clamping followed by homogenization and processing for SDS-PAGE and Western immunoblotting as described in the methods section. PKN1 activation loop phosphorylation (Thr778) was assessed by probing blots with anti-phospho-PKN1/2 (Thr774/Thr816) or anti-total PKN1 antibody. Total GAPDH was used as an additional control for loading. Phospho-PKN was quantitated by densitometry and normalized to total PKN and compared using a two-tailed unpaired t-test (n = 3 individual hearts). (PanelB) Matched littermate wild type (WT) and PKN1 knockout (KO) mouse hearts were perfused in Langendorff mode and subjected to 30 min global ischaemia followed by 20 min reperfusion. Hearts were harvested and processed as above and MAPK and SAPK activation was assessed using antibodies recognizing dually phosphorylated p46/p54-SAPK (JNK), p38-MAPK, and p42/p44-MAPK (ERK1/2) (upper panels) or the corresponding total protein (lower panels). (PanelC) Phospho-p42/p44-MAPKs (P-ERK1/2) were quantitated by densitometry and normalized to total p42/p44-MAPKs (T-ERK1/2) and compared using a two-tailed unpaired t-test (n = 3 individual hearts). Each sample represents a different lysate prepared from individual hearts exposed independently to ischaemia/reperfusion. Lysates from NRVMs treated with 50 nM calyculin A (CLA) were used as a positive control for phospho-p42/44-MAPK, phospho-p46/p54-SAPK (JNK), and phospho-p38-MAPK.
Figure 3
Figure 3
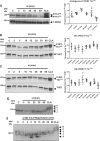
Thr774/778 Phosphorylation of PKN1 is Unchanged but Net Dephosphorylation Occurs on Other Sites During Simulated Ischaemia/Reperfusion (sI/R) in Isolated Cardiomyocytes. (Panel A) NRVMs were treated with SI for up to 1 h and harvested at the indicated times in 2x sample buffer. Phosphorylation of endogenous PKN1 was analysed by Western immunoblotting and probed with antibodies against phospho-PKN1 (Thr778) or total PKN1. (Panel B) NRVMs were transfected with wild type- (WT) hPKN1-FLAG, treated with SI for up to 60 min and harvested at the indicated times. Samples were analysed by Western immunolotting to determine hPKN1 Thr774 phosphorylation and compared to levels of total PKN1 (T-hPKN1). Phospho blots were stripped and re-probed with anti-total PKN1. (Panel C) NRVMs were transfected with kinase dead (KD: K644R)-hPKN1-FLAG, treated with SI for up to 60 min and harvested at the indicated times. Samples were analysed by Western immunolotting to determine hPKN1 Thr774 phosphorylation and compared to levels of total PKN1 (T-hPKN1). Phospho blots were stripped and re-probed with anti-total PKN1. (Panel D) NRVMs were treated with SI for up to 1 h and harvested as indicated in 2x sample buffer and analysed by PhosTag® SDS-PAGE followed by western immunoblotting as described in the materials and methods. Immunoblots were probed with monoclonal antibody against total PKN1. (Panel E) NRVMs were treated with SI for 1 h, ‘reperfused’ and harvested at the indicated times of ‘reperfusion’ and analysed by PhosTag® SDS-PAGE followed by Western immunoblotting. Immunoblots were probed with monoclonal antibody against total PKN1 as for panel A. For all panels representative images are shown for one of three independent experiments. In each case, NRVMs were treated with 50 nM CLA as a positive control for maximal PKN1 phosphorylation.
Figure 4
Figure 4
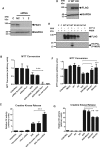
PKN1 is Protective Against Simulated Ischaemia/Reperfusion in Cardiomyocytes. NRVMs in which PKN1 was either silenced by siRNA treatment (PanelsA–C) or overexpressed by adenoviral infection (WT-hPKN1-FLAG or KD-hPKN1-FLAG) (PanelsD–G) were exposed to 1 h SI followed by 18 h of ‘reperfusion’. (PanelA) The efficacy of siRNA knockdown of PKN1 as analysed by western blot. (PanelD): The efficacy of overexpression of FLAG-tagged wild type (WT) and kinase dead (KD) PKN1 as assessed by western blot using an anti-FLAG antibody. (PanelE) Cells were transfected with WT- or KD-hPKN1-FLAG and treated with 0.5 M sorbitol for 30 min to activate PKN1. Cell lysates were prepared and IPd with anti-FLAG. Cell lysates were prepared and in vitro kinase assays performed using ATPγS showing kinase activity of WT-hPKN-FLAG but not KD-hPKN1-FLAG towards a myelin basic protein (MBP) substrate. An anti-phosphothioate antibody was used for detection of MBP phosphorylation following Western blotting. (PanelsB and F) Cell viability was assessed by the conversion of MTT as described in the materials and methods section Results represent mean +/- SEM from four individual experiments in which each group was tested in triplicate. Values from the control group were set as 1 and test groups were normalized to this. Statistical significance of differences compared with SI/R: *P ≤ 0.05, **P ≤ 0.01, ***P ≤ 0.001. Cell injury was assessed by the activity of CPK as described in the materials and methods section (PanelsC and G). Results represent mean +/- SEM from four individual experiments in which each group was tested in triplicate. Values from the control group were set as 1 and test groups were normalized to this. Statistical significance of differences compared with SI/R: *P ≤ 0.05, **P ≤ 0.01, ***P ≤ 0.001 using One-Way ANOVA with a Newman-Keuls post-hoc test.
Figure 5
Figure 5
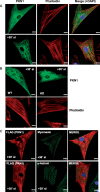
Confocal Immunofluorescence Analysis of PKN1 Shows a Striated Redistribution During Simulated Ischaemia. (PanelA) Translocation of PKN1 during SI. NRVMs infected with adenovirus expressing wild type (WT)-PKN1-FLAG and were either untreated (control) or subjected to 30 min SI prior to fixation. Slides were stained with mouse monoclonal anti-PKN1 antibody (green) and counterstained with FITC-conjugated phalloidin (red) to visualize filamentous (F)-actin and with DAPI (blue) to visualize nuclei. Slides were analysed by confocal microscopy in the separate green, red, and blue channels and a merged image is shown for the overlay of the individual images. (PanelB) The localization of WT-PKN1-FLAG and KD-PKN1-FLAG was compared during SI. NRVMs were infected with adenoviruses expressing WT-PKN1-FLAG (WT) or KD-PKN1-FLAG (KD) and treated with SI for 30 min prior to fixing and mounting. Slides were stained with mouse monoclonal anti-PKN1 antibody (green) and counterstained with phalloidin (red). (PanelC) NRVMs infected with adenovirus expressing wild type (WT)-PKN1-FLAG and were subjected to 30 min SI prior to fixation. Slides were stained with rabbit polyclonal anti-FLAG antibody (red) and counterstained with mouse monoclonal anti-myomesin antibody (green) or mouse monoclonal anti-α-actinin antibody (green), to visualize the M-band and Z-discs, respectively, and with DAPI (blue) to visualize nuclei. Slides were analysed by confocal microscopy in the separate green, red, and blue channels and a merged image is shown for the overlay of the individual images. Scale bar equals 10 μm.
Figure 6
Figure 6
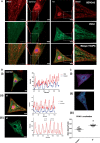
Confocal Immunofluorescence Analysis of PKN1 Shows a Sarcoplasmic Reticulum Localization During simulated Ischaemia. (PanelA) The co-localization of PKN1 and Serca2a in NRVMs was compared during SI. NRVMs were infected with adenovirus expressing WT-PKN1-FLAG and were either untreated (control) or subjected to 30 min SI prior to fixation and slide mounting. Slides were stained with mouse monoclonal anti-PKN1 antibody (green) and counterstained with Serca2a antibody to stain the SR membrane (red) and DAPI (blue). Slides were analysed by confocal microscopy in the separate green, red and blue channels and a merged image is shown for the overlay of the individual images. Scale bar is 10 μm. (PanelB) The coincidence of PKN1 and SERCA2 localization was determined during simulated ischaemia. Confocal images representing PKN1 in NRVMs under control conditions (i) and after 30’ SI (ii). The line charts (right panels) show the intensity plots of the Cy3 (PKN1) signal over the regions shown by a white line on the images. The distance between two major peaks and a major peak and minor peak are illustrated in the right panel. In (iii) the line chart shows the intensity plots of the Cy3 (PKN1) and Cy5 (SERCA2a) signals over the region shown by a white line on the merged image. In all cases, experiments were repeated four times and >10 fields analysed per treatment. (Panel C) Quantitation of PKN1 and SERCA2 co-localization. Panels (i) and (ii) show the masks generated for calculation of total and SERCA2 coincident PKN1. Panel (iii) shows quantitation of the fraction of SR coincident PKN1 normalized to total (cyto) cellular distributed PKN1 where *P ≤ 0.05 vs. control (n = 9 per group) using a nested ANOVA with three batches of cells each in triplicate for each group.
Figure 7
Figure 7
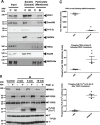
Association of PKN1 with Sarco-Endoplasmic Reticulum Binding Partners Correlates with CamKIIδ and Phospholamban Thr 17 Phosphorylation During Simulated Ischaemia. (PanelA) NRVM were either untreated or subjected to sI and fractionated into soluble and membrane fractions. Fractions were subjected to SDS-PAGE and Western blotting and probed for PKN1 and its binding partners CamKIIδ, 14-3-3γ, and NEDD4 or compartmental markers Na/K-ATPase (sarcolemmal membrane), Hsp90 (cytosol), and SERCA2a (SR membrane). (PanelB) NRVM in which PKN1 was knocked down using siRNA were compared to control cells at different times of simulated ischaemia (sI) and analysed for phosphorylation of CamKIIδ (Thr287) or phospholamban (PLB: Thr17). For all panels representative images are shown for one of three independent experiments. (PanelC) Quantitation of PKN1, phosphor-CamKIIδ (Thr287) and phosphor-PLB (Thr17) at 5 min of sI following treatment with negative control (+NC) siRNA or PKN1 siRNA (+PKN1si). Phosphor-CamKIIδ and phosphor-PLB were normalized to total CamKIIδ and total PLB, respectively. *P ≤ 0.05 or **P ≤ 0.001 (n = 3) unpaired students t-test.
Figure 8
Figure 8
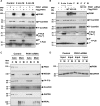
CamKIIδ and Phospholamban Thr 17 Phosphorylation Are increased Following Knockdown of PKN1. (Panel A) NRVM in which PKN1 was either knocked down using siRNA or overexpressed (Flag-PKN1) were compared to control cells at 2 min or 5 min of simulated ischaemia (sI) and analysed for phosphorylation of CamKIIδ (Thr287) or phospholamban (PLB: Thr17). (Panel B) NRVM overexpression of wild type (WT) or kinase dead K644R (KD) PKN1 were compared at 5 min of simulated ischaemia (sI) and analysed for phosphorylation of CamKIIδ (Thr287) or phospholamban (PLB: Thr17). (Panel C) NRVM in which PKN1 was knocked down using siRNA were treated with sI/R and fractionated into soluble and membrane and then analysed for binding partners CamKIIδ, 14-3-3γ and NEDD4 or compartmental markers Na/K-ATPase (sarcolemmal membrane), Hsp90 (cytosol), and SERCA2a (SR membrane). (Panel D) Input material for comparison or protein loading. For all panels, representative images are shown for one of three independent experiments.
Figure 9
Figure 9
Phospholamban Thr 17 , SERCA2a and Junctophilin-2 Levels are Increased in PKN1 Knockout Hearts. Hearts were isolated from wild type (WT) and PKN1 knockout (KO) mice, subjected to SDS-PAGE and Western blotting. (Panel A) Total PKN1, phospho- (Thr17) and total phospholamban (PLB), SERCA2a, phospho- (Thr287) and total CamKIIδ, junctophilin-2 (Jph2) and the Na+/K+ ATPase (NKAα). GAPDH was used as a loading control. (Panel B) Quantitative analysis of levels and statistical analysis using an unpaired t-test where **P ≤ 0.01. Proteins were quantitated by densitometry and normalized to total GAPDH and compared using a two-tailed unpaired t-test (n = 4 individual hearts). Each sample represents a different lysate prepared from an individual heart.
Figure 10
Figure 10
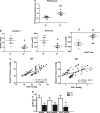
Echocardiographic and P-V Loop Analysis of Cardiac Contractile Function Shows Mild Diastolic Dysfunction in PKN1 KO Hearts. (Panel A) Differences in left ventricular (LV) posterior wall thickness at diastole (PWTD) between wild type (WT: n = 7) and knockout (KO: n = 5) mice derived from Doppler echocardiography. (Panel B) Relationships between systolic pressure (SP), maximal rate of contraction (dP/dT max) and maximal rate of relaxation (dP/dT min) and end diastolic pressure (EDP) in WT (n = 4) and PKN1 KO (n = 5) hearts derived from PV loop analysis. (Panel C) Correlation of beat-to-beat differences in LV SP vs. EDP for a single WT and PKN1 KO mouse derived from PV loop analysis. (Panel D) Comparison of correlation coefficients (R2) for SP/EDP, dP/dT max/EDP, and dP/dT min/EDP for WT (n = 4) and PKN1 KO (n = 5) mice derived from PV loop analysis.

Similar articles

Cited by

References

    1. Simkhovich BZ, Przyklenk K, Kloner RA.. Role of protein kinase C in ischemic ‘conditioning’: from first evidence to current perspectives. J Cardiovasc Pharmacol Ther 2013;18:525–532. - PubMed
    1. Ping P, Zhang J, Cao X, Li RC, Kong D, Tang XL, Qiu Y, Manchikalapudi S, Auchampach JA, Black RG, Bolli R.. PKC-dependent activation of p44/p42 MAPKs during myocardial ischemia-reperfusion in conscious rabbits. Am J Physiol 1999;276:H1468–H1481. - PubMed
    1. Punn A, Mockridge JW, Farooqui S, Marber MS, Heads RJ.. Sustained activation of p42/p44 mitogen-activated protein kinase during recovery from simulated ischaemia mediates adaptive cytoprotection in cardiomyocytes. Biochem J 2000;350 Pt 3:891–899. - PMC - PubMed
    1. Mockridge JW, Marber MS, Heads RJ.. Activation of Akt during simulated ischemia/reperfusion in cardiac myocytes. Biochem Biophys Res Commun 2000;270:947–952. - PubMed
    1. Hausenloy DJ, Mocanu MM, Yellon DM.. Cross-talk between the survival kinases during early reperfusion: its contribution to ischemic preconditioning. Cardiovasc Res 2004;63:305–312. - PubMed

Publication types

MeSH terms