. 2017 Oct 17;21(3):798-812.
doi: 10.1016/j.celrep.2017.09.071.

Revealing the Determinants of Widespread Alternative Splicing Perturbation in Cancer

Affiliations

Revealing the Determinants of Widespread Alternative Splicing Perturbation in Cancer

Yongsheng Li et al. Cell Rep. .

Abstract

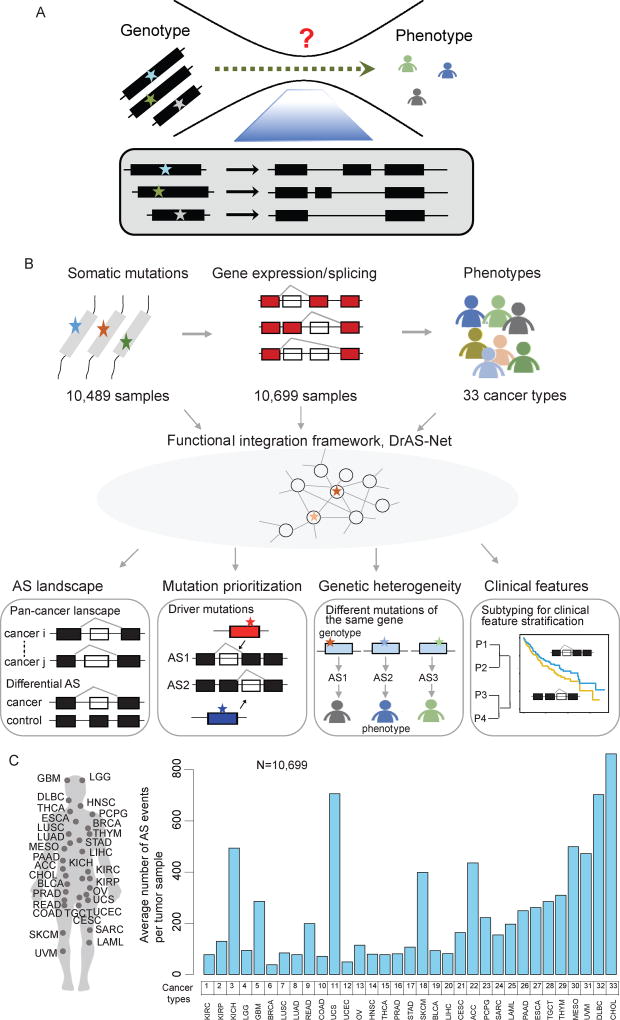
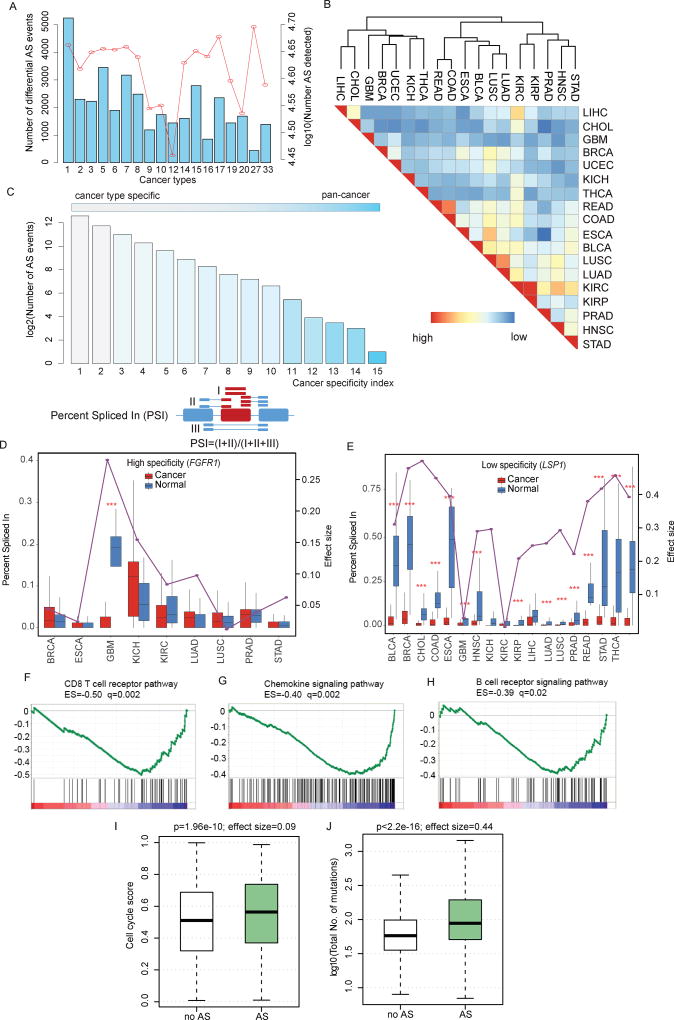
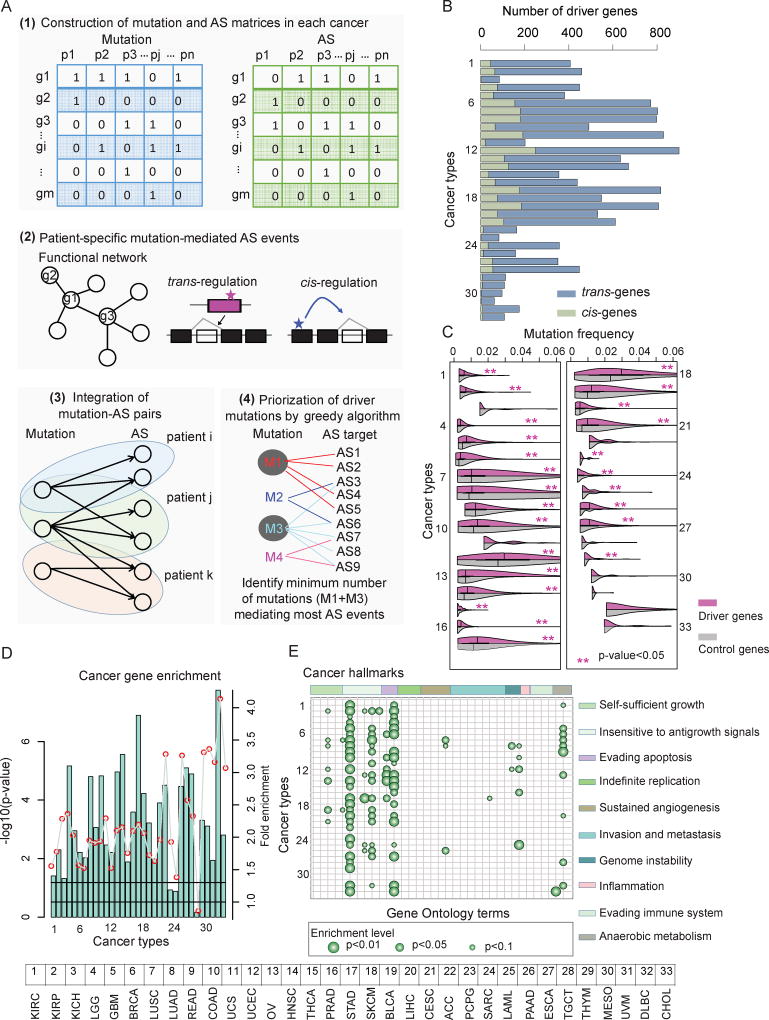
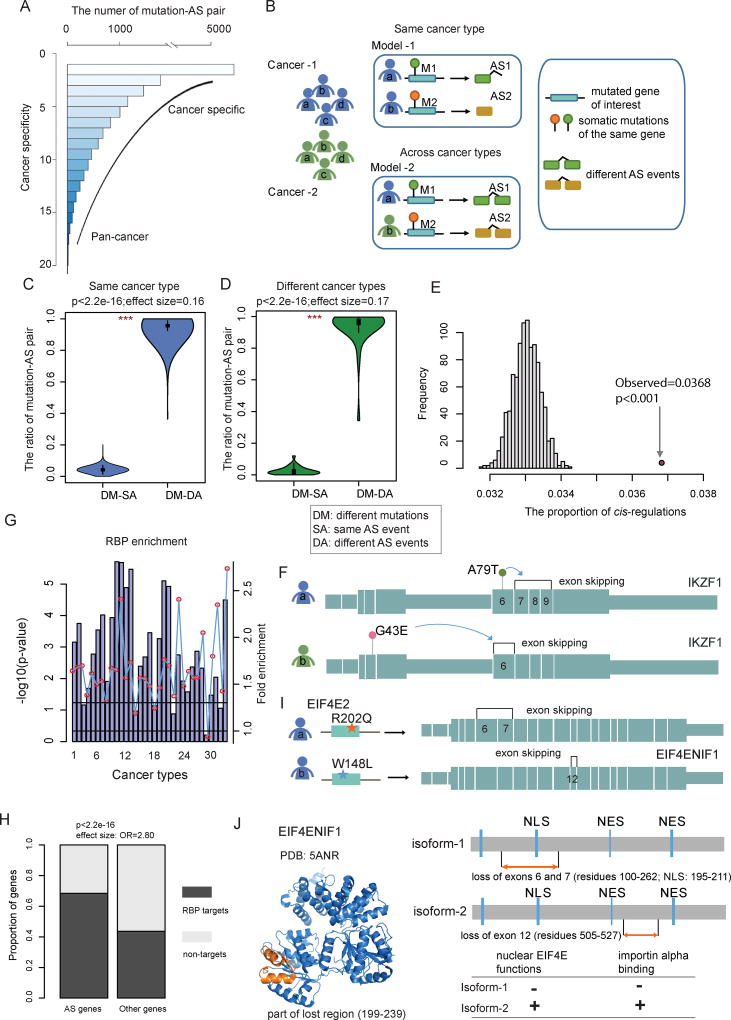
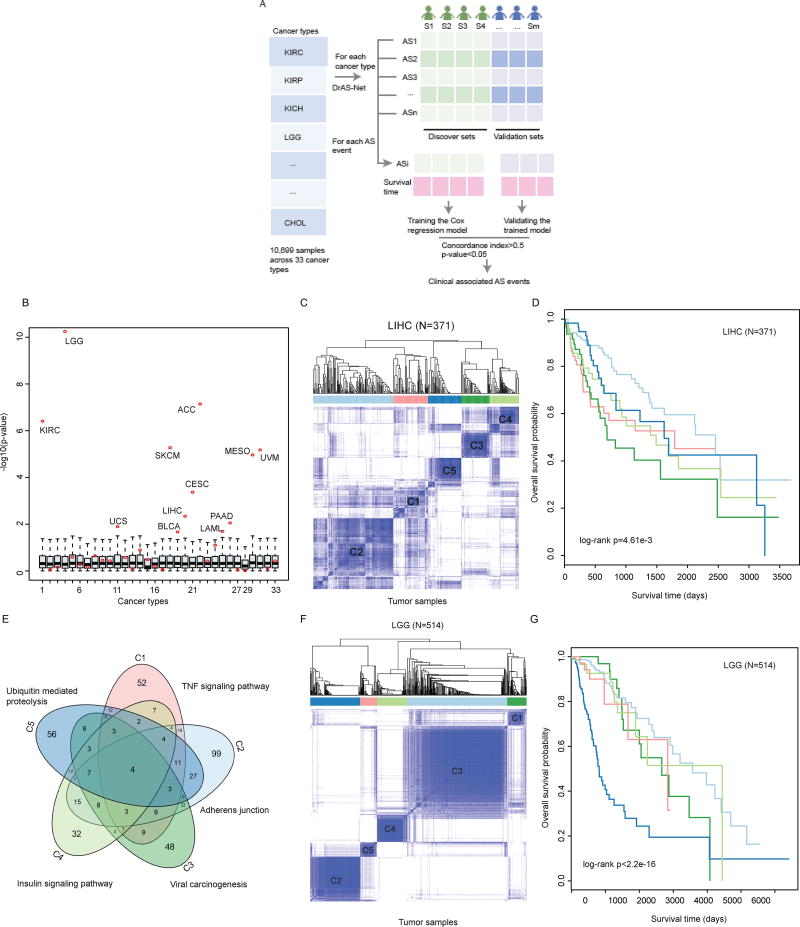
It is increasingly appreciated that alternative splicing plays a key role in generating functional specificity and diversity in cancer. However, the mechanisms by which cancer mutations perturb splicing remain unknown. Here, we developed a network-based strategy, DrAS-Net, to investigate more than 2.5 million variants across cancer types and link somatic mutations with cancer-specific splicing events. We identified more than 40,000 driver variant candidates and their 80,000 putative splicing targets deregulated in 33 cancer types and inferred their functional impact. Strikingly, tumors with splicing perturbations show reduced expression of immune system-related genes and increased expression of cell proliferation markers. Tumors harboring different mutations in the same gene often exhibit distinct splicing perturbations. Further stratification of 10,000 patients based on their mutation-splicing relationships identifies subtypes with distinct clinical features, including survival rates. Our work reveals how single-nucleotide changes can alter the repertoires of splicing isoforms, providing insights into oncogenic mechanisms for precision medicine.

Keywords: DrAS-Net; Network biology; alternative splicing; bioinformatics; cancer; computational biology; gene regulation; genotype-phenotype relationships; somatic mutations; systems biology.


Figures

Figure 1
Figure 1. Systematic Characterization of Mutation-Mediated Alternative Splicing Events across 33 Cancer Types
(A) Alternative splicing (AS) underlies the complexity of genotype-phenotype relationships. (B) Flowchart of the mutation-mediated alternative splicing (AS) analysis in cancer. Genome-wide mutational profiles of 10,489 samples and AS data from 10,699 samples across 33 types of cancer are integrated into functional networks. Four types of analyses are shown: I) Identification of genome-wide AS alternations in each type of cancer. Differential AS events are identified as cancer-specific splicing compared to controls; II) Prioritization of driver somatic mutations based on the functional networks. The functional importance of mutations is evaluated; III) Proposed mutation-AS model to explain principles of genetic heterogeneity; IV) Clustering analysis based on AS to identify cancer subtypes with distinct clinical features. P, patient. (C) The average number of AS events per tumor detected in each cancer type from a total of 10,699 samples. See also Table S1.
Figure 2
Figure 2. The Alternative Splicing Landscape in Human Cancer
(A) Number of detected AS events and differential AS events in each cancer. The red line corresponding to the right y-axis indicates the total number of AS events detected in each cancer type, while the blue bars corresponding to the left y-axis show the number of differential AS events in each cancer (n=18). The numbering of cancer types on the x-axis is the same as Figure 1. (B) Clustering of cancer types based on the similarity of differential AS patterns. This similarity is computed as the overlap divided by the minimum number of differential AS events between two cancer types. Red and blue colors indicate high and low similarity, respectively. Cancer types of similar tissue origins are grouped together. (C) Distribution of differential AS events over a wide range of cancer specificity indices. Cancer specificity index is defined as the number of cancer types where a given differential AS occurs; the lower the index, the more specific). Cancer specificity index ranges from 1 (white) to 15 (blue). (D) ‘Percent spliced in’ (PSI) index distribution of cancer type-specific differential alternative splicing (FGFR1) events in cancer versus normal samples. PSI index indicates how efficiently sequences are spliced into transcripts. Red boxplots indicate PSI distribution in cancer samples while blue boxplots indicate PSI distribution in normal samples. (E) PSI index distribution of promiscuous differential alternative splicing (LSP1) across multiple cancer types. (F–H) RNA-seq analysis was performed comparing tumors with versus without differential AS events (pan-cancer analysis), considering tumor type as a covariate. GSEA plots, enrichment scores (ES), and false discovery rates (FDR; q) are shown for representative gene sets depleted in tumors harboring differential AS events. (I–J) Relationships between the differential AS profiles and cell cycle signature and mutation load predictors reported recently. In the box plots, tumors are divided into those that carry perturbed AS events (green) and those that do not (gray). See also Figure S1–2 and Table S2.
Figure 3
Figure 3. Identification of Drivers based on Alternative Splicing Perturbations across Cancer Types
(A) The network-based framework to identify driver mutations and their mediated AS targets. Firstly, mutation (blue) and differential AS (green) matrices are constructed. Next, patient-specific mutation-mediated AS events are identified based functional network structure. All mutation-AS pairs are assembled as a bi-graph and a greedy search method is used to identify driver mutations and AS events. (B) Number of driver genes identified in each cancer. The light blue bars indicate the number of trans-genes while the light green bars indicate the cis-genes. (C) Mutation frequency of driver genes and randomly selected genes. P-values (Wilcoxon rank-sum test) less than 0.05 were marked with red stars. Purple boxes indicate the distribution for candidate driver genes, while gray boxes indicate the distribution of background control (random genes). (D) P-values (log10 transformation, hypergeometric test) for driver gene enrichment analysis for Cancer Census Genes across cancer types. (E) Enrichment analysis of driver genes for cancer hallmarks. Each column indicates a cancer hallmark-related Gene Ontology (GO) term while each row indicates a type of cancer. GO terms are ranked based on the hallmarks they belong to. Bigger dots indicate small p-values (hypergeometric test). The ten hallmarks from left to right: self-sufficiency in growth signals; insensitivity to antigrowth signals; evading apoptosis; limitless replicative potential; sustained angiogenesis; tissue invasion and metastasis; genome instability and mutation; tumor-promoting inflammation; evading immune detection; and reprogramming energy metabolism. The numbering of cancer types (B through E) is the same as in Figure 1. See also Figure S3 and Table S3.
Figure 4
Figure 4. Somatic Mutation-Mediated Alternative Splicing Helps Explain Genetic Heterogeneity
(A) Frequency of mutated gene-AS gene pairs across cancer types. The lower the cancer specificity index, the more cancer type-specific. Higher specificity index indicates a more spread-out pan-cancer manner. The majority of pairs are cancer specific while a small subset is found in multiple cancer types. (B) The proposed models to explain genetic heterogeneity in the same cancer type or across cancer types. Model-1: different mutations in the same gene affect distinct alternative splicing events in cancer patients of the same cancer type. Model-2: different mutations in the same gene affect distinct alternative splicing events in cancer patients across different cancer types. (C and D) Fraction of different types of mutation-AS pairs. DM, different mutations; SA, same AS event; DA, different AS events. Violin plots show the proportion of DM-SA and DM-DA in the same cancer type (C) or across distinct cancer types (D). Statistical differences are calculated by Wilcoxon rank-sum test (***, p<1.0e-32). (E) The number of cis-AS events compared to 1,000 random selections of protein pairs of the same number to evaluate statistical significance. (F) cis-AS example showing mutations in IKZF1 mediating its own AS. The panel shows the exon structure and two representative AS events influenced by two mutations in the same gene. (G) P-values (log10 transformation, hypergeometric test) for driver gene enrichment analysis for RNA-binding proteins across cancer types. The numbering of cancer types is the same as in Figure 1. (H) Proportion of RBP binding target genes identified by CLIP-seq experiments, for the differential AS gene group versus the group of other genes. (I) trans-AS example showing mutations in the RBP gene EIF4E2 influencing the AS events of EIF4ENIF1 in breast invasive carcinoma (BRCA). The panel shows the exon structure of the target gene EIF4ENIF1 and two representative AS events in EIF4ENIF1 influenced by two EIF4E2 mutations. (J) Structural and functional features of the EIF4ENIF1 alternative splicing. The structure of EIF4ENIF1 is from the PDB database. The lost regions are marked with orange color. The possible functional consequences are shown on the right panel. See also Figure S4.
Figure 5
Figure 5. Alternative Splicing Perturbation Reveals Cancer Subtypes with Distinct Clinical Features
(A) The workflow to discover the clinical associated AS events. The tumor samples in each cancer type were divided into discovery set and validation set. Cox regression model was trained using the discovery set and validated in the remaining samples. AS events with concordance index greater than 0.5 and p-value less than 0.05 were identified as clinical associated. (B) The survival differences of different cancer subtypes revealed by alternative splicing clustering analysis. The cancer samples are randomly divided into the same number of subtypes as revealed by AS clustering, and the survival difference p-values are calculated by log-rank test. −log10(p) values are plotted as boxplots. The log-rank p values obtained in real conditions are marked with red dots. The numbering of cancer types is the same as in Figure 1. (C) Consensus clustering of LIHC patients (n=371) based on the mutation-mediated AS events. The color intensity indicates the consistency (ranging from 0 to 1, from light to dark blue) for each pair of samples that are clustered together in 100 times of sampling. (D) Kaplan-Meier plot of survival for five subtypes in LIHC. The survival difference among five clusters is calculated by log-rank test (p=4.61e-3). (E) Overlap of mutated genes that mediate AS events in five subtypes. The top enriched functional terms by the mutated genes are marked. (F) Consensus clustering of LGG patients (n=514) based on the mutation-mediated AS events. The color intensity indicates the consistency (ranging from 0 to 1, from light to dark blue) for each pair of samples that are clustered together in 100 times of sampling. (G) Kaplan-Meier plot of survival for five subtypes in LIHC. The survival difference among five clusters is calculated by two-sided log-rank test (p<2.2e-16). See also Figure S5 and Table S4.

References

    1. Barabasi AL, Gulbahce N, Loscalzo J. Network medicine: a network-based approach to human disease. Nature reviews. Genetics. 2011;12:56–68. - PMC - PubMed
    1. Barabasi AL, Oltvai ZN. Network biology: understanding the cell’s functional organization. Nature reviews. Genetics. 2004;5:101–113. - PubMed
    1. Barash Y, Calarco JA, Gao W, Pan Q, Wang X, Shai O, Blencowe BJ, Frey BJ. Deciphering the splicing code. Nature. 2010;465:53–59. - PubMed
    1. Braunschweig U, Barbosa-Morais NL, Pan Q, Nachman EN, Alipanahi B, Gonatopoulos-Pournatzis T, Frey B, Irimia M, Blencowe BJ. Widespread intron retention in mammals functionally tunes transcriptomes. Genome research. 2014;24:1774–1786. - PMC - PubMed
    1. Braunschweig U, Gueroussov S, Plocik AM, Graveley BR, Blencowe BJ. Dynamic integration of splicing within gene regulatory pathways. Cell. 2013;152:1252–1269. - PMC - PubMed

LinkOut - more resources